- Submissions

Full Text
Trends in Telemedicine & E-health
Mobile App for Self-Controlling Type 2 Diabetes Mellitus: Implementation and QoE Evaluation
S Hamrioui 1, S Gongora Alonso 2, I de la Torre Díez 2*, P Lorenz 3, M López-Coronado 2, B Sainz de Abajo2 and Joel JPC Rodriges4
1 Bretagne Loire and Nantes Universities, France
2 Department of Signal Theory and Communications, University of Valladolid, Spain
3 University of Haute Alsace, France
4 National Institute of Telecommunications (Inatel), Santa Rita do Sapucaí, MG, Brazil
*Corresponding author:Isabel de la Torre Díez, Department of Signal Theory and Communications, University of Valladolid, Valladolid, Spain
Submission: June 26, 2018;Published: July 26, 2018

ISSN: 2689-2707 Volume 1 Issue 1
Abstract
Type 2 diabetes mellitus is a set of metabolic disorders characterized by an increase of blood glucose. The management and progression of diabetes is linked to the behaviour of the patients, since to control their blood glucose levels they must perform a regular physical activity, control diet and weight, and if necessary use medication. Today the proliferation of mobile devices has led to the existence of millions of apps relating to mhealth. Among the advantages of this type of apps is to self-management of the patient diseases. Diabetes can be controlled through the mobile devices. The main objective of this paper is to develop and evaluate the Quality of Experience (QoE) of an Android mobile app for self-controlling of patients with type 2 diabetes mellitus. A total of 50 type 2 diabetic people answered the QoE survey. Most of the questions are based on Likert scale. Most users appreciate the presented information quality. The app can help in the traditional diagnosis method, but 69% of users do not have a clear opinion.
keywords: Diabetes; Mobile app; Patient; Self-control; QoE
Introduction
Type 2 diabetes mellitus is a metabolic disorder whose main characteristic is high level of sugar (glucose) in blood, caused by insulin resistance [1-2]. Diabetes is a chronic disease, so it is essential to periodically monitor patient to assess the disease status, treatment effectiveness and prevent complications [3-5].
The analyzes that a physician performs to a patient as routine control can be done today by the patient of simple way through the respective measuring devices [6-7], so the patient can take their own self-control and thus make changes in your routine, in your insulin dose or diet, and in exceptional cases consult your specialist [8].
The physician follow-up aims to keep the patient at the levels closest to the normal range to carry a healthy and active life, for this purpose are perform mainly controls of two parameters: glucose and HbA1c [9], in addition to blood pressure, exercise and feeding [10].
To achieve a rigorous control of diabetes (children should not undergo this control type), the patient should give more attention to their diet and exercise [11] and measure their blood glucose levels more frequently, at this point is where enter the scene new technologies [12], which now can be used for many utilities. In this paper the development and subsequent Quality of Experience (QoE) evaluation of a mobile app to self-control type 2 diabetes is shown. This mobile app has been developed for one of the main operating systems on mobile devices such as Android and has been used C# programming language. To carry out this development has been used Xamarin development platform which allows interpreting the C # code and converting it to the main development language of Android, Java, in addition to IDE Visual Studio. For the data storage entered by the user has been used SQLite database management system to data store in the device internal memory. After developing the app was carried out an online questionnaire to calculate QoE. 50 diabetic people answered the questions. The remainder of the paper is organized as follows. Section II elaborates on used methodology. The results analysis is presented in Section III. Finally, Section IV concludes the paper.
Methodology
For the application development it has been necessary to follow a fixed methodology based on specific resources such as: operating system, programming language, development platform, development environment and database management system.
Flow diagram
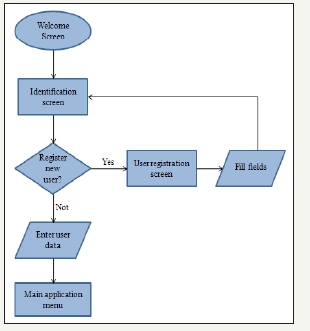
Once are clarified functionalities that should be included in application, the flow diagram is made that corresponds to the different processes can perform application. The first part of the application (login) should consist of 2 processes: Register a new user and identify user (Figure 1).
Figure 1:Flow Diagram of main app.

QoE questionnaire
To evaluate the experience carried out, patients were passed the survey that shown in Table 1. It is based on the Likert scale, in which the surveyed evaluates each question with a value from 1 to 5, being 1 “Totally disagree” and 5 “Totally agree”.
Table 1: Evaluation survey.

Results
Final application
The development carried out has resulted in a tracking application, capable of receiving data on personal measurements and storing in telephone database and visualizing both graphically (bar diagrams) and in the history form.
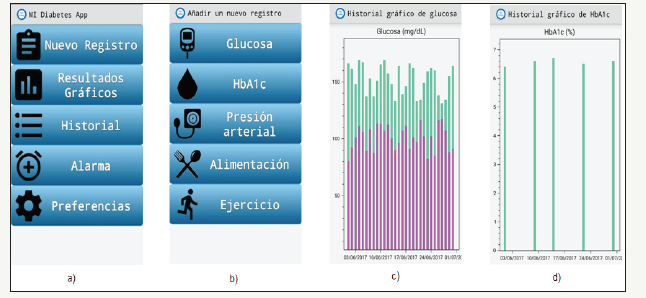
At the app start is displayed for 2 seconds a welcome screen where you can read “Welcome to my diabetes app” along with the application logo and a background image representing a blood sample to measure glucose, a very representative image of the disease. In Figure 2a is shown the application main screen.
The New Registry window (Figure 2b) implements a button to add a new annotation to each of the 5 parameters that can be tracked. All the windows that open when press their respective button have a similar appearance, but with some details that differentiate. Figure 2c & Figure 2d show how to represent measurements with the different units.
Figure 2:"My Diabetes” app. Part a) Main screen. Part b) New registry screen. Part c) Diagram of glucose - mg / dL. Part d) Diagram HbA1c-Percentage.

The fourth window that can be accessed from the main menu is the “Alarm reminder”. On this screena clock appears, which is used to time select to alarm set; a brief text indicating that the button must be pressed to alarm on or off (according to the current status); and a button that shows the current status of the alarm and is used as an on / off switch for the alarm. When the button is enabled, alarm will be set at time indicated on clock and will be displayed message with text “Alarm activated”. When the button is disabled, the alarm will go off. If you want to alarm time change while is enabled must be turned off, select the new time and restart.
QoE evaluation
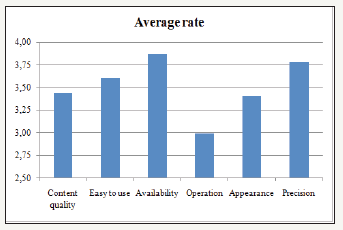
After performing the survey were obtained a total of 50 responses of diabetic people. As it has been verified in previous table, most of the questions are based on Likert scale, while three of them offer the possibility user to show their opinion. All the answers based on Likert have been collected in the following Table 2, have been classified according to the possible values for each question. The last two columns represent the average score and standard deviation for each question. Figure 3 show the average scores obtained for each block of the survey, obtaining all them a score higher than 2.5 points.
Figure 3:Average rating per block.

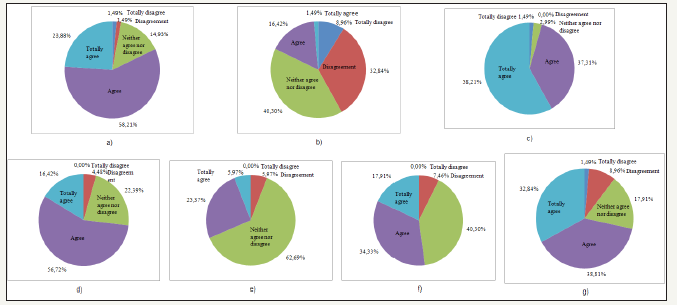
Analyzing each survey block can be extracted valuable ideas to assess the user experience quality. Regarding the Figure 1 “Content quality” block, most users ensure that app performs the function they expected, as shown in Figure 4a. As to whether users could do same without using the tool offered by the application, most think that the tool use does not interfere with their task, reflected in Figure 4b.
Figure 4:Results for: Part a) Does application perform the expected function?. Part b) You could do same without the application?. Part c) Believe that information is reliable?. Part d) You have found what you needed?. Part e) Believe that traditional method is more difficult or does not exist?. Part f) The application could have a more optimized operation?. Part g) The appearance of this application is adequate?

About the confidence in the information contained, practically all users think that clinical information of the app is very reliable, as shown in Figure 4c. In the “Ease of Use” block, most users found what hewanted while using the application, which means that tool is intuitive as shown in Figure 4d.
25% of users think that the app can help in the diagnosis traditional method, but 69% of users do not have a clear opinion and are moderately agreement with the question, as shown in Figure 4e. As for the“Operation” block, most users think that application could present a more optimized operation, but they are satisfied withits operation, as shown in Figure 4f. Regarding the“Appearance”, about 72% of users are very satisfied with the app design and appearance, which is reflected in Figure 4g. Despite not has reached the hundred users, the responses number is considerable, and so can be take good conclusions after analyzing the survey responses.
The evaluation of each block has obtained a rating higher than average value. Most users surveyed agree that app performs the function expected, and they really appreciate the presented information quality. As for the appearance, they agree that is an intuitive application and its appearance is appropriate.
Conclusion
In the developed app, the data visualization in list or history form is carried out instantaneously, this demonstrates that database query through SQLite is really fast.The time to visualize bar graphs is logically dependent on number of stored records, since it requires more resources to print graphic elements than text printing.In the mobiles case with less power, as in this case the first device, the time increases with respect to other mobiles, especially when data load is quite high. The results indicate that is slight application, and if a large number of data is reached the response times forthe data representation are practically inconsequential and even treat with quantities of 1000 records the application handling is not excessively tedious.
Acknowledgment
This research has been partially supported by the European Commission and the Ministry of Industry, Energy and Tourism under the project AAL-20125036 named “WetakeCare: ICT- based Solution for (Self-) Management of Daily Living”.
References
- Bashshur RL, Shannon GW, Smith BR, Woodward MA (2015) The empirical evidence for the telemedicine intervention in diabetes management. Telemed J E Health 21(5): 321-354.
- Berman MA, Guthrie NL, Edwards KL, Appelbaum KJ, Njike VY, et al. (2018) Change in glycemic control with use of a digital therapeutic in adults with type 2 diabetes: Cohort study. JMIR Diabetes 3(1): e4.
- (2018) International Diabetes Federation. Belgium.
- (2018) The global diabetes community.
- (2018) World Health Organization. Geneva, Switzerland.
- Barreda-Pérez M, de la Torre I, López-Coronado M, Rodrigues JJ, García de la Iglesia T (2013) Development and evaluation of a web-based tool to estimate type 2 diabetes risk: Diab_Alert. Telemed J E Health 19(2): 81-87.
- Hall RF, Joseph DH, Schwartz BD (2003) Overcoming obstacles to behavior change in diabetes self-management. Diabetes Educ 29(2): 303-311.
- Schmocker KS, Zwahlen FS, Denecke K (2018) Mobile App for simplifying life with diabetes: technical description and usability study of GlucoMan. JMIR Diabetes 3(1): e6.
- McKenzie AL, Hallberg SJ, Creighton BC, Volk BM, Link TM, et al. (2017) A novel intervention including individualized nutritional recommendations reduces hemoglobin A1c level, medication use, and weight in type 2 diabetes. JMIR Diabetes 2(1): e5.
- Garcia ZB, de la Torre Díez I, Sainz de Abajo B, López CM (2016) Development, technical and user evaluation of a web-mobile application for self-control of diabetes. Telemedicine Journal and e-Health 22(9): 778-785.
- Broadbent E, Donkin L, Stroh JC (2011) Illness and treatment perceptions are associated with adherence to medications, diet, and exercise in diabetic patients. Diabetes Care 34(2): 338-340.
- Chomutare T, Fernandez LL, Arsand E, Hartvigsen G (2011) Features of mobile diabetes applications: review of the literature and analysis of current applications compared against evidence-based guidelines. J Med Internet Res 13(3): e65.
© 2018 I de la Torre Díez. This is an open access article distributed under the terms of the Creative Commons Attribution License , which permits unrestricted use, distribution, and build upon your work non-commercially.
 a Creative Commons Attribution 4.0 International License. Based on a work at www.crimsonpublishers.com.
Best viewed in


.jpg)


 Editorial Board Registrations
 Submit your Article
 Refer a Friend
 Advertise With Us
.jpg)


.jpg)


.bmp)
.jpg)
.png)
.jpg)


.jpg)


.png)

.png)


.png)


