
- About Us
- Information
-

The Author ensures that the research has been conducted responsibly and ethically with adherence to all relevant regulations. read more..
- For Authors
- For Reviewer
- Manuscript Guidelines
- Membership
- Publication Ethics
-
- Journals
- Reprints
- e-Books
- Videos
- Policies
- Contact Us
 COVID-19
- Submissions


Full Text
Trends in Textile Engineering & Fashion Technology
The Conception and Measurements of “Average Stress-Strain Curves” for Fibrous Materials
Yi Chen1, Minzhuo Du1, Fisseha W Asmare1,2, Xiaodong Liu1,Tiejun Shi3, Kan Zhang4, Puxin Zhu4, Ruixia Li1,4, Shaw L Hsu5 and Dacheng Wu1,4*
1Chengdu Textile College, Chengdu, China
2Ethiopian Institute of Textile and Fashion Technology, Bahir Dar University, Ethiopia
3School of Chemistry and Chemical Engineering, Hefei University of Technology, China
4Textile Institute, Sichuan University, Chengdu, China
5University of Massachusetts, Amherst, USA
*Corresponding author:Dacheng Wu, Textile Institute, Sichuan University, Chengdu, Sichuan 610065, China
Submission: May 27, 2023; Published: June 08, 2023

ISSN 2578-0271 Volume 8 Issue4
Abstract
The macroscopic and phenomenological stress-strain curves of various natural and synthetic fibers have been analyzed without the need to consider microscopic mechanisms. A new concept involving the “average stress-strain curve” or contour line for fibrous materials was proposed and used to successfully analyze the extremely large data sets obtained for wool and PET (polyethylene terephthalate)-POY (partially oriented yarn) fibers. This new method is necessary to quantitatively analyze the mechanical properties of fibrous materials. Our method proved to be useful to eliminate the significant statistical fluctuations that are usually attributed to sample deviations of fibers. Based on the relationship between experimentally measured load-extension, the stress σf at each point during the entire process of strain development from 0 to εf was averaged. The need to truncate parts of the experimental data at fracture proved to be crucial. From a purely mathematical point of view, two averaging methods for stress under a given strain can be applied. One is to average based on sample size and the other based on sample size immediately before fracture. The physical bases of the two methods are proposed. This concept and method are expected to be extended to other types of materials to obtain their “average stress-strain curve”.
Keywords:Mechanical properties; Stress-strain curve; Fracture strength; Elongation at break; Wool; PET; POY
Introduction
The stress-strain curve is the fundamental and most used measurement of mechanical properties of solid materials [1], including fibrous ones [2,3]. For example, the elongation at break determines the specific application of all materials. Typically, a tensile test is used to obtain the load-extension (load-elongation) curve of a sample, which can be converted into a stress-strain curve based on the geometric dimensions and density of the material. In this conversion, if the load of the sample is divided by its initial cross-sectional area, it is defined as the nominal stress or engineering stress. When an instantaneous cross-sectional area is utilized, a true stress can be obtained. Similarly, the linear elongation is generally referred to as the nominal strain, and the logarithmic value of the tensile ratio is defined as the true strain. Because the difference between load-extension and stress-strain curves is only a numeric coefficient, it is then possible to plot them in the same graph. In solid mechanics the stress is expressed usually in units of force (load)/ unit cross-sectional area, i.e., N/mm2 or Pa. However, the fineness (tex) of a fiber or yarn is expressed in terms of average linear density, the definition of which is the mass in grams of one kilometer of the fiber or yarn [4]. So, the tensile stress of the fibrous product is expressed in the system of N/tex. The conversion factor between two system is 1 N/tex= (1 N/mm2) ×1000ρ, where ρ is the density of fiber in the unit of g/cm3. This convention will be used in the following discussion. The strength of fibers expressed in such a system of tex is often referred to as tenacity. The following discussion in this article is focused on the relationship between nominal stress and nominal strain, but its concept and treatment method are also applicable to the study of true stress-true strain curve in principle.
Generally, the significance of strength and elongation at break of a material is very clear. Often the actual stress-strain curve itself is not utilized. For wool fibers [5], its stress-strain curve is readily available and often presented clearly as well-defined plots. However, anyone who has performed this type of experiment knows that each measurement cannot be completely identical to the previous one. In other words, the reproducibility of the entire curve is poor and varies from sample to sample, thus using an average is a prudent strategy.
In fact, the tensile testing of fibrous materials has a history of nearly a century. Engineers and scientists have recognized that, due to the inherent non-uniformity of the sample, its measurement exhibits probabilistic characteristics, and therefore they define strength and elongation at break using average values. In some existing literature [2] authors have noted this statistical character and only provided “typical” stress-strain curves. However, how to select “typical” curves is not clearly described. Based on our experience with polymer fibers [5], the stress-strain curve, the endpoint values of which equal the average strength and elongation at break, can be defined as “typical” curves. We wish to establish this hypothesis both theoretically and experimentally.
For natural or chemical fibers, because their generation or
manufacturing conditions cannot be completely uniform and
therefore their mechanical properties cannot be a single definite
value but in the various form of probability distributions. As the
simplest generalization, this non-uniformity can be divided into
two types:
A. Geometric and size non-uniformity, primarily the nonuniformity
of cross-sectional diameters if the cross-section is
assumed to be circular.
B. The non-uniformity of the microstructure of the fiber
polymer, particularly the non-uniformity of its semi-crystalline
and orientation structures, also has a fundamental impact on its
stress-strain behavior. To quantitatively characterize the various
relationships that affect the stress-strain behavior, a more in-depth
study of the stress-strain curve is required.
In material science research, many aspects of research on the stress-strain curve have been carried out, especially focusing on its relationship with the microstructure (e.g., degree of crystallinity, segmental orientation…) of the material. It is believed that the macroscopic and phenomenological theory of stress-strain curve still needs investigation in depth. To investigate the statistical distribution of mechanical behavior for materials that requires over 102 experimental data points to average, fiber samples that are easy to prepare and test for stress-strain curves, wool and PET (polyethylene terephthalate)-POY (partially oriented yarn) fibers are used as examples of fiber materials. This concept and method are in principle applicable to averaging stress-strain curves for any class of materials.
Experimental Results and Discussion
Measured stress-strain curves of wool and PET-POY fibers
Samples: The wool fibers were provided by Xinjiang Tianshan Wool Textile Co., Ltd. (natural wool fiber) with a linear density range of 3.22-4.06 (average value of 3.64) dtex. The linear density testing instrument used was an XD-1 fiber fineness meter manufactured by Shanghai New Fiber Instrument Co., Ltd. The single fiber vibration method was used for measurement. For stress-strain curves of wool the testing instrument used was an XQ-2 fiber strength tester manufactured by Shanghai New Fiber Instrument Co., Ltd. By using this tensile tester, the gauge length of specimen fiber was 10mm and elongation rate of 10mm/min. Testing conditions: the room temperature was 25 ℃ and relative humidity 80%.
The PET-POY fibers were provided by the Fiber Materials Innovation Center of Chengdu Textile College. The PET-POY filaments are fabricated by melting spinning with winding velocity of 3500m/min at the melting temperature of 28 ℃. The linear density of the single fiber is 6.19dtex (testing instrument same as above). The testing instrument of stress-strain curve for PET-POY fibers was the same as that above.
As the stress-strain curve is heavily dependent on the testing speed and clamp length, this study selected a stretching rate of 20mm/min for wool fibers and 40mm/min for PET-POY fibers, with a clamp length of 20mm for both.
Figure 1:Ten plots of load-extension curves for wool fibers.

A sample size of N=10 was selected, and the test results of wool fibers and PET-POY fibers were plotted in (Figures 1&2), respectively. This figure shows that for wool fibers, the experimentally measured stress-strain curves have significant scatter, and it is difficult to select a “typical” stress-strain curve; for PET-POY fibers, the obtained stress-strain curves have less scattering and more consistent shapes. The reason for this difference is due to the complex fiber formation conditions, including genetic and environmental. The diameter and structure of natural fibers are very different from each other, while differences in diameter and structure for PET-POY fibers are relatively small. The method we provide is to eliminate these differences and obtain a reasonable “average stress-strain curve” for a certain type of sample.
Figure 2:Ten plots of load-extension curves for PETPOY fibers.

Calculating formula of the contour for average stressstrain curve
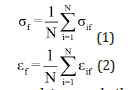
Assuming the tensile tests of material samples are measured N times, and the strength and fracture strain for the i-th measurement are σif and εif, respectively, the arithmetic mean values σ and ε for N measurements can be obtained by summing all the data and dividing by N:
However, in many cases, data on only the average stress and strain at fracture are not sufficient and more information is needed. In solid mechanics, the stress-strain curve is the most important characterization of the sample. Its definition is as follows:
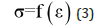
Where f is a certain functional relationship, which can sometimes be approximated by a mathematical formula. Plotting this relationship is what is usually referred to as the stress-strain curve.
The stress-strain curves obtained from multiple measurements of similar samples can differ making it necessary to first define the “average stress-strain curve”. For the relationship between stress and strain, the entire process of developing strain from 0 to εf (or stress from 0 to σf) must be averaged point by point. From a purely mathematical point of view, there are two methods for averaging stress at a given strain: one is to average by the total number of samples, and the other is to average by the number of samples that have not yet fractured.
1. Assuming N stress-strain curves have been measured, the average stress-strain curve can be obtained by averaging over the total number of samples:
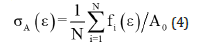
where A0 is the initial section area of the sample and the σA(ε) in the above formula is the average of N measured stresses at strain ε. This type of averaging can be easily achieved in the Excel data output by the stretching material testing instrument. Through theoretical and experimental comparative studies, it has been proven that the first averaging method has a clear physical meaning. If a single fiber is taken as a sample, the result obtained according to equation (4) is the stress-strain curve of the untwisted long filament yarn composed of such single fibers, which has been fully verified using PBO fibers as an example [6].
2. If the stress-strain curve is averaged based on the number of samples that have not yet fractured, another type of average stressstrain curve can be defined. In this case, the other averaging way leads to:
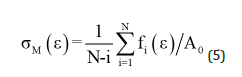
where A0 is the initial section area of the sample and the parameter σM(ε) is the average value of the N-i values that have not fractured out of the N samples at the strain of ε and can be easily averaged using Excel data.
Contour of average stress-strain curve based on experimental data
In the tensile stress-strain test, 500 single wool fibers and 500 PET-POY fibers were tested as one group. The raw data of the elongation rate and corresponding load at each point in the experiment were recorded using Excel. Based on this table, the average stress-strain curve defined by equation (5) can be easily calculated and plotted.
Based on the digitization of the tensile instruments, the fiber stress-strain curve is composed of pairs of data points representing the change in elongation value of 0.1mm and its corresponding stress value. In this study, if the clamping length is 500mm and the elongation at break rate is 40%, a curve will contain 2000 pairs of data. With 500 samples, this involves 106 pairs of data. Although it only involves elementary arithmetic. For early fiber scientists who first proposed wool stress-strain testing in the 1920s, it was obviously impossible to propose and solve such average problems due to limitations of testing equipment and data processing methods.
Since both wool and PET-POY fibers were tested 500 times, the results were averaged according to sample size N=10, 50, 100, 250, and 500 by using equation (5). The results are shown in Figures 3&4, respectively.
Figure 3:Plots of the contour of the “average” stressstrain curves for wool fiber according to equation (5) with sample size N=10, 50, 100, 250, and 500.

Figure 4:Plots of the contour of the “average” stressstrain curves for PET-POY fiber calculated using equation (4) with sample size N=10, 50, 100, 250, and 500.

As sample size increases, the data converge to a single curve (use of equation (5)), but the tail end of the curve (5) fluctuates significantly due to the sharp decrease in the size of samples that have yet to fracture.
The physical meaning of eq. (5) is quite interesting. With this averaging method in mind, it is found that curves that break at lower strain contribute zero probability weight to the contour of “average stress-strain curve” and therefore should be deducted from the average, which is the underlying reason for using equation (5). When calculating each point, samples that have fractured before this point are no longer included in the sample set. This newly calculated curve is called the contour line of the average stressstrain curve. The segment of whole contour with the fluctuating tail represents the highest strength and elongation at break, which lose the validity of the average stress-strain curve, making it necessary to incorporate or reduce the effect of the “tail” of each contour.
Truncation of contour for average stress-strain curve based on experimental data
As demonstrated by the previous experimental data plot, equation (5) can simulate the contour of the average stress-strain curve, but in the latter half of the curve obtained by averaging the data, most of the fibers have already been broken reducing the size of the data set, making it impossible to accurately represent the behavior of most samples. Therefore, it is necessary to truncate the calculated contour curves. In this study we propose a reasonable conjecture: using the strain corresponding to a 50% fracture fraction on the fracture probability elongation curve as the fracture elongation of the fiber (Figures 5&6), and then using this fracture elongation, the corresponding fracture point can be obtained from the calculated average stress-strain curve.
Figure 5:Fracture probability distribution curve of 500 wool fibers.

Figure 6:Fracture probability distribution curve of 500 PET-POY fibers.

As mentioned earlier, there is a semi empirical method of placing the coordinate points of the average strength and elongation at break obtained from tensile experiments on the stress-strain diagram. As shown in Figures 7&8, this point happens to be located at a certain point on the convergence contour with a large sample size, which can be considered as the endpoint of the “average stress-strain curve”. For wool fibers and PET-POY fibers, this fracture point coincides with the fracture point corresponding to the 50% fracture probability mentioned above (Figures 7&8), indicating that the calculated average strength and elongation at break are almost identical to the experimental results (Table 1); the difference in calculated and experimental values is less than 5%.
Figure 7:Plots of 500 stress-strain curves for wool fibers and their “average stress-strain curve,” where □ is the fracture point for 50% fracture probability and Δ is the experimental average values of tenacity and elongation at break for wool fiber.

Figure 8:Plots of 500 stress-strain curves for PET-POY fibers and their “average stress-strain curve,” where □ is the fracture point for 50% fracture probability and Δ is the experimental average values of tenacity and elongation at break for PET-POY fiber.

Table 1.Comparison of experimental average strength and elongation at break with calculated values based on 50% fracture probability for two fiber materials.

The above discussion shows that this statistical method is reasonable, and the resulting curve of contour truncation can then be considered as an “average stress-strain curve”, which represents a typical value of the many curves obtained in experiments.
Conclusion
A new method is presented to define the average stress-strain curve obtained for many fiber samples. This method averages the curves obtained from multiple experimental measurements of similar products. When calculating each point, samples that have been previously fractured are no longer included in the sample set. This newly calculated curve is called the contour line of the average stress-strain curve. On the fracture probability-fracture elongation curve, taking a point with a probability of 50%, the corresponding fracture elongation can be used as the cutoff point of the contour line. The truncated contour line is the so-called average strain stress curve, and the stress corresponding to this cutoff point is the fracture stress or load.
From the experimental data of measured stress-strain curve, the average strength and fracture elongation can be obtained. The experimental error between them and the truncation point of the above average stress-strain curve is less than ± 5%. Experimental workers previously utilized a semi- empirical method in which the stress-strain curve where the crack point basically coincided with the measured average value could be identified as a typical curve. This work proves that the selection of this typical stressstrain curve is reasonable and basically consistent with the average stress-strain curve defined in this article. The theoretical and experimental methods in this article can be extended to the averaging of the stress-strain curves for other types of materials.
References
- Mayers M, Chawla K (2009) Mechanical behavior of materials. (2nd edn), Cambridge University, UK.
- Morton WE, Hearle JWS (2008) Physical properties of textile fibres. (4th edn), Woodhead, Cambridge, UK.
- Hearle JWS, Grosberg P, Backer S (1969) Structural mechanics of fibers, yarns, and fabrics. Wiley-Interscience, New York, USA.
- McIntyre JE, Daniels PN (1995) Textile terms and definitions. (10th edn), The Textile Institute, Manchester, UK.
- Simpson WS, Grawshaw GH (2002) Wool: Science and technology. Woodhead, Cambridge, UK.
- Kang Z, Liu X, Fisseha WA, Zhu P, Li R, et al. (2020) Probabilistic model for structural mechanics of fiber bundle and its application to PBO fiber. The Journal of the Textile Institute 112(1): 138-143.
© 2023 Dacheng Wu. This is an open access article distributed under the terms of the Creative Commons Attribution License , which permits unrestricted use, distribution, and build upon your work non-commercially.
Editor In Chief


.jpg)


Signup for Newsletter

Quick Links
 Editorial Board Registrations
 Submit your Article
 Refer a Friend
 Advertise With Us
Our Recent Edition

.jpg)


Top Editors


.jpg)


.bmp)
.jpg)
.png)
.jpg)


.jpg)


.png)

.png)


.png)


Financial Support

Sponsors

Latest e-Books

Latest Video

 a Creative Commons Attribution 4.0 International License. Based on a work at www.crimsonpublishers.com.
Best viewed in
a Creative Commons Attribution 4.0 International License. Based on a work at www.crimsonpublishers.com.
Best viewed in