- Submissions

Full Text
Trends in Textile Engineering & Fashion Technology
A Comparative Study on Discharge Printing Using Conventional and Ecological Recipe
Seema HS1*, Deepika L2 and Ambika Babu3
1 Department of Fashion Technology, Ethiopian Institute of Textile and Fashion technology, Bahir Dar University, Ethiopia
2 Entreprener, weaving enterprise, India
3 Department of Fashion Technology, Ethiopian Institute of Textile and Fashion technology, Bahir Dar University, Ethiopia
*Corresponding author: Seema HS, Department of Fashion Technology, Ethiopian Institute of Textile and Fashion technology, Bahir dar university, Bahir dar, Addis Ababa, Ethiopia
Submission: March 16, 2018; Published: June 06, 2018

ISSN 2578-0271 Volume3 Issue1
Abstract
Textile printing is an ancient art from the Egyptian tomb era to a modern era, which is one of the most important processes for the manufacturers. Art being a creative pattern of imagination and immense competition and globalization in the textile world, were the key major concern for the manufacturers is from the customer who are mostly looking for eco-friendly products, textile printing has become more dependable on the science than it was. The discharge printing methods is one of the popular techniques used major for its aesthetic attractiveness of the product. Discharge printing has opened the door over past 6-7 years for the mass garment production after developing a dischargeable ink system. Mostly 20-30% of the chemicals are used in one cycle of printing which are hazardous to the environment and some of the chemical methods, toxins like carbon monoxide, sculphur dioxide, zinc oxide and many more which harms the environment. The main objective of the study is to compare the conventional and ecological discharge printing paste by developing a hand screen printing on reactive dyed cotton and silk fabric and tests conducted on the different parameters of the printing paste to understand the effluent level to the environment.
Keywords:Discharge printing; Ecological printing; Hand screen
Introduction
Textile printing is an ancient art form found on cloth in Egyptian tombs dating to about 5000B.C. Greek fabrics dating from the 4th century B.C. have also been found. Block Prints were first seen exported from India to the Mediterranean in 5thB.C.
Textile printing is probably best described as an industrial art, having a long history and an assured future. It has become more dependent on the sciences than it was, but will always be a multidisciplinary activity, requiring more than a knowledge of science and technology.
Printing applications by screen printing are of great importance with the increased concernment of small lot production and fashion related products due to the severe competitive conditions of the textile industry. Discharge printing method is one of the popular techniques in these applications due to the aesthetic attractiveness.
Discharge printing has been around for decades. But only in the past 7-8 years screen printers in the industry have recognized it seriously. In the early years of discharge printing, the finished discharge print needed to be steamed during the drying process. This discouraged the use of discharge systems in the finished garment arena. The newly developed discharge ink systems are chemically reactive and don’t need to be seam-neutralized. This advancement opened the door to discharge printing for the average screen printer
Discharge Printing is also called Extract Printing. This is a method of applying a design to dyed fabric by printing a colordestroying agent, such as chlorine or hydrosulfite, to bleach out a white or light pattern on the darker colored ground. In colordischarge printing, a dye impervious to the bleaching agent is combined with it, producing a colored design instead of white on the dyed ground.
Objective
a. To develop the Hand screen.
b. To study the degree of whiteness on the printed material.
c. To study the effluent of conventional discharge paste and ecological discharge paste.
d. To study the tensile strength and abrasion on the printed material
Review of literature
Karthikeyan & Bharathi [1], “New method of discharge printing on cotton fabrics using enzymes” The Indian Textile Journal November 2011 issue. The article as discussed about replacement of this hazardous chemical with eco- friendly enzymes in textile discharge printing. Enzymatic discharging printing carried out with Phenol oxidizing enzyme such as Peroxidase with hydrogen peroxide by selectively discharged reactive dyes from the cotton fabric at selected areas creating a printed surface.
Ragheb et al. [2] Textile Division, National Research center, Dokki, Cairo, Egypt. “Bio-discharge printing on cotton knitted fabrics using enzyme and brewer’s yeast”.
Research and Markets reports/1898934/pg 1-2. Innovative technology to use Eco- friendly bio materials comprise Laccase, Valumax A828, Valumax A356 as well as brewer’s yeast to replace the hazard chemicals which are used in discharge printing has been done successfully. The effect of technique applied enzyme concentration, pH of the printing paste, enzymatic treatment time and temperature on as well as the nature of reactive dye used on the colour discharge were studied to obtain the optimum conditions. Successfully results were obtained on using Laccase enzyme and brewer’s yeast as a bio discharging agent instead of unecofriendly reducing agents. The activity of the used biomaterials follows the order laccaze enzyme, Brewer’s yeast, Valumax A828, Valumax A356. Samples of different attractive coloured halftones could be obtained.
Thalouth et al. [3], “Eco-friendly discharge printing on cotton fabrics using laccase enzyme” Indian Journal of Fibre & Textile Research. Laccase enzyme formulation has been used in discharge printing of cotton fabrics dyed with different reactive dyes and the effect of enzyme conc., pH of the printing paste, treatment time and temperature of enzymatic treatment as well as the viscosity of the printing paste on colour discharge studied. The optimum conditions for discharge printing are found to be 4.5 pH, 6 °C temperature, 1h time of treatment, and the 90.4 poise viscosity at a shear rate of 31.61s. The concentration of enzyme depends on the nature of dye used.
Gregory K Hall, Woodbury & Charles W Stewart. “Enzymatic discharge printing of dyed textiles”. EP 0975832 A1 (text from WO1998046820A1A). Process for enzymatic discharge printing of the surface of dyed fabric, especially cellulosic fabric such as denim, including an oxidoreductase and enhancing agent system.
Haggag et al. [2] Textile Division, National Research Center, Dokki, Cairo, Egypt. “A review article on enzymes and their role in resist and discharge printing styles” science journal. The current review summarizes textile styles and printing methods. Where, there are three basic styles to print a color on fabric namely: (a) direct, (b) discharge and (c) resist. While printing methods comprise: (a) block, (b) roller, (c) screen, (d) rotary, (e) transfer, (f) foam and digital “ink jet” printing. The theory of discharge printing involves the degradation, by chemical reagents; of the chromophore system of dyestuffs applied to the textile material, most of them are hazardous chemicals. However, recently, the environmental and industrial safety conditions increased the potential for use of enzymes in textile processing to ensure eco-friendly production. The present review fulfils the following items: (a) application of enzymes in textiles, (b) factors affecting enzyme activity and (c) enzyme inhibitors.
Yavas A & Cay A, Pamukkale University, Department of Textile Engineering, Denizli, Turkey,”A study on the process parameters of discharge printing of cotton fabrics”. Discharge printing of cotton fabrics with sodium- and zinc formaldehyde sulphoxylate with different fixation conditions was discussed in this study. Superheated steam, saturated steam and thermofixation were used for fixation processes. It was observed that steam based fixations resulted in the higher discharging effects, while thermofixation lead to an inadequate effect even in higher temperatures. Superheated steam was found to be advantageous in terms of lower fixation times. Sodium formaldehyde sulphoxylate gave superior discharging effects compared with zinc formaldehyde sulphoxylate, which caused higher strength loss especially in superheated steam fixation. Furthermore, the effects of the softeners on the discharge printing results were also investigated in the scope of the study.
ZHOU Qiu-bao “Discharge printing of the real silk fabric with vat dyes”, Journal Of Textile Research. Discharge printing of the real silk fabric was performed with vat dye paste for printing the patterns and vinyl-sulfone reactive dye for the ground. The effect of vat dyes, reducing agents and alkali dosage on printing was analyzed. The color fastness and the strength of the printed silk fabric were tested with the purpose of investigating the possibility of this application. The result indicates that the application of vat dye paste to the discharge printing of real silk fabrics can obtain brilliant shade and good color fastness, but lower the strength of the fabrics.
Sudha S [4] “Genotoxic effects of textile printing dye exposed workers in india detected by micronucleus assay” Asian Pacific J Cancer Prev. The textile printing industry in South India employs a great number of workers that may possibly be exposed to toxic compounds. In the present study, subjects from textile printing units were investigated for the presence of genetic damage in their peripheral blood lymphocytes using micronucleus assay. Proliferation was also investigated using a nuclear division index. It was found that the micronucleus frequency was considerably greater in exposed subjects than in non exposed control subjects, but division was not increased in a statistically significant way. For the time being, this investigation should be considered as a preliminary study in which the influence of potential confounders could be adequately assessed. However, our results are nonambiguous, indicating.
Ramesh B, Parande AK, Raghu S & Prem KT, “Cotton textile processing: Waste generation and effluent treatment”. The Journal of Cotton Science. This review discusses cotton textile processing and methods of treating effluent in the textile industry. Several countries, including India, have introduced strict ecological standards for textile industries. With more stringent controls expected in the future, it is essential that control measures be implemented to minimize effluent problems. Industrial textile processing comprises pretreatment, dyeing, printing, and finishing operations. These production processes not only consume large amounts of energy and water, but they also produce substantial waste products. This manuscript combines a discussion of waste production from textile processes, such as desizing, mercerizing, bleaching, dyeing, finishing, and printing, with a discussion of advanced methods of effluent treatment, such as electro-oxidation, bio-treatment, photochemical, and membrane processes.
Wang J, et al. “Removal of organic compounds during treating printing and dyeing wastewater of different process units”. National Institutes of Health. Epub 2007 Nov 13. Wastewater in Shaoxing wastewater treatment plant (SWWTP) is composed of more than 90% dyeing and printing wastewater with high pH and sulfate. Through a combination process of anaerobic acidogenic [hydraulic retention time (HRT) of 15h], aerobic (HRT of 20h) and flocculationprecipitation, the total COD removal efficiency was up to 91%. But COD removal efficiency in anaerobic acidogenic unit was only 4%. As a comparison, the COD removal efficiency was up to 35% in the pilot-scale up flow anaerobic sludge bed (UASB) reactor (HRT of 15h). GC-MS analysis showed that the response abundance of these wastewater samples decreased with their removal of COD. A main component of the raw influent was long-chain n-alkanes. The final effluent of SWWTP had only four types of alkanes. After anaerobic unit at SWWTP, the mass percentage of total alkanes to total organic compounds was slightly decreased while its categories increased. But in the UASB, alkanes categories could be removed by 75%. Caffeine as a chemical marker could be detected only in the effluent of the aerobic process. Quantitative analysis was given. These results demonstrated that GC-MS analysis could provide an insight to the measurement of organic compounds removal.
Rathore [5] “Studies on pollution load induced by dyeing and printing unit in the river bandi at pali, Rajasthan, India” International Journal Of Environmental Sciences. Around 49 Mld of combine effluent from more than 800 textile dyeing and printing industries with domestic sewage is discharge in the Bandi river at Pali. The physico-chemical parameters Cl_, SO4, NO3, suspended solids, chemical oxygen demand and biological oxygen demand assessed in the combine effluent were higher than the recommended standards for discharge of industrial effluents by BIS. the overall pollution load in Bandi river in terms of chemical oxygen demand, biological oxygen demand, suspended solids and total alkalinity is 57,520kg/day, 38,160kg/day, 61,950kg/day and 74570kg/day respectively. Therefore, the pollution load estimated clearly illustrates the environmental degradation in the study area to a great extent.
Material and Methods
Material (Figure 1 & 2)
Cotton is a soft, fluffy staple fiber that grows in a boll, or protective capsule, around the seeds of cotton plants of the genus Gossypium. The fiber is pure cellulose. Under natural condition, the cotton balls will tend to increase the dispersion of the seeds. The plant is a shrub native to tropical and subtropical regions around the world, including the Americas, Africa, and India [6]. The fiber is most often spun into yarn or thread and used to make a soft, breathable textile. The use of cotton for fabric is known to date to prehistoric times.
Figure 1: Cotton.
Figure 2: Mulberry silk.
Mulberry silk comes from the silkworm of the moth Bombyx Mori, which feeds on the leaves of the white Mulberry tree, Morus Alba. The silk cocoons are plucked, dried in the sun to kill the worm (before it can become a moth and break the cocoon) and then boiled in water to soften the fibre. The silky smooth filaments (fibres) are reeled carefully to make one long thread. Mulberry silk is soft, easy to dye and has good insulating properties. Silk filaments are approximately 900-1700 metres long. The diameter of the silk filament is from 9 to 11 microns. Silk has a smooth, soft texture that is not slippery.
Silk is one of the strongest natural fibers but loses up to 20% of its strength when wet. It has a good moisture regain of 11%. Its elasticity is moderate to poor: if elongated even a small amount, it remains stretched. It can be weakened if exposed to too much sunlight. It may also be attacked by insects, especially if left dirty [7]. Silk is a poor conductor of electricity and thus susceptible to static cling. Silk emitted by the silkworm consists of two main proteins, sericin and fibroin, fibroin being the structural center of the silk, and serecin being the sticky material surrounding it. The high proportion (50%) of glycine, which is a small amino acid, allows tight packing and the fibers are strong and resistant to breaking. Silk is resistant to most mineral acids, except for sulfuric acid, which dissolves it. It is yellowed by perspiration. Chlorine bleach will also destroy silk fabrics (Table 1).
Table 1: Physical Properties of cotton and mulberry silk.

Dye stuff
Remazols dyes are based on vinyl sulphone, it as the reactive group and are mainly used in the dyeing and printing of textiles.
Remazol ‘VS’ Brand dyes are reactive dyes possessing vinyl sulphone as the reactive group. In presence of alkali, these dyes chemically react with the hydroxyl group of cellulose and form firm, covalent linkages. These dyes are versatile enough to suit different dyeing methods. Results are excellent and shades come clean and brilliant with no variation in dyeing as well as in printing.
Remazols are suitable for dye bath, printing and painting on cotton, rayon and other regenerated cellulose materials. Best results are achieved in a dye bath at 40-60 0C. At this temperature better color yield is obtained. When printing with Remazols best result will be achieved by steaming. This particular group of reactive dyes belong to the vinyl sulphone range which makes them excellent for discharge printing and colored resist printing. Remazol dyes will also dye Silk and Wool in a HOT dye bath with a weakly acid pH of 4.5 to 5.0 [8] (Figure 3).
Figure 3: Mulberry silk.

Hand screen preparation
a. Screen Size: 8’’-6’’
b. Screen Mesh: Line artwork monofilament polyester mesh
c. Design: Floral (single motif)
d. Frame: Wooden frame (Figur 4)
Figure 4: Mulberry silk.

Preparation of the fabric for printing
Material Required
• Fabric
• Printing bed
• Ball pins
• Iron box
Reactive dyed fabric was ironed and creases were removed on the fabric.
Fabric was laid on the printing bed and then from one side all the four side of the fabric have to be pinned at the edges, this helps the fabric to stay on printing bed stiff and tightly. For marking on the fabric if necessary use same color of the fabric chalk to mark on the fabric [9].
Prepartion of the discharge printing paste
Conventional discharge paste:
Material
a) Zinc oxide
b) Rangolite C or sufolite
c) CMC gumming agent
d) Water if required
e) Steel container
f) Steel rodWeighing balance
Quantity required:
(Figure 5) One day before printing , thickening agent was prepared, 6gm of CMC and 94ml of water was added, and mixed well and made it into paste form. Paste was closed in an clean plastic container in room temperature. And left for 24hr and then used.Figure 5:
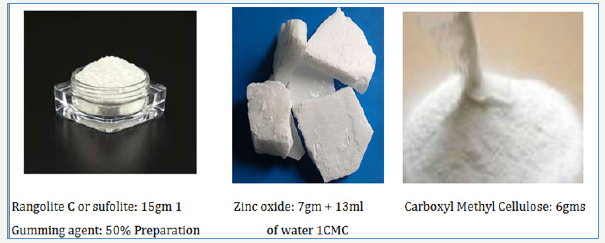
a. Sufolite: 15gms
Sufolite comes in form of hard cake. This has to be grind and made it into fine powder form.
b. Zinc oxide: 7gm preparation of the paste
i. In a clean container 7gms of ZNo and 13ml of water was added, mixed well and required consistency was maintained.
ii. Then sufolite was mixed with above mixture, same consistency was maintained,
iii. Then CMC 50% (which was prepared one day before) was added to this mixture and mixed well till the required consistency was achieved (if paste becomes thicken then the required consistency, little water can be added) conventional paste was ready to print.
Ecological discharge paste:
A. Material
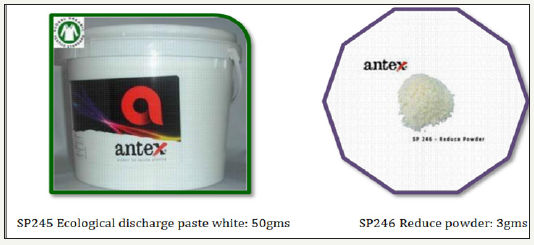
a) SP245 Ecological discharge paste white
b) SP246 Reduce powder
c) Steel container
d) Steel rod
e) Weighing balance
Quantity
Figure 6:
C. Preparation
Both paste and activator was mixed well in a container with respective quantities.
Printing on the fabric:
a) Mterials required
b) Printing screen
c) Squeezee
d) Discharge pastes
Steaming/curring:
Required material
a) Steaming cooker
b) Thick paper
c) Thread
d) Resin cloth
e) Tri-steamer iron stand
f) Gas stove
Method
Pre-treatment of silk fabric-degumming: Degumming is the process of removing the sericin or silk gum from silk. Removing the gum improves the shine, color, hand and texture of silk.
Procedure: The material was weighed. The degumming bath wad prepared using material to liquor ratio 1:40. 1gpl of non-ionic wetting agent, 5gpl of soap and 1gpl of soda ash was added to the bath. The weighed fabric was wetted and introduced into the vat. The temperature was raised to 90 oc gradually; the fabric was worked for 1hours 30minutes.The bath was dropped and the fabric was rinsed and dried in a oven.
Dyeing: Principle: VS dyes are reactive dyes containing a sulphato-ethyl sulphone group in their molecules. In the presence of alkali, the dyes are converted into their reactive form that is vinyl sulphone, which reacts chemically with the hydroxyl group of cellulose to form an ether linkage.
Dyeing on cotton [Ready-To-Dye]:
Figure 7: Recipe: remazol black N150.
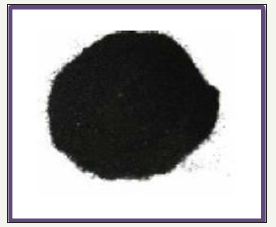
Table 2: Dyeing on cotton recipe.
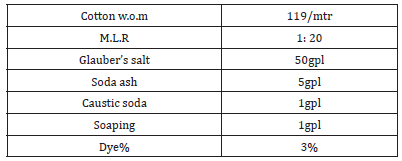
A. Preparation of dye solution
The dye stuff was made into a smooth paste with cold water and dissolved by adding hot water at a temperature of 80°.
B. Dyeing cycle
Bath was set to room temperature. pH was maintained just below 7, by adding acetic acid. Material was subjected to dye bath, left for 5minutes in the bath. Predissolved dye was added and continued dyeing for 10minutes. Temperature was raised and salt was added in two portions, the first portion was added after 5mintues rise of temperature and second portions was added after 10minutes dyeing continued. Gradually temperature was raised to 60°, dyed for 10minutes at 60°. Sodium carbonate and caustic soda was added in two portions in 10minutes, dyeing continued for another 60 to 90minutes. Bath was dropped and material was taken out from the bath and rinsed well [10].
And then subjected to soaping with detergent for 15minutes at 70° and bath was dropped rinsed with warm water and finally rinsed well with cold water.
Dyeing on silk
(Figure 8; Table 3)
Figure 8: Recipe: remazol black N150.
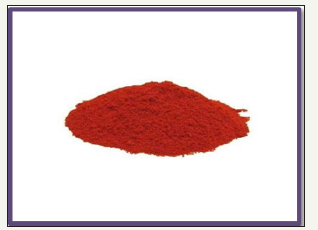
Table 3: Dyeing on cotton recipe.

A. Preparation of dye solution
The dye stuff was made into a smooth paste with cold water and dissolved by adding hot water at a temperature of 80°.
B. Dyeing cycle
Bath was set to room temperature. pH was maintained just below 7, by adding acetic acid. Material was subjected to dye bath, left for 5minutes in the bath. Predissolved dye was added and continued dyeing for 20-30minutes. Temperature was raised and salt was added in two portions, the first portion was added after 10mintues rise of temperature and second portions was added after 20minutes, continued dyeing. Gradually temperature was raised to 60 °c, dyed for another 20minutes at 60°-70 °c. Sodium bi carbonate was added in two portions in 40minutes. Dyed for 20minutes after final sodium bi carbonate was added. Bath was dropped and material was taken out from the bath and rinsed well.
And then subjected to soaping with detergent for 15minutes at 70 °c and bath was dropped rinsed with warm water and finally rinsed well with cold water.
Printing on the fabric
Procedure: Screen was placed on the sample and first ecological discharge paste was used , required quantity of the paste was taken on the screen and with the help of the squeezee, to and fro paste was squeezed on the screen to get print on the sample. After printing screen was slowly and carefully removed from the printed area of the sample. The sample was allowed to dry at room temperature and the screen and squeezee was washed immediately after printing and dried [11]. Respectively same method was applied to conventional discharge paste.
Steaming/curring
Procedure: After the sample was dried, it was rolled along with the thick paper and tied it with thread.
On the gas stove steaming cooker was placed, in the steaming cooker required amount of water was added and tri-steamer iron stand was placed inside the cooker. Sample was covered with resin cloth to avoid the water to enter inside the sample and it was placed on the tri-stand. Steaming was for 30mins.
After 30mins gas was switched off and then samples were removed out of steamer.
Samples removed from the steamer were untied and laid flat on the bed for 5mins and then samples were thoroughly rinsed in clean water for 1-2mins then the samples were allowed to dry and then ironed.
Printed samples
Plate 1:(Figure 9)
Figure 9:

Plate 2: (Figure 10)
Figure 10:

Test Methods
After the printing on samples, effluent of the samples were collected and tested for the following Experiments using standard test methods.
Determination of pH of effluent by pH meter
Method (4500-H+ B. electrometric method):
A. Principle: An ion-sensitive electrode is a sensor that connects the activity of a specific ion dissolved in a solution into an electrical potential that, makes possible the accurate reproducible and reliable measurements of the pH of a solution. To conduct the test following apparatus was required Test samples, pH meter, beaker, glass rod, measuring cylinder.
B. Procedure: The physical properties of samples such as pH, Colour, Odour and temperature were recorded. The collected samples were refrigerated at 4 °C in an tight glass containers. 100ml of test sample was taken in a beaker. The electrode was first rinsed in distilled water to calibrate and then the electrode was dipped into the test sample. The electrode was left in beaker for few minutes to get constant reading, then the value was recorded. The sample procedure followed for rest of the samples [12].
Determination of the total, permanent and temporary hardness of effluent samples
A. Principle: EDTA and its sodium salts form a chelate soluble complex when added to a solution of certain metal catious. A small amount of dye such as eriochrome black T is added to aqueous solution containing calcium and magnesium ions at a PH of 10+- 0.1, the solution becomes wine red in colour. If EDTA is then added as a titrant, the calcium and magnesium ions will be complexed, the solution will turn from wine red to blue.
To conduct the test following apparatus was required Burette, Pipette, Burette stand, Conical flask, Glass rod, Measuring cylinder, Beaker, spatula, Filter paper, Water samples, EDTA solution (Ethelene Diamine Tetra Acetic acid), Buffer solution, distilled water, Hot plate, Indicator.
B. Reagents:
a) Preparation of EDTA solution for 1000ml=3.72g of EDTA powder.
b) Preparation of buffer solution for 50ml (Ammonium chloride=3.38g,Ammonium solution=28.6ml, Distilled water= 18.02ml)
i. Procedure: The representative effluents samples were collected and refrigerated at 4 °C in a air tight glass containers. 25ml of effluent sample that has to be tested was taken in a conical flask .1 ml of buffer solution was added to give a pH of 10-10.1. a pinch of indicator [Eriochrome Black T] was added into the sample. Add the standard EDTA titrant slowly with continuous stirring until the last reddish tinge disappears from the solution. The color of the solution at the end point is blue under normal condition. Note down the volume of the EDTA added.
ii. Note: Complete titrant within 5min after buffer addition.
Hardness was calculated by the following formula
a) Total hardness: A*B*1000
Total volume of sample
For permanent hardness, the sample was boiled and was cooled to room temperature and was filtered using filter paper and then the test was conducted in a similar way for the total hardness.
b) Permanent Hardness: A*B*1000 Total volume of sample
c) Temporary hardness=Total Hardness-Permanent hardness Where, A-Total amount of EDTA solution used 1 burette reading
B-Magnesium and calcium in 1 ml of EDTA solution.
Determination of the salinity of effluent sample
Principle: Salinity is a measure of concentration of salts in the water. The salts present are typically dominated by four cations; calcium, magnesium, sodium, potassium and three anions; carbonate, sulphate and chloride [13]. There are two common ways of measuring salinity, one is by measuring electric conductivity and the other is through total dissolved solids. To conduct the test following apparatus was required beaker, Distilled water, Measuring jar, Test samples, TDS meter.
Procedure: The physical properties of samples such as PH, colour, odour and temperature were recorded. The collected samples were refrigerated at 4 °C in air tight glass containers. The electrode was neutralized by placing it in distilled water and the moisture content was removed completely. The electrode was taken placed in the beaker containing test sample. The level of sample aliquot was above the vent levels in the cell and no air bubbles were allowed inside the cell. The readings were tabulated.
Determination of the total dissolved solids present in the samples
Principle: Total dissolved solids are a measure of the total ions in the solution. TDS is calculated by converting the electrical conductivity by a factor of 0.5 to 1.0 times the electrical conductivity depending upon the levels. Typically higher the level of electrical conductivity, then higher the conversion factor to determine the total dissolved solids. In dilute solutions, TDS and EC are reasonably comparable. As the solution becomes more concentrated, the proximity of the solution ions to each other depresses their activity and consequently their ability to transmit current, although the physical amount of dissolved solids are not affected. To conduct the test following apparatus was required Beaker, Distilled water, Measuring jar, Test samples, TDS meter [14].
Procedure: The physical properties of samples such as PH, color, odour and temperature were recorded. The collected samples were refrigerated at 4°C in air tight glass containers. The concentrated effluent was diluted and 50ml of the diluted effluent was taken in a beaker. The electrode of TDS meter was neutralized by placing it in distilled water and the moisture was completely removed. Then the electrode was placed in the beaker containing test sample the level of sample aliquot was above the vent holes in the cell and no air bubbles were allowed inside the cell. The readings were tabulated.
Determination of the electrical conductivity of effluents
Principle: Conductivity is the ability of water to conduct our electrical current and the dissolved ions are the conductors TDS meters are in reality, conductivity meters. They work by applying voltage between two or more electrodes, positively charged ions will move towards the negatively charged electrode and negatively charged ions will move towards positively charged electrode. Since these ions are charged and moving, they constitute electric current the meter then monitor how much current is passing between the electrodes as a gauge of how many ions are in the solution. To conduct the test following apparatus was required Beaker, Distilled water, Measuring jar, Test samples, TDS meter.
Procedure: The physical properties of samples such as PH, colour, odour and temperature were recorded. The collected samples were refrigerated at 4°C in air tight glass containers. The conductivity cell 1 electrode was rinsed, thoroughly in distilled water, then the cell was placed in the beaker containing the sample. The level of sample aliquot was above the vent holes in the cell and no air bubbles were allowed inside the cell and readings were recorded for each sample. The cell was rinsed thoroughly in distilled water after each measurement [15].
Determination of the total solids present in the samples. [ is: 3025 (part 15) - reaffirmed 2003].
Principle: A well mixed sample is evaporated in the pre weighted dish and dried to constant weight in an oven at 103 °C-105 °C. The increase in weight over that of the empty dish represents the total solids.
To conduct the test following apparatus was required Evaporating dish, Desiccators, Drying oven, Weighing balance, Measuring jar, Glass rod, Test samples.
Procedure: The physical properties of samples such as PH, color, and odour and temperature were recorded. The collected samples were refrigerated at 4 °C in air tight glass containers. 25 ml of well mixed effluent sample was taken in a pre-weighed evaporating dish and dried in a drying oven the temperature was lowered approximately 2 °C below boiling point to prevent splattering. The evaporated sample was dried for atleast 1hour in the oven at 103 °C to 105 °C. Then the dish was placed in that dessicator to balance the temperature and then weighed. The same procedure was repeat ed for other samples [16].
The total solids were calculated by the given formula.
Total solids (mg/l) = (A-B)1000
Sample volume (ml)
Where
A -> weight of the dried residue + dish(mg)
B -> weight of the empty dish(mg)
Determination of the chemical oxygen demand of the effluent sample (5220 b. open reflux method).
Principle: The chemical oxygen demand is used as a measure of the oxygen equivalent of the organic matter content of a sample that is susceptible to oxidation by a strong chemical oxidant. Most type of organic matter are oxidized by the boiling mixture chromic and sulphuric acid solutions with a known excess of potassium-di-chromate. Over the range of the test a series of colors from yellow through green to blue are produced. The color is indicative of the chemical oxygen demand and is measured using a colorimeters. To conduct the test following apparatus was required digestor, coloriemeter, test samples, standard reagents, pipette, test tube, test tube rack, distilled water.
Procedure: The physical properties of samples such as pH, colour, odour and temperature were recorded. The collected samples were refrigerated at 4 °C in air tight containers. Reagent tube was shook well to suspend all sediment the cap of reagent was carefully removed and 2ml of effluent was added then, the cap was tightened carefully and shook gently to mix it well. A reagent blank was prepared by adding 2ml of distilled water in the same manner [17]. The test sample a reagent blank was placed in the digester at 150 °C for 120min for digestion. Then, samples were transferred to t est tube rack and allowed to cool to room temperature. Finally cod was measured using colorimeter and readings were tabulated. The printed fabric was tested for the tensile strength and abrasion of the fabrics by following standard test methods.
Determination of the breaking strength and elongation of the given fabric by grab test [ASTM D5034-09 Standard test method for breaking strength and elongation of textile fabrics (Grab test)]
Principle: A 100mm wide specimen is mounted centrally in clamps of a tensile testing machine and the force applied until the specimen breaks. Valves for the breaking force and the elongation of the test specimen are obtained from the machine scales or dial or a computer interfaced with the testing machines.
Terminology:
1. Breaking Force: It is the maximum force applied to a material carried to rupture.
2. Constant-Rate-Of-Transverse [CRT] Tensile Testing Machine: It is testing machine in which the pulling clamp moves at a uniform rate and the load is applied to the clamp which moves appreciably to actuate a weighing mechanism, so that the rate of increase of load or elongation is dependent upon the extension characteristic of the specimen.
3. Elongation: The ratio of the extension of a material to the length of the material prior to stretching expressed as a percentage.
4. Extension: The change in length of a material due to stretching is extension.
5. Grab Test: A tensile test in which the central part of the width of the specimen is gripped in the clamps.
6. Tensile test: A test in which a textile material is stretched in one direction to determine the load-elongation characteristics the breaking load or the breaking elongation.
To conduct the test following apparatus was required Tensile testing machine CRT type, Fabric, Template
Sampling: Test specimens, f rom each sample, take five specimens from the warp direction and five from filling directions for each testing condition.Preparation of specimens cut specimens with their long dimensions parallel either to the warp (machine) direction or to the filling (cross) direction, or cut specimens for testing both directions, if required [18]. preferably specimens for a given fabric direction should be spaced along a diagonal of the fabric to allow for representation of di fferent warp and filling yarns, or for representation of different wrap and filling yarns, in each specimen.
When possible filling specimen should contain yarn from widely separated filling areas. Unless otherwise specified, take specimens no nearer to the selvedge, or edge of the fabric, than one tenth of the width of the fabric.
Grab test: Cut each specimen 100mm+- 1mm(4+-0.05”) wide by at least 150mm (6”) long with the dimension parallel to the direction of testing and force application.
Procedure: The specimen was mounted in the clamp jaws with the previously drawn parallel line, adjacent to the size of the upper and lower front or tops, jaws which were nearest to the edge and with approximately the same length of the fabric extended beyond the jaws at each end. the parallel line served as a guide to ensure that the same lengthwise yarns of woven fabric were gripped on the both clamps and that the fore applications was not at an appreciable angle to the test direction of non-woven fabrics.
The tension on the specimen were uniform across the clamp width. For high strength fabrics where the specimen cannot be satisfactorily held in clamps, placed each specimen around pins and between jaws using jaw padded, if necessary [19].
Tightened the clamps to distribute the holding pressure along the clamped surface of the top (front) jaw clamps with were too tight produced breaks at the front of the jaws; clamps which were too loose caused slippage or breaked at the back of the jaws.
Elongation depends on the initial specimen length which were affected by any pretension applied on mounting the specimen on the testing machine. If measurement of specimen elongation were required, mounted, and applied a uniform pretension, not to be exceed 0.5% of the full scale load, to the bottom end of the specimen before gripped the specimen in the lower clamp.Marked across the specimen at the front inner edge of each jaw to check for specimen slippage. When slippage occurred, the marks were moved away from the jaw edge.operated the machine and breaked the specimen. Read the breaking force and elongation, recorded warp and filling (machine and cross) direction results separately.
If a specimen slipped in the jaws, or breaks at the edge of or in the jaw, or if for any reason the result falls markedly below the average for the set of specimens, discarded the result and took another specimen, continued this until the required number of acceptable breaks has been obtained.
Formula: For Calculating elongation=Initial length-Final length
Figure :

Figure :

Determination of the resistance to abrasion and change of appearance of apparel fabrics using Martindale tester [ASTM D4966-12e1 standard test method for abrasion resistance of textile fabrics (Martindale abrasion tester method)]
Principle: Circular specimen of a fabric are abraded under a know pressure, against a standard abradant fabrics subjected to rubbing motion in the form of a geometric figure, that is a straight line, which becomes a gradually widening ellipse, until it forms another straight line in opposite direction to trace the same figure again.
Terminology:
1. Abrasion Resistance: Abrasion resistance is expressed as the number of rubs required to cause breaked down in the test specimen or to lead to an unaccep table visual change.
2. Abrasion: the wearing away of any part of a material by rubbing against another surface.
3. Abrasion Cycle: Total number of movement required to complete a geometric shape in a Martindale abrasion tester.
4. Cycle: 16 movements required for the completion of 1 lissajous figure on a Martindale Tester.
5. Movements: One rotation of the two outer gearing of the Martindale Tester.
6. Lissajous: Geometric figure that starts as a straight line, then becomes a widening ellipse and narrows to again become a straight line. There are 16 movements in one lissajous. To conduct the test following apparatus was requiredStandard abradant fabrics: a plain weave crossbred worsted wool fabric. Standard wool felt of mass 750+- 50gm 2 and 3+- 0.3mm thick.
Polyurethane foam backing: 3.6+- 0.01 mm thick. Fabric punches or press cutters 38mm and 140mm in diameter
Ampling: Samples shall be drawn so as to be the representative of the lot using the fabric punch or press cutter take 4 circular specimens of 38mm diameter.
Atmospheric conditions for conditioning and testing: Prior to test, the fabric shall be conditioned to moisture equilibrium in standard atmospheric conditions of RH 65% to +-2% and temperature 27+- 2 °C.
Procedure: Make all tests in the standard atmosphere for testing each testing table place a piece of felt approximately 5.5 inch (140mm) followed by a piece of a standard fabric of the same size. Place the mounting weight (supplied with the machine) on the table to flattened the fabric/felt pieces secure the fabrics/felt to the table with the mounting weight in place, then remove the weight and inspect for tucks and ridges. If loss of weight is to be used to interpreted the results, weigh a specimen to the nearest milligram [20]. Assemble the holder by placing the specimen faced out into the specimen holder for fabric having a mass/ unit area less than 147 yard sq(500gm/m2) place a 11.4” (28mm) polyurethane foam between the specimen of 1.31+ 0.03 PSI (9+- 0.2 KPA) for apparel fabric.
Figure :

Where A= Before weight
B=After weight
Determination of the degree of whiteness of the discharge printed fabrics [ASTM method E313- 96“standard practice for calculating yellowness and whiteness indices from instrumentally measured color coordinates”]
Whiteness is associated with a region or volume in color space in which objects are recognized as white. And degree of whiteness is measured by the degree of departure of the object from a perfect white
Typical Application: Products that can be consider white such as paint, paper, textiles, plastics.
To conduct the test following instrument was required : Color Trend HT (ASTM E313 Tint only)
Illuminant /Observer Combinations (as available in Hunterlab software and firmware):
a) ASTM E313 Tint: D65/10°, D65/2°, C/l0°, C/2°, D50/ l0°,D50/2°.
b) CIE Tint: D65/10°, D65/2°, C/2°.
c) Ganz Tint: D65/10°.
Procedure: By definition, the theoretical “perfect white” has reflectance values of 100% across the visible spectrum with corresponding colorimetric values of L*=100.00, a*=0.00, and b*=0.00. If a white item is near, but not perfectly, white, it may be darker (have a lower L* value), and possibly be slightly chromatic, either in the red-green dimension (a*) or in the yellowblue dimension (b*).
The whiteness indices (described in the applications note entitled “whiteness Index”) are biased in the blue-yellow dimension, such that higher whiteness index values are obtained if the white material is lighter or slightly bluer than the prefect white, and lower whiteness index values are obtained if the white material is darker or slightly yellower than the perfect white. As a supplement, tint indices are biased in the red-green dimension and describe the amount of greenish or reddish tint in products that are close to perfect white. Negative tint values indicates a reddish cast (slightly positive a*), while positive tint values indicate a greenish cast (slightly negative a*). The tint indices are highly sensitive to colour change, and make it easy to quantify very small lot -to-lot differences between
white materials.There are three types of tint available using Hunter Lab instruments: CIE Tint, ASTM E313 Whiteness, and Ganz Whiteness indices, respectively.
Formula:
The three tint indices are defined below.
CIE Tint and ASTM E313 Tint are calculated using the same equation, given below, but are available for different illuminate/ observer combinations, as described above. Refer to CIE Publication 15:2004, Colorimetry, for more information on CIE Tint. Refer to ASTM E313, “Standard Practice for Calculating Yellowness and Whiteness Indices from Instrumentally Measure Color Coordinates, “for more information on ASTM E313 Tint. Tint E313=Tx (Xn-X)- 650(Yn-Y)= Tint CIE Where x and y are the chromaticity coordinates of the specimen and Xn and Yn are the chromaticity coordinates for the CIE standard illuminate used [21]. These values are provided in the table below based on the illuminant and observer used. The Tx coefficient is also given in the table. The tint value is not calculated for any other illuminant/observer combinations (Table 4).
Table 4: Dyeing on cotton recipe.

Tint GANG = mx + ny + k
Where
Figure :

Figure :

Figure :

x and y are the CIE chromaticity coordinates. Note: Only the color quest XE, Lab scan XE, Ultra scan XE, Ultra scan PRO and Ultra scan VIS instruments with the UV control option installed may correctly calculate Ganz Tint.
Results
(Table 5-14)
Table 5: Dyeing on cotton recipe.

Table 6: Dyeing on cotton recipe.

Table 7: Dyeing on cotton recipe.

Table 8: Dyeing on cotton recipe.

Table 9: Dyeing on cotton recipe.

Table 10: Dyeing on cotton recipe.

Table 11: Dyeing on cotton recipe.

Table 12: Dyeing on cotton recipe.
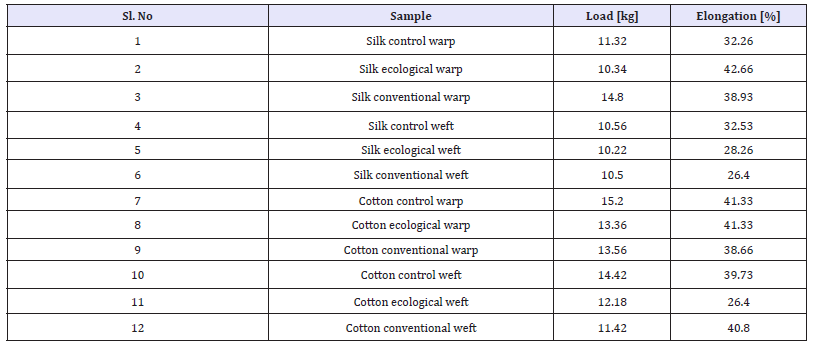
Table 13: Dyeing on cotton recipe.
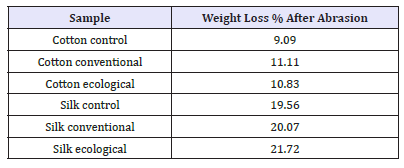
Table 14: Dyeing on cotton recipe.
Discussion
Hardness of effluent
pH meter method: pH is the negative logarithm of the hydrogen (H’) ion concentration, more precisely hydrogen ion act ivity. pH of ecological effluent was neutral. Whereas pH of conventional effluent was slight alkaline. Though ph value is within permissible level conventional effluent shown higher value than the ecological effluent.
Hardness is traditionally measured by chemical titration. The hardness of a water sample is reported in milligrams per liter (same as parts per mill ion, ppm) as calcium carbonate (mg/l CaCO3). The total hardness for ecological effluent was 26ppm where as conventional effluent was 145.3ppm. The permanent hardness for ecological effluent was 17.03ppm and where as conventional effluent result was 116ppm. The temporary hardness of effluent results was 8.7ppm for ecological and for conventional it was 29.3ppm. And due to the presence of alkaline and sulphonates in effluent it can be conclude that conventional reading is much higher than ecological readings.
Salinity of effluent
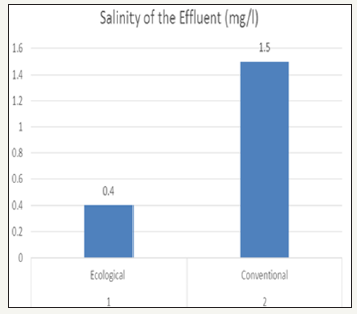
Salinity is a measure of concentration of salts in water. The salinity value for ecological effluent was 0.4mg/l and whereas salinity value for conventional effluent was 1.5mg/l. It could be concluded, due to dissolve salts present more in conventional effluent it as higher value than ecological effluent
Total dissolved solids is a measure of the total ions, in solution. Dissolved solids refers to any minerals, salts, metals, cat ions or anions which are dissolved in water. The TDS values of the samples was 501mg/l for ecological effluent and 998mg/l for conventional effluent, which was the higher value than ecological effluent.
Electrical conductivity of effluent
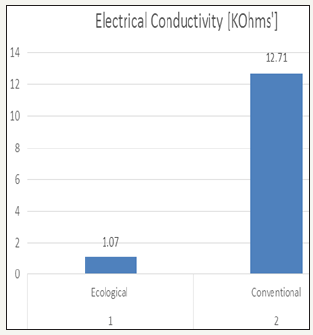
Electrical conductivity is the measure of the ability of an aqueous solution to convey an electric current. This ability depends upon the presence of ions, their total concentration, mobility, valence and temperature. The highest value was found in conventional effluent it was 12.71k-ohms and Ecological effluent had least value 1.07k-ohms.
Total solids of effluent
Total solids is the material residue left in a vessel after evaporation of a sample and its subsequent drying in an oven at a defined temperature. Total dissolved solids (TDS) is defined as all inorganic and organic substances contained in water that can pass through a 2 micron filter. In general, TDS is the sum of the cations and anions in water. The result showed in ecological effluent as the least value that is 4mg/l where as conventional effluent showed higher result as 10mg/l
Cod of effluent
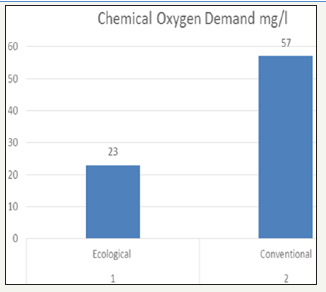
The Chemical Oxygen Demand (COD) test measures the oxygen required to oxidize organic matter in water and wastewater samples by the action of strong oxidizing agents under acid conditions. The lowest value was found in ecological effluent and highest value was found in conventional effluent that is 23mg/l and 57mg/l respectively. In conventional effluent due to chemicals like sulphoxylate, carboxymethylate, zinc is present oxygen demand is more.
Breaking strength and elongation of the samples
Figure 11:
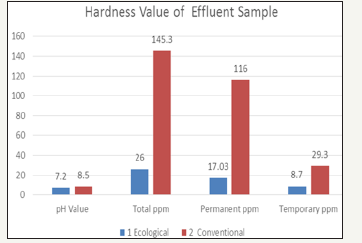
Figure 12:
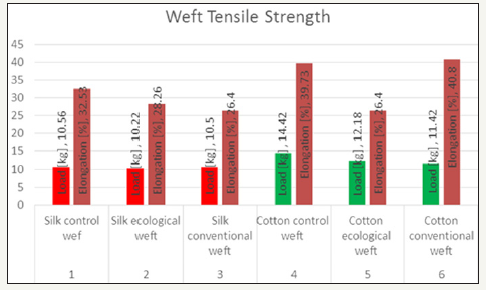
A measure of the ability of a material to withstand a longitudinal stress, expressed as the greatest stress that the material can stand without breaking. Elongation is defined as the distance (in percent) the membrane will stretch from its original size to the point at which it breaks. In the above graphs comparison of control sample and ecological and conventional samples are shown. where as in Figure 11 withstanding stress of the load as decreased in case of ecological and withstanding stress of load is increased in conventional wrap direction and elongation is increased than the control sample in both the samples 10% and 6% respectively. where as in Figure 12 withstanding stress load in both the sample compared to control sample was similar but in ecological minute various as seen and elongation of both the samples than the control sample as decreased 5% and 7% respectively.
A measure of the ability of a material to withstand a longitudinal stress, expressed as the greatest stress that the material can stand without breaking. Elongation is defined as the distance (in percent) the membrane will stretch from its original size to the point at which it breaks. In the above graphs comparison of control sample and ecological and conventional samples are shown. Where as in Figure 13 withstanding stress of the load as decreased in both the case than control sample by 2kg and elongation was same in ecological warp direction and conventional sample as decreased by 4kg than control sample. Where as in Figure 14 withstanding stress load in both the sample compared to control sa mple was decreased by 2kg and 3kg respectively and elongation of ecological sample was decreased 13% and conventional sample by 1% increase than the control sample.
Figure 13:
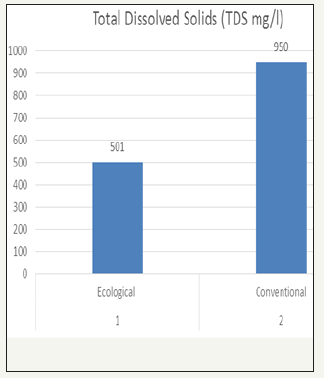
Figure 14:
Resistance to abrasion and change appearance in samples
Figure 15:
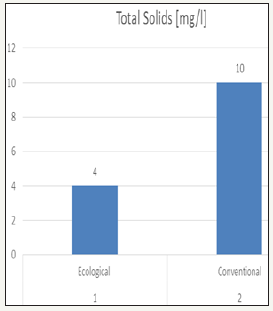
Figure 16:
Abrasion resistance is the ability of a fabric to resist surface wear caused by flat rubbing contact with another material. In the Figure 15 shows ecological sample as 1.43% weight loss than control sample and conventional as 2.02% loss comparatively ecological sample weight loss is lesser than conventional sample. In the Figure 16 shows ecological sample as 1.94% weight loss than control sampl e and conventional as 1.02% loss. comparatively conventional sample weight loss is lesser than ecological sample.
Whiteness index of the samples
Figure 17:

Figure 18:
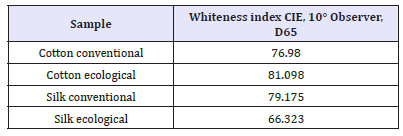
Whiteness is the degree to which a surface is white. In the Figure 17 degree of whiteness in cotton ecological sample was higher than the conventional cotton sample. Where as in the Figure 18 degree of whiteness in the conventional silk sample was higher than silk ecological sample
Summary & Conclusion
Discharge print ing is a method where the pattern is produced by the chemical destructi on of the original dye in the printed areas. The discharging agents used canbe oxidizing or reducing agents, acids, alkalis and vari ous salts. But, most important methods of discharging are based sulphoxylates formal dehyde & Thi ourea dioxide.
Recently, the environmental and industrial safety condi ti ons increased the potential if or use of enzymes in text ile processing to ensure eco-f ri endly producti on. InDischarge print ing, Sulphoxylate Formaldehyde (NaHS02.CH2o.2H20) is one of the powerful discharging agent used commercially, however, i t is considerably t oxic and evolves formal dehyde known as a human carcinogeni c associated wi th nasal sinuscancer and nasopharyngeal cancer. And also gradually effects the human health employed in discharge printing.
Ecological discharge paste was ready to use where as conventional paste needs preparation before printing. In both the cases printing was easier but ecological paste needs less efforts while printing compared to conventional paste. To get accurate design and proper discharge of ground fabric in ecological discharge paste right quantity, temperature, duration and method to follow or else yellowing of the fabric in silk was found and right whiteness effect can’t be achieved. In the various effluent tests of the ecological effluent sample and conve ntional effluent sample, ecological effluent shows good results compared to conventional. Though conventional was within the permissible limits it was almost to tolerance level and had much higher value than ecological sample. And in chemical oxygen demand, hardness of effluent and Total Dissolved Solids it had very higher value which requires mild treatment before passing effluent to drainage.
In the tensile strength test and abrasion resistance test, there was slight various in the ecological and convent ional samples compared to control sample this would be due t o the application of discharge of dye on the fabric, there would be changes in bonding of fibers and fabric structure. This Dissertation study aims at using eco-friendly discharge paste to replace the hazardous chemicals which are currently, commercially used in discharge printing. A comparative study on ecological discharge paste and conventional discharge paste is discussed and evaluated. And its observed that ecological discharge paste is better than conventional paste and it can be replaced instead of conventional paste containing hazardous Sulphoxylate Formaldehyde.
References
- Karthikeyan K, Bharathi D (2011) Bio-discharge printing on cotton fabrics using peroxidase enzyme. The Indian Textile Journal.
- Haggag K, Ragheb AA, EL-Thalouth IA, Nassar SH, EL- Sayed H (2013) A review article on enzymes and their role in resist and discharge printing styles. Life science journal 10(1): 1646-1654.
- El-Thalouth IA, Kantouch F, Nassar SH, El-Hennawi HM, Youssef MA (2008) Eco-friendly discharge printing on cotton fabrics using laccase enzyme. Indian Journal of Fibre & Textile Research 33: 52-57.
- Sudha S, Shibily P, Shyn J, Kripa SK, Balachandar V (2010) Genotoxic effects of textile printing dye exposed workers in India detected by micronucleus assay. Asian Pac J Cancer Prev 11(4): 919-922.
- Rathore J (2012) Studies on pollution load induced by dyeing and printing units in River Bandi at Pali, Rajasthan, India. International Journal of Environmental Sciences 3(1):735-742.
- Koushik CV, Antao IJ Chemical processing of textiles preparatory processes and dyeing. Pp. 140-144 & 147-149.
- Bernard PC Textiles fiber to textile, (6th edn).
- Leslie WC Miles (2003) Textile printing revised, (2nd edn), pp. 196-206.
- Nigel CV (2004) Horseradish peroxi dase: A modern view of a classic enzyme.
- Rathore J (2011) Assessment of water quality of river bandi affected by textile dyeing and printing effluents, Pali, Western Rajasthan, India. International Journal of Environmental Sciences 2(2): 560-568.
- Shamsul alam, Arifuzzamankhan GM (2008) Dyeing of cotton fabrics with reactive dyes and their physico-chemical properties. Indian Journal of Fiber & Textile Research 33: 58-65.
- Bellini P, Bonetti F, Franzetti E, Rosace G, Vago S (2002) Reference books of textile technologies: Finishing, Italian associat ion of text ile machinery producers (ACIMIT), Milan, (3rd edn), p. 72.
- Glover B (2005) Reactive dyes for textile printing. Colourage 52: 67-81.
- Willmott N, Guthrie J, Nel son G (1998) The biotechnology approach to colour removal from textile effluent. JSDC 114(2): 38-41.
- BIS: Indian standards for effluents discharge into inland surface waters (IS-2490:1982).
- http://www.cbcexim.com/
- http://easysqueegee.wordpress.com/reactive-dyes/
- https://www1.dystar.com/products/auxiliaries_aprinting. cfm?CFID=1436922&CFTOKEN=86818447
- http://www.lovibondcolour.com/colour-scale/whiteness-indexastm- e-313
- http://forum4.aimoo.com/worldtextile/Printing-Practical-Labs/ Discharge-printingon-Cotton-Fabric-1131041.html
- http://creativearts.stca.herts.ac.uk/helpsheets/discharge
© 2018 Seema HS. This is an open access article distributed under the terms of the Creative Commons Attribution License , which permits unrestricted use, distribution, and build upon your work non-commercially.
 a Creative Commons Attribution 4.0 International License. Based on a work at www.crimsonpublishers.com.
Best viewed in


.jpg)


 Editorial Board Registrations
 Submit your Article
 Refer a Friend
 Advertise With Us
.jpg)


.jpg)


.bmp)
.jpg)
.png)
.jpg)


.jpg)


.png)

.png)


.png)


