
- About Us
- Information
-

The Author ensures that the research has been conducted responsibly and ethically with adherence to all relevant regulations. read more..
- For Authors
- For Reviewer
- Manuscript Guidelines
- Membership
- Publication Ethics
-
- Journals
- Reprints
- e-Books
- Videos
- Policies
- Contact Us
 COVID-19
- Submissions


Full Text
Strategies in Accounting and Management
Forecasting the VN30 Index: Insights into Vietnam’s Stock Market Trends
Hung Long Nguyen and Tetiana Paientko*
HTW Berlin Business School, HTW Berlin-University of Applied Sciences, 10318 Berlin, Germany
*Corresponding author:Tetiana Paientko, HTW Berlin Business School, HTW Berlin-University of Applied Sciences, 10318 Berlin, Germany
Submission:May 03, 2024;Published: May 27, 2024

ISSN:2770-6648Volume4 Issue5
Abstract
This research paper examines the potential of forecasting the VN30 index, a prominent benchmark in the Vietnamese stock market, using the Auto Regressive Integrated Moving Average (ARIMA) model. Given the rapid evolution of the Vietnamese stock market since its inception in 2000, it presents unique challenges and opportunities for investors and policymakers. The increasing trading activity and the market’s relatively low efficiency make accurate forecasting essential for informed decision-making. The purpose of this study is to determine if the ARIMA model can effectively predict the future values of the VN30 index, providing insights into market trends and assisting stakeholders in navigating the complexities of the Vietnamese stock market. The methodology employed involves a comprehensive approach based on the theory of change and the steps outlined by Hyndman [1], including data visualization, variance stabilization, model selection, and residual analysis. Data used for this study consist of monthly and daily observations of the VN30 index over various periods, allowing for a robust analysis of market behavior. Findings indicate that the ARIMA model can be a valuable tool for forecasting in emerging markets like Vietnam, although challenges related to information transparency and corporate disclosure persist. The results suggest that the VN30 index’s future values generally align with ARIMA’s prediction interval, offering a degree of confidence for investors and market analysts. However, the study also highlights the need for ongoing improvements in market efficiency and transparency to enhance forecasting accuracy. This paper contributes to the existing literature by demonstrating the applicability of ARIMA in a developing market context and providing practical guidance for investors and policymakers.
Keywords:Forecast; ARIMA; Stock market; Vietnam; VN30 index
Introduction
The Vietnamese stock market, which began operations in July 2000, has rapidly evolved but is still considered young and not entirely efficient [2-4]. Despite these challenges, there is a significant potential for growth, as highlighted by Bui [5], and the increasing number of trading accounts from 2.3 million at the end of 2019 to 7 million by April 30, 2023 (Vietnam Securities Depository [6]), signals a robust interest in this market. Given the dynamism of the Vietnamese stock market, this research focuses on the VN30 index (VN30), which represents the 30 largest and most liquid stocks in the country. Forecasting this index is crucial for investors, policymakers, and economists to anticipate market trends and make informed decisions. However, as noted by Pham TN [3] and Phan [4], the Vietnamese stock market may not even achieve the weak form of market efficiency due to low information transparency and issues with corporate disclosure. These conditions underscore the importance of sophisticated forecasting techniques for this market. This study aims to address these challenges by applying the ARIMA (Auto Regressive Integrated Moving Average) model, introduced by Box [7], to forecast the VN30 index. Although ARIMA has proven effective in time-series analysis, its application to the Vietnamese stock market remains relatively unexplored. Thus, the research objective is to determine whether the future values of the VN30 index align with ARIMA’s prediction interval. By examining this, the study not only contributes to the understanding of the Vietnamese stock market’s dynamics but also offers practical insights for investors and market analysts seeking to navigate the uncertainties in this emerging market. The methodology follows the comprehensive approach outlined by Hyndman [1], employing a series of steps to identify patterns, stabilize variances, and find the best ARIMA model for forecasting. This research uses three datasets: monthly data from February 2012 to December 2022, and two sets of daily data from January 4th, 2022, to July 7th, 2023, and from June 18th, 2018 to July 7th, 2023. Each dataset provides unique insights into the trends and volatility of the VN30 index.
Through a detailed analysis, this paper aims to contribute to the growing body of knowledge on stock market forecasting in emerging economies. The results are expected to provide actionable guidance for local investors and broaden the understanding of the factors that drive the Vietnamese stock market. Ultimately, this study seeks to enhance the overall comprehension of how sophisticated analytical techniques like ARIMA can be applied to forecast key indices, aiding stakeholders in making better-informed decisions in a developing market environment. The article is divided into four sections. Based on theory and empirical findings, the Section 1 critically evaluates the existing literature on forecasting stock indexes and defines the research gap. The following section elucidates the methodology to be employed in the conduct of this research. It describes the research’s philosophical thought, strategy, data collection details, and data scrutiny methods needed to answer formulated research questions. The following section contains outputs from data analysis and discussions of findings based on outputs. It also entails the comparison of findings with those of previous related works. The last section highlights the summary of findings, conclusions drawn from the research work, recommendations, and suggestions for future research based on current study limitations.
Literature Review
Theoretical background for stock-market trends prediction
Forecasting trends in financial markets is one of the most discussed topics among researchers and practitioners. Investors and traders rely on predictions of stock prices to make crucial decisions about buying or selling financial instruments. Forecasting is pivotal because it helps them determine the optimal times to execute trades [8,9]. Cowles [10] raised questions about whether stock markets could be accurately forecasted, finding that even credible financial journals and service providers in the U.S. struggled to do so. Fama [11] proposed the theory of efficient markets, suggesting that if the market is efficient, it fully reflects all available information, making prediction impossible. He outlined three forms of market efficiency: in a weak form, predicting based solely on historical prices is challenging; in a semi-strong form, predicting based on publicly available information is also difficult; and in a strong form, even insiders can’t predict the market due to perfect information transparency. The problem with emerging markets is that they cannot be treated as efficient, therefore forecasting models must be used carefully.
According to Kumbure et al. [12], there are generally two main analytical approaches for stock market prediction: fundamental analysis and technical analysis. Lohrmann [13] believe that these approaches can lead to successful investment strategies. Fundamental analysis involves examining underlying financial and qualitative factors, such as revenue, expenses, liabilities, expected cash flow, and management quality. When focusing on broader indices, macroeconomic policies, interest rates, GDP growth, and trade volumes are considered. In contrast, technical analysis uses historical stock prices and trading volumes to predict market trends, operating under the assumption that past patterns might repeat (Kumbure et al. [12]; Lam [14]; Lohrmann [13]. Each approach has its strengths: fundamental analysis is more useful for long-term forecasting, while technical analysis can be more accurate for short-term stock price changes [15]. Nti et al. [16] found that some researchers use a combination of both technical and fundamental analysis. In a study reviewing 122 academic papers from 2007 to 2018 on stock market forecasting and machine learning applications, they found that 66% of these papers utilized technical methods, 23% focused on fundamental analysis, and 11% employed a combined approach. Dunne [17] identified three categories for stock prediction: fundamental analysis, technical analysis, and machine learning. Machine learning can uncover relationships within data to create models, offering a unique advantage over traditional analysis methods.
Bui [18] used the rolling window method to forecast the Stock Price Movement Direction (SPMD) of 30 stocks in the VN30 basket, comparing Support Vector Machines (SVM), logistic regression, and Artificial Neural Networks (ANN). Pham et al. [19] explored the chances that some stock components in the VN30 basket could outperform the index by simultaneously applying Long Short-Term Memory (LSTM) and Ichimoku Cloud trading strategy, selecting three stocks with the best profit potential to sell 10 days later. Do [15] used a variable dimension reduction method based on kernel tricks to forecast daily prices of the VN30 index. Hyndman and Athanasopoulos 2023 advocate for technical approaches, specifically using time-series models, to forecast market trends. They argue that these models often provide more accurate results because they estimate future values based on past patterns. The authors offer several reasons to support this approach: measuring relationships between predictor variables and the forecasted variable is complex, time-series models generally yield more accurate results, and forecasting other predictor variables is challenging. Additionally, they point out that the primary objective of forecasting is to generate accurate predictions rather than explain underlying causes, which aligns with the approach used in this research by focusing on the ARIMA model. With advancements in computer science, newer articles suggest a higher possibility of predicting market trends, with machine learning and hybrid models leading the way. Nti et al. [16] and Kumbure et al. [12] highlighted the use of machine learning and hybrid approaches in stock market forecasting. Huang et al. [20] combined Support Vector Machine (SVM) with other classifiers to predict weekly movement direction with improved accuracy. Lv et al. [21] developed a hybrid model called CAL, combining several techniques to forecast influential indices, demonstrating superior performance compared to other models. These studies suggest that while forecasting remains challenging, emerging technologies offer new opportunities for improved accuracy in predicting stock market trends, but those models shall be applied considering the deficiencies of emerging financial markets.
Vietnamese stock market and the VN30 index
In 1996, the State Securities Commission of Vietnam (SSC) was founded, and four years later, the first stock trading center was established, with the initial transaction occurring in July 2000 (Hayashi 2013; SSC, n.d.). The early years, from 2001 to 2005, saw minimal progress in the stock market, with capitalization equaling just 1% of the country’s GDP. However, significant growth began in 2008, with market capitalization rising from 12.4% to 72.6% of GDP by 2019 (Cao [22]), reaching an all-time high of 149.84% in 2021 Vung [23]. In terms of trading accounts, domestic investor numbers tripled from 2 million in 2018 to 7 million by May 2023 (Vietnam Securities Depository [6]). The most notable increase in trading accounts occurred in 2021 and 2022, likely influenced by the COVID-19 pandemic, which led to social distancing, a shift toward online trading, lower interest rates, investment diversification, and increased market volatility. Foreign investor participation also grew, albeit at a slower rate than domestic investors. According to the Vietnam Securities Depository [6], the number of foreign accounts rose steadily from 28,294 in 2018 to 42,711 in 2022, with the pace of growth slowing in 2022 due to the global economic recession. Nasir et al. [24] remarked that the Vietnamese stock market is among the fastest-growing markets, showing significant progress in recent years. They applied the Time-Varying Structural Vector Autoregressive (TVSVAR) framework to assess factors influencing the Vietnamese market, including the domestic economic environment and regional markets (such as Thai, Japanese, Hong Kong, and Chinese markets). Their study found that the domestic economy, supportive monetary policy, currency stability, and economic growth were strongly correlated with stock market development. However, inflation had a detrimental impact on the market’s performance. Additionally, the Vietnamese stock market showed strong co-movement with the Thai and Japanese markets, though this influence has lessened as the market matures.
Despite the Vietnamese stock market’s growth, inefficiency remains a concern. Le [25] analyzed and concluded in his doctoral thesis that the Vietnamese stock market had not yet achieved the weak form of efficiency. Nguyen [26] reached a similar conclusion through bivariate analysis, indicating that the market could not be deemed informationally efficient in both the short and long run. Phan [4] adopted a more cautious approach, suggesting that while their test results indicated inefficiency, it was still possible for the market to achieve efficiency. In more recent work, Pham TN [3] applied the Kolmogorov-Smirnov and unit root tests, confirming that the market did not achieve the weak form of efficiency. Interestingly, they also found that the S&P 500, a benchmark for the U.S. market, exhibited similar characteristics, indicating that even more mature markets can struggle with efficiency. Another challenge faced by the Vietnamese stock market is the behavior and financial literacy of its investors. Phan [4] pointed out that Vietnamese investors were prone to psychological influences, impacting their investment decisions. Although investor professionalism has improved since 2009, financial literacy remains relatively low compared to other markets in Asia, with Vietnamese investors scoring 4.4 out of 7 on the financial literacy scale, compared to higher scores in China and Korea Morgan [27]. This lack of advanced literacy and confidence in financial knowledge can contribute to market inefficiency.
The key index for Vietnamese stock market is VN30. Stock market indexes like the VN30 are crucial for gauging market trends and economic health. The VN30 index, which tracks 30 companies listed on the Ho Chi Minh Stock Exchange (HoSE), represents nearly 80% of the exchange’s market capitalization and 60% of its turnover Bloomberg 2023. Dao [28] detailed the selection criteria for the VN30, emphasizing market capitalization, liquidity, and free-float ratio. These criteria ensure that the index provides a reliable measure of the broader stock market’s performance, offering investors a benchmark to manage their portfolios and make comparisons. Overall, while the Vietnamese stock market has shown considerable growth, it still faces challenges related to efficiency, investor behavior, and financial literacy. The research referenced here provides insights into these issues and points toward factors that can contribute to a more stable and predictable market environment.
Review of previous research on the VN30 index
Nguyen SP et al. [29] suggested that each stock component in the VN30 index could have a significant impact on the index itself. They applied a Bayesian GARCH (1,1) model to predict the 30 stocks comprising the VN30. After obtaining individual forecasts, they combined them using a linear mixture model, calibrated with beta transformation. This methodology yielded a 61% accuracy in predicting the VN30 index’s daily price for the next 22 trading days. Do [15] utilized a variable dimension reduction method, employing kernel tricks, to forecast five daily prices of the VN30 index. Using 390 observation days (385 for training and five for testing) and 60 variables, they grouped these into domestic and external factors. Domestic factors included the close price of VN30 and the 30 component stocks, while external factors encompassed the gold price, oil price, and 27 international stock indexes like S&P 500, NIKKEI 225, Hang Seng, SENSEX, and KOSPI. The Pearson correlation coefficient was used to remove 22 redundant variables, resulting in 38 key predictors. The researchers then introduced KTPCA (Kernel Trick-based Principal Component Analysis) to reduce dimensionality. Using the five selected principal predictors, they forecasted VN30 prices from July 17th to July 21st, 2017, achieving high accuracy with error rates below 2.81% and an R-squared value of 0.993. However, the study had some limitations, such as the low accuracy of certain predictors, high standard deviation, and the omission of some essential tests that ensure a model is BLUE (Best, Linear, Unbiased Estimator). Bui [18] applied a rolling window method to forecast the Stock Price Movement Direction (SPMD) of the 30 stocks in the VN30 basket. They compared three models: Support Vector Machine (SVM), logistic regression, and Artificial Neural Network (ANN). Among these, SVM provided the highest accuracy, averaging 92.48%. Long Short-Term Memory (LSTM) has also been used in forecasting within the Vietnamese stock market. Pham NH et al. [19] applied LSTM and Ichimoku Cloud trading strategy to explore whether some stocks within the VN30 basket could outperform the index. They chose three stocks with the best profit potential, holding them for 10 days before selling, with the process repeated from 2015 to 2020. The study showed an average annual profit of 14.29%, higher than the VN30 index’s 12.01%. Despite these advancements, there is a notable lack of studies applying the ARIMA (Autoregressive Integrated Moving Average) model to the VN30 index. ARIMA is a fundamental model for forecasting, and it’s widely used for its simplicity and satisfactory accuracy in various fields, not just stock forecasting. Its combination of autoregressive, integrated, and moving average components makes it versatile for different datasets. However, the focus on more complex models, like LSTM and neural networks, has shifted attention away from simpler approaches like ARIMA.
ARIMA is a time-series forecasting model that combines autoregressive and moving average elements. An autoregressive model uses past values of a variable to forecast its future values. In contrast, a moving average model incorporates past forecast errors. ARIMA models blend these two approaches, requiring differencing to achieve stationarity. ARIMA has been used across various industries, not just stock forecasting. Contreras et al. [30] applied ARIMA to predict electricity prices, while Kumar et al. [31] used it to forecast daily ozone concentration. Merh et al. [32] employed ARIMA to predict Bombay Stock Exchange’s BSE 30 index. While ARIMA has demonstrated versatility and accuracy, it does have limitations. Al-Zeaud [33] utilized ARIMA for forecasting the volatility of the bank sector, with the best ARIMA model being ARIMA (2,0,2). Similarly, Datta [34] investigated the use of the ARIMA model for forecasting inflation in the Bangladesh economy, concluding that the ARIMA (1,0,1) model provided a satisfactory fit for the inflation data. Uko [35] conducted a comparative analysis of ARIMA, VAR (Vector Autoregressive), and ECM (Error Correction Models) to forecast inflation in Nigeria, with ARIMA emerging as a reliable predictor. Mondal et al. [36] applied ARIMA to forecast the next month’s data of 56 stocks from seven sectors of the National Stock Exchange (NSE) of India, achieving prediction accuracy of more than 85%. Ariyo et al. [37] demonstrated the effectiveness of ARIMA in short-term forecasting using data from NYSE and NSE. Khan [38] achieved 99% accuracy in predicting the price of Netflix stock using auto ARIMA and other ARIMA variations. However, ARIMA has shown limitations, as seen in Azad et al. 2011, where the ERNN model outperformed ARIMA in forecasting exchange rates in Bangladesh. Du 2018 found that ARIMA’s accuracy in forecasting the Shanghai securities composite index (SSE) was inferior to that of neural network models. Similarly, Nguyen TC et al. [39] concluded that while ARIMA is suitable for short-term predictions, LSTM-RNN outperforms it for longer-term forecasts. Given the limited research applying ARIMA to the VN30 index, this study seeks to fill the gap by exploring its effectiveness in forecasting this particular stock market index. The research hypothesis is: “The future values of the VN30 index fit into ARIMA’s prediction interval.” This hypothesis underpins the importance of exploring ARIMA’s utility in forecasting the VN30 index to contribute to the broader understanding of the model’s capabilities in emerging market contexts. Overall, while there are numerous studies on stock market forecasting and ARIMA’s use in various contexts, the VN30 index remains underexplored. This research aims to address that gap and shed light on ARIMA’s effectiveness in forecasting the performance of this specific index, thus contributing to the existing body of knowledge on stock market prediction methodologies.
Data Sample and Methodology
Data sample
In this paper, three datasets will be analyzed, which were extracted from the Bloomberg terminal (2023). The first dataset includes monthly data of the VN30 index from February 2012, when it started to have trading volumes, to June 2023. It was saved on the computer as “VN30_index_month.xlsx”. The name of the file is provided to make it easier for readers to trace the code later. The second dataset collects the daily data of VN30 from January 4th, 2022, which is the first trading day of that year, to July 7th, 2023. It was saved on the computer as “VN30_index_day.xlsx”. With the last dataset, an attempt was made to cover a longer period with daily data of VN30 from June 18th, 2018, to July 7th, 2023, with the file name “VN_index_day_longer.xlsx”. These time series are referred to as training sets. With the monthly series, the price of VN30 for the next 6 months will be predicted, and then compared with the real data from January to June 2023. With the daily series, the next 5 trading days will be forecasted and compared with the real data from July 10th to July 14th, 2023. These real data packages are called test sets, which were also collected at the Bloomberg terminal.
Methodology
The methodology used in this study is based on Chapter 8 of the book “Forecasting: Principles and Practice” (2nd edition) by Hyndman [1]. RStudio was used to carry out the subsequent steps for forecasting, as illustrated in Figure 1 below. It should be noted that the package “fpp2” must be installed in RStudio beforehand to execute these tasks. This package was developed by Professor Hyndman of Monash University, Australia, one of the authors of the referenced book. The package is available on The Comprehensive R Archive Network (CRAN) [40]. Transformation in Step 2 is a technique that stabilizes the variance of the dataset. It often makes the forecasting task simpler by making the pattern more consistent. Box-Cox transformation is one of them, it was first introduced by Box [41]. Instead of analyzing the graph of 𝑦𝑡, we analyze the graph of 𝑤𝑡. The value of 𝑤𝑡 depends on the parameter 𝜆 as follows:
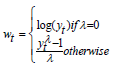
Figure 1:Forecasting process.

In practice, steps 2 and 3 can be accomplished with a single line of code using the auti. arima () function in R. By setting the lambda=” auto” argument, the function automatically determines the optimal value for lambda, which is used for Box-Cox transformations to stabilize variance. Step 3 encompasses several smaller tasks. The ARIMA model follows the format ARIMA(p,d,q) or ARIMA(p,d,q) (P,D,Q)m, so the software must identify the appropriate values for p, d, q, P, D, Q, m, and the constant c, if applicable. To determine the number of differences or seasonal differences required (d and D), the software conducts Kwiatkowski–Phillips–Schmidt–Shin (KPSS) tests. Differencing is a technique used to stabilize the mean of the data and ensure it is stationary. Typically, the values for d and D are no more than 2. Once differencing requirements are identified, the function examines various combinations of p and q to find the best-fitting ARIMA model for forecasting, based on the corrected Akaike’s Information Criterion (AICc), a measure used to evaluate the quality of statistical models.
Analysis and Results
The “VN30_index_month.xlsx” dataset
This data table contains monthly data of the VN30 index from February 2012, when it started to have trading volumes, to June 2023. The code lines that I used to perform the task are shown in Figure 2 below.
Figure 2:Code lines used.

The first two lines are about creating a time series object with start and end, the value 12 of frequency is specific to monthly data. The next pair is to plot the data. The next pair is the auto. arima () function and combines steps 2 and step 3. The next two lines are to check the residuals of the model. The rest are for calculating and plotting the forecast by forecast () and autoplot () functions.
Step 1: Plot the data: The autoplot () function in RStudio was used to plot the dataset, as described in Figure 3 below. There are two notable increases that can be observed in the chart. The first rise was from the middle of 2017 to the beginning of 2018, and the second one was from the middle of 2020 to the middle of 2021, which was right after a sharp fall at the beginning of 2020, ascribed to COVID-19. In general, the VN30 index follows the same patterns as the Vietnamese stock market. This is a young and small market, that is largely influenced by the U.S. market (Luu [42]; Nguyen C et al. [43]; Nguyen T [44]) or regional markets (Nasir et al. [24]; Nguyen MK [45]; Nguyen VC [46]). Figure 3 above is quite similar to charts of the S&P 500 index, STI (Singapore), Nikkei 225 (Japan), HIS (Hong Kong), and SET (Thailand) in the same period, so the international influence is the primary reason to explain.
Figure 3:Line chart of the dataset “VN30_index_month.xlsx”.

Steps 2 and 3: Transform the data and find the best ARIMA model: In this case, the auto. arima () function pointed out that Box-Cox transformation is needed with the lambda = (-0.8999), and ARIMA (0,1,0) (2,0,0) [12] is the model with the least AICc. It is a seasonal ARIMA model which involves one first difference and two past seasonal data points. The detailed results can be seen below (Figure 4). The first set of parameters (0,1,0) is for the non-seasonal part of the ARIMA model. The first number (0) indicates that there is no autoregressive part, in other words, the model does not use any past forecasted values to predict future values. The second number (1) represents that the series has been differenced once to remove any trend in the data and make it stationary. The final number (0) implies that there is no moving average part, which means the model does not use any past error terms to predict future values. The second set of parameters (2,0,0) [12] is for the seasonal part of the ARIMA model. The first number (2) indicates that there are two autoregressive terms included in the seasonal part of the model. This means that the model uses the last two years of data to predict the future value. The next “0” shows that no seasonal differencing was applied, and the final “0” means there is no seasonal moving average part. The number in the brackets, “[12]”, specifies the period of the seasonality, which in this case is 12 months, as expected for monthly data. This model indicates that there are some recurring patterns that can happen for the monthly prices of VN30 that are worth considering.
Figure 4:ARIMA model for “VN30_index_month.xlsx”.

Step 4: Check the residuals of the model: Regarding the residuals, the plots and Ljung-Box test indicate that the residuals are white noise. This step is handled by the check residual () function in RStudio, the plots and test results are shown below (Figure 5). The figure consists of four pictures. The first picture is the plot of the residuals. There is no pattern in the plot. The second picture is the Autocorrelation Function plot of the residuals. The residuals should be uncorrelated, which means most of the spikes should be within the threshold limits (the blue dashed line) of the ACF plot. If not, there may be some information in the dataset that the model has not yet captured. The third picture (the picture with the red curve) is the histogram with a normal curve, which describes the distribution of the residuals. It can be seen that the residuals are normally distributed, which fits the model’s assumption. The last picture is the result of the Ljung-Box test. The p-value of the Ljung-Box test larger than 0.05 suggests that the residuals are not correlated.
Figure 5:Residual check for “VN30_index_month.xlsx”.

Step 5: Calculate the forecast: As the residuals are white noise, we can proceed to the final step. Below is the graph of the time series with the forecast calculated (Figure 6). The dark shade and the light shade indicate the 80% and 95% confidence interval of the forecast, respectively. In other words, there is an 80% chance that the real monthly data of VN30 in the first half of 2023 lies in the dark shade, and there is a 95% chance for the lighter counterpart. The specific data can be seen in the Table 1 below: The interval is considerably wide, so it is understandable why the real data easily falls in the 80-percent confidence interval.
Figure 6:Forecast plot of “VN30_index_month.xlsx”.

Table 1:Forecasting results for “VN30_index_month.xlsx”.

The “VN30_index_day.xlsx” dataset
The same approach was used to the VN30_index_day.xlsx data set.
Step 1: Plot the data: Below is the plot of the data using auto. plot () function in RStudio (Figure 7). The daily data of VN30 from January 4th, 2022, the first trading day of 2022, which is day 1 in the chart to July 7th, 2023, which is day 375, were used. Stock exchanges in Vietnam work normally from Mondays to Fridays, so there is no data on Saturdays, Sundays, and public holidays. It can be seen that there was a downward trend throughout this period. This trend is understandable because it follows the global trend, which has its primary culprits are the COVID-19 pandemic and the Russia – Ukraine war.
Figure 7:Line chart of the dataset “VN30_index_day.xlsx”.

Steps 2 and 3: Transform the data and find the best ARIMA model: The function pointed out that the Box-Cox transformation is required with the lambda = 1.3096, and the best model here is ARIMA (0,1,0) with no constant. The detailed results are illustrated in Figure 8 below. The ARIMA (0,1,0) model is a special case of the ARIMA model, which indicates the following:
Figure 8:ARIMA model for “VN30_index_day.xlsx”.

A. The first number (0) represents the order of the autoregressive
component (AR), which refers to the number of lags of Y
to be used as predictors. A zero suggests that there is no
autoregression in the model, meaning that it does not utilize
past values of the time series to predict future values.
B. The second number (1) denotes the order of the first
differencing required to make the time series stationary. This
indicates that the time series was not stationary initially and
needed to be different once.
C. The third number (0) is the order of the moving average
component (MA). This implies that the error of the model does
not depend on the previous error terms.
ARIMA (0,1,0) with no constant above can be considered a random walk model (Hyndman [1]), where the changes from one period to the next are unpredictable fluctuations and might not follow a specific trend or seasonality. It follows the naïve forecasting method, in which the best estimate for the future value of a series is the current value. With the ARIMA (0,1,0), after differencing, the time series looks completely like white noise. As I want to investigate further, I tried to difference the data and then visualized the ACF and PACF plot, as well as running the portmanteau test (Ljung-Box test) for the differenced time series, as can be seen in Figure 9 below. The figure consists of four pictures. The first picture is the plot of the time series after differencing. There is no trend and seasonal pattern left and the values oscillate around the mean zero, which is the same behavior as white noise. The second picture is the Autocorrelation Function plot of the time series. The data points are uncorrelated, which means most of the spikes are within threshold limits (the blue dashed line) of the ACF plot. The third picture is the Partial Autocorrelation Function plot, the same comments with the ACF plot can be applied, which means the partial autocorrelations are insignificant to consider. The last picture is the result of the Ljung-Box test. The p-value of the Ljung-Box test larger than 0.05 suggests that the time series is not autocorrelated.
Figure 9:Further check for ARIMA (0,1,0).

Step 4: Check the residuals of the chosen model: Below is the results after checking the residuals from the ARIMA (0,1,0) model (Figure 10). The figure consists of three pictures. The first picture is the plot of the residuals. There is no trend and seasonal pattern left and the values oscillate around the mean zero, which is the same behavior as white noise. The second picture is the Autocorrelation Function plot of the residuals. The residuals should be uncorrelated, which means most of the spikes should be within the threshold limits (the blue dashed line) of the ACF plot. If not, there may be some information in the dataset that the model has not yet captured. The third picture (the picture with the red curve) is the histogram with a normal curve, which describes the distribution of the residuals. It can be seen that the residuals are normally distributed, which fits the model’s assumption. The results of the Ljung-Box test is shown on the Figure 11.
Figure 10:Residual check for “VN30_index_day.xlsx”.

Figure 11:Ljung-Box test for “VN30_index_day.xlsx”.

Step 5: Calculate the forecast: The data plot for the next five trading days will be as follows. Note that the forecast point remains the same and the dark blue line in the chart indicates that ARIMA (0,1,0) underpins naïve forecasts. In addition, the forecasting accuracy decreases (the interval becomes bigger) as the time frame of prediction increases. The dark shade and the light shade indicate the 80% and 95% confidence interval of the forecast respectively. The specific data can be seen in Table 2 below. The real data are quite close to the high end of the 80-percent confidence interval. The interval is moderately wide for changes in daily data, so it is understandable why the real data falls in the 80-percent confidence interval (Figure 12).
Table 2:Forecasting results for “VN30_index_day.xlsx”.

Figure 12:Ljung-Box test for “VN30_index_day.xlsx”.

The “VN30_index_day_longer.xlsx” dataset
The same approach was used to the “VN30_index_day_longer. xlx” dataset.
Step 1: Plot the data: Below is the plot of the data using auto. plot () function in RStudio (Figure 13). The daily data of the longer period, from June 18th, 2018 (day 1) to July 7th, 2023 (day 1266) were used, which is the longest period that can be exported from Bloomberg.
Figure 13:Line chart of the dataset “VN30_index_day_longer.xlsx”.

Steps 2 and 3: Transform the data and find the best ARIMA model: The function pointed out that the Box-Cox transformation is required with the lambda = 0.3946, and the best model here is still the ARIMA (0,1,0) with no constant. The detailed results are illustrated in Figure 14 below.
Figure 14:ARIMA model for “VN30_index_day_longer.xlsx”.

Step 4: Check the residuals of the chosen model: Below are the results after checking the residuals from the ARIMA (0,1,0) model (Figure 15). The figure consists of four pictures. The first picture is the plot of the residuals. There is no trend and seasonal pattern left and the values oscillate around the mean zero, which is the same behavior as white noise. The second picture is the Autocorrelation Function plot of the residuals. The residuals should be uncorrelated, which means most of the spikes should be within the threshold limits (the blue dashed line) of the ACF plot. If not, there may be some information in the dataset that the model has not yet captured. The third picture (the picture with the red curve) is the histogram with a normal curve, which describes the distribution of the residuals. It can be seen that the residuals are normally distributed, which fits the model’s assumption. The last picture is the result of the Ljung-Box test. The p-value of the Ljung- Box larger than 0.05 suggests that the residuals are not correlated.
Figure 15:Residual check for “VN30_index_day_longer.xlsx”.

Figure 16:Forecast plot of “VN30_index_day_longer.xlsx”.

Step 5: Calculate the forecast: The data plot for the next five trading days will be as follows (Figure 16). Note that the forecast point remains the same and the dark blue line in the chart indicates that ARIMA (0,1,0) underpins naïve forecasts. In addition, the forecasting accuracy decreases (the interval becomes bigger) as the time frame of prediction increases. The dark shade and the light shade indicate the 80% and 95% confidence interval of the forecast respectively. The specific data can be seen in Table 3 below. The real data is quite close to the high end of the 80-percent confidence interval. The interval is moderately wide for changes in n daily data, so it is understandable why the real data falls in the 80-percent confidence interval.
Table 3:Forecasting results for “VN30_index_day_longer.xlsx”.

Discussion
Upon initial examination, it seems that the models used in this study can accurately predict the ranges in which the real data of the VN30 index will fall. This finding is consistent with the research of Ariyo et al. [37], Datta [34], Uko [35], and Nguyen TC et al. [39], all of whom have found that ARIMA is a suitable model for forecasting, particularly in the short-term. The comparison of forecast intervals shows that the 95% forecast interval is wider than the 80% interval. This means that while the model can provide a narrower range of probable values with 80% certainty, the potential variability of actual values increases significantly when we aim for a higher degree of certainty. This highlights the inherent uncertainty in stock market forecasting, which is consistent with the research of Fama [11] and Dunne [17]. However, the study still has limitations. Firstly, while the actual prices of VN30 fall within the 80-percent intervals, these intervals are still broad. This is because the primary objective of a forecasting model is to provide predictions that are as close as possible to the real data. A narrower forecasting range would be more beneficial for short-term traders in the Vietnamese market because it would be easier to take action. Secondly, the ARIMA model has limitations due to its characteristics. ARIMA users believe that past values and past errors are sufficient to forecast the future. Unfortunately, with the ARIMA (0,1,0) for the daily datasets, the author cannot leverage any historical data to predict future values. Other factors such as market sentiment, market efficiency, economic events, financial literacy of investors, or government policies should be considered in this case. Different models are required to address them. For the future development of this study, it would be beneficial to compare the performance of the ARIMA model with other forecasting methods such as Exponential Smoothing or state-space models. Hybrid models that incorporate machine learning techniques or use additional explanatory variables (such as macroeconomic indicators) are widely applied to many renowned indices in the world, such as S&P 500 or NIKKEI 225. It would be intriguing to try it on the VN30 index, despite the fact that the Vietnamese stock market is still young and has various shortcomings.
There is an interesting phenomenon mentioned in the thesis of Dunne [17], called “self-defeating strategies”. The idea of this is that if there is a successful predictive model that can bring profit to a group of people, we will never know that. Because if this knowledge is public, everyone could apply and reap an enormous profit, and then the advantages will be eroded away. That is why we should not be too obsessed with finding a perfect forecasting model for the stock market. Humans are always changing, and the models need to be constantly validated and updated. Lastly, calculating forecast accuracy is important. The research of Mondal et al. [36] and Khan [38] provided the exact percentage of forecasting accuracy. While Khan [38] used the Mean Absolute Percentage Error (MAPE) to calculate the result, Mondal et al. [36] used a formula:
𝐴𝑐𝑐𝑢𝑟𝑎𝑐𝑦 = (1 − |𝑎𝑐𝑡𝑢𝑎𝑙 𝑣𝑎𝑙𝑢𝑒 − 𝑝𝑟𝑒𝑑𝑖𝑐𝑡𝑒𝑑 𝑣𝑎𝑙𝑢𝑒|) ÷ 𝑎𝑐𝑡𝑢𝑎𝑙 𝑣𝑎𝑙𝑢𝑒
These methods require an exact forecast value, which is similar to the “Point Forecast” in the above tables of this article, to compare with the real data point. However, the “Point Forecast” in the above tables or the dark blue line in the above plots is just the middle point of the forecasting interval. They are not expected to be the real data points. Tables 1- 3 only indicate that there is an 80% or 95% possibility that the real data would lie between the lower and upper bound of the prediction interval. Therefore, while the ARIMA model can produce correct forecasting intervals to the VN30 Index on both a daily and monthly basis, the ranges are still fairly wide. They can still serve as a valuable reference for investors and financial analysts, providing a statistical basis for understanding potential future trends in the VN30 Index.
Conclusion
In summary, the objective of this study is to forecast the price of the VN30 Index using ARIMA models. Throughout the research, three data files were used. The first file contains monthly data of VN30 from February 2012 to December 2022. The second file contains daily data of VN30 from January 4th, 2022 to July 7th, 2023. The last file contains daily data of VN30 from June 18th, 2018 to July 7th, 2023. Leveraging the auto. arima () function in RStudio, we identified ARIMA (0,1,0) as the most appropriate model for the daily datasets, while ARIMA (0,1,0) (2,0,0) [12] was found to be the most appropriate model for the monthly dataset. These models, as demonstrated in Tables 1-3, provide precise prediction intervals that encompass all the future values of VN30. While the ranges may be wide, they serve as a valuable reference for investors, financial analysts, or individuals seeking a scientific and statistical basis to understand potential future trends in the VN30 Index.
Addressing the research question “Will the future values of the VN30 index fit into ARIMA’s prediction interval?” and the hypothesis “The future values of the VN30 index fit into ARIMA’s prediction interval.”, the answer is a resounding yes. This hypothesis was not only proven, but also validated within a specific timeframe, demonstrating the accuracy of the ARIMA models in predicting the VN30 Index. It’s important to acknowledge the limitations of this paper. Firstly, the forecasting intervals, are fairly broad. While there is no standard for the width of the prediction interval at the moment, a narrower forecasting range could be more meaningful for traders. Secondly, in this case, these output models could not fully leverage the strength of the ARIMA model, which explores the correlation between historical values and future values, especially the ARIMA (0,1,0) applied for the daily datasets. This situation might come from the volatility of the VN30 or the goodness of fit of ARIMA to the data files, suggesting that perhaps using the ARIMA model for VN30 is not a proper choice. These limitations, however, provide opportunities for further research and improvement. Looking ahead, future research could further enhance our understanding of the VN30 Index. It would be necessary to compare the forecasting performance of ARIMA to the performance of other models on VN30. These could be hybrid models involving machine-learning techniques, or models with the inclusion of other variables, such as market sentiment, market efficiency, economic events, financial literacy of investors, or government policies. Such research might better explain the fluctuation of the VN30 index, offering new insights and potential strategies for investors and financial analysts.
References
- Hyndman RJ, Athanasopoulos G (2018) Forecasting: Principles and practice (2nd edn).
- Pham DK, Pham TD (2020) Efficient market hypothesis and calendar effects: Empirical evidences from the Vietnam stock markets. Accounting 6(5): 893-898.
- Pham TN, Blokhina TK (2020) Improving the efficiency of Vietnam stock market. Advances in Business-Related Scientific Research Journal 11(1).
- Phan KC, Zhou J (2014) Market efficiency in emerging stock markets: A case study of the Vietnamese stock market. IOSR Journal of Business and Management 16(4): 61-73.
- Bui TN (2020) Financial development in Vietnam: An overview. The Journal of Asian Finance, Economics and Business, 7(9): 169-178.
- Vietnam Securities Depository (2023).
- Box GEP, Jenkins GM (1970) Time series analysis: Forecasting and control. Holden-Day, San Francisco, USA.
- Sharma A, Bhuriya D, Singh U (2017) Survey of stock market prediction using machine learning approach. 2017 International Conference of Electronics, Communication and Aerospace Technology (ICECA) 2: 506-509.
- Vadlamudi S (2017) Stock market prediction using machine learning: A systematic literature review. American Journal of Trade and Policy 4(3): 123-128.
- Cowles A (1944) Stock market forecasting. Econometrica 12(3/4): 206-214.
- Fama EF (1970) Efficient capital markets: A review of theory and empirical work. The Journal of Finance 25(2): 383-417.
- Kumbure MM, Lohrmann C, Luukka P, Porras J (2022) Machine learning techniques and data for stock market forecasting: A literature review. Expert Systems with Applications 197: 116659.
- Lohrmann C, Luukka P (2019) Classification of intraday S&P500 returns with a random forest. International Journal of Forecasting 35(1): 390-407.
- Lam M (2004) Neural network techniques for financial performance prediction: Integrating fundamental and technical analysis. Decision Support Systems 37(4): 567-581.
- Do VT, Nguyen MH (2021) Forecast of the VN30 index by day using a variable dimension reduction method based on kernel tricks. In: Phan CV, Nguyen HN (Eds.), Nature of Computation and Communication, pp. 83-94.
- Nti I, Adekoya A, Weyori B (2020) A systematic review of fundamental and technical analysis of stock market predictions. Artificial Intelligence Review 53(4): 3007-3057.
- Dunne M (2015) Stock market prediction [University College Cork].
- Bui TK, Tran TH (2022) Forecasting stock price movement direction by machine learning algorithm. International Journal of Electrical and Computer Engineering 12: 6625-6634.
- Pham NH, Hoang TH, Phan DH (2022) An empirical examination on forecasting VN30 short-term uptrend stocks using LSTM along with the Ichimoku cloud trading strategy. In: Sharma H, Shrivastava V, Kumari Bharti K, Wang L (Eds.), Communication and Intelligent Systems, pp. 235-244.
- Huang W, Nakamori Y, Wang SY (2005) Forecasting stock market movement direction with support vector machine. Computers & Operations Research 32(10): 2513-2522.
- Lv P, Wu Q, Xu J, Shu Y (2022) Stock index prediction based on time series decomposition and hybrid model. Entropy 24(2): 146.
- Cao L, Garcia-Feijóo L (2021) The emerging Asia-Pacific capital markets. CFA Institute Research Foundation.
- Vung DT, Ha NTT (2023) Sustainable development of Vietnam stock market. European Journal of Development Studies 3(2): 2.
- Nasir MA, Shahbaz M, Mai TT, Shubita M (2021) Development of Vietnamese stock market: Influence of domestic macroeconomic environment and regional markets. International Journal of Finance & Economics 26(1): 1435-1458.
- Le TT (2010) Supervise stock transactions on the Vietnamese market [The supervision of transactions in Vietnamese stock market] [National Economics University].
- Nguyen TH, Nguyen TBK (2010) Stock prices and macroeconomic variables in Vietnam: An empirical analysis. Journal of Economic Development, p. 190.
- Morgan PJ, Trinh LQ (2020) Fintech and financial literacy in Viet Nam. ADBI Working Paper 1154, Asian development bank institute.
- Dao B (2013) VN30 index: An overview and default probability analysis.
- Nguyen SP, Pham UH, Nguyen TD (2018) On a generalized method of combining predictive distributions for stock market index. In: Huynh VM, Inuiguchi M, Tran DH, Denoeux T (Eds.), Integrated uncertainty in knowledge modelling and decision making, pp. 253-263.
- Contreras J, Espinola R, Nogales F, Conejo A (2003) ARIMA models to predict next-day electricity prices. Power Systems, IEEE Transactions 18(3): 1014-1020.
- Kumar K, Yadav AK, Singh MP, Hassan H, Jain VK (2004) Forecasting daily maximum surface ozone concentrations in Brunei Darussalam-An ARIMA Modeling Approach. J Air Waste Manag Assoc 54(7): 809-814.
- Merh N, Saxena VP, Pardasani KR (2011) Next day stock market forecasting: An application of ANN and ARIMA. The IUP Journal of Applied Finance17(1): 70-84.
- Al-Zeaud HA (2011) Modelling and forecasting volatility using ARIMA model. European Journal of Economics, Finance and Administrative Sciences 35: 109-125.
- Datta K (2012) ARIMA forecasting of inflation in the Bangladesh economy. The IUP Journal of Bank Management 10(4): 7-15.
- Uko AK, Nkoro E (2012) Inflation forecasts with ARIMA, vector autoregressive and error correction models in Nigeria. European Journal of Economics, Finance and Administrative Sciences, pp. 71-87.
- Mondal P, Shit L, Goswami S (2014) Study of effectiveness of time series modeling (arima) in forecasting stock prices. International Journal of Computer Science, Engineering and Applications 4(2): 13-29.
- Ariyo AA, Adewumi AO, Ayo CK (2014) Stock price prediction using the ARIMA model. 2014 UKSim-AMSS 16th International Conference on Computer Modelling and Simulation, pp. 106-112.
- Khan S, Alghulaiakh H (2020) ARIMA model for accurate time series stocks forecasting. International Journal of Advanced Computer Science and Applications (IJACSA) 11(7): 524-528.
- Nguyen TC, Hoang HS, Ngo TH, Tran THL, Trinh MN (2020) Comparison between ARIMA and LSTM-RNN for VN-index prediction. In: Ahram T, Karwowski W, Vergnano A, Leali F, Taiar R (Eds.), Intelligent human systems integration, pp. 1107-1112.
- The Comprehensive R Archive Network (CRAN).
- Box GEP, Cox DR (1964) An analysis of transformations. Journal of the Royal Statistical Society: Series B (Methodological) 26(2): 211-243.
- Luu TT (2011) The relationship between the United States and Vietnam stock market. International Journal of Business and Finance Research 5(1): 77-89.
- Nguyen C, Ishaq Bhatti M, Henry D (2017) Are Vietnam and Chinese stock markets out of the US contagion effect in extreme events? Physica A: Statistical Mechanics and its Applications 480: 10-21.
- Nguyen T (2011) US macroeconomic news spillover effects on Vietnamese stock market. The Journal of Risk Finance 12(5): 389-399.
- Nguyen MK, Le DN (2021) Return spillover from the US and Japanese stock markets to the Vietnamese stock market: A Frequency-domain approach. Emerging Markets Finance and Trade 57(1): 47-58.
- Nguyen VC, Nguyen TT (2022) Dependence and contagion between Vietnamese and major east Asian stock markets. International Journal of Management Practice. Inderscience Enterprises Ltd 15(4): 445-459.
© 2024 Tetiana Paientko. This is an open access article distributed under the terms of the Creative Commons Attribution License , which permits unrestricted use, distribution, and build upon your work non-commercially.
Editor In Chief


.jpg)


Signup for Newsletter

Quick Links
 Editorial Board Registrations
 Submit your Article
 Refer a Friend
 Advertise With Us
Our Recent Edition

.jpg)


Top Editors


.jpg)


.bmp)
.jpg)
.png)
.jpg)


.jpg)


.png)

.png)


.png)


Financial Support

Sponsors

Latest e-Books

Latest Video

 a Creative Commons Attribution 4.0 International License. Based on a work at www.crimsonpublishers.com.
Best viewed in
a Creative Commons Attribution 4.0 International License. Based on a work at www.crimsonpublishers.com.
Best viewed in