- Submissions

Full Text
Strategies in Accounting and Management
The Application of Business Analytics for Performance Management: The Results of Some Exploratory Case Studies
Paolo Maccarrone*
Associate Professor, Politecnico di Milano, Department of Management, Economics and Industrial Engineering, Via Lambruschini 4b, 20156 Milano, Italy
*Corresponding author:Paolo Maccarrone, Associate Professor, Politecnico di Milano, Department of Management, Economics and Industrial Engineering, Via Lambruschini 4b, 20156 Milano, Italy
Submission:September 12, 2023;Published: September 25, 2023

ISSN:2770-6648Volume4 Issue2
Abstract
This study investigates Business Analytics and Big Data applications in the domain of Finance function and controller activities: these applications are often referred to as “Business Performance Analytics” (BPA). Business Performance Analytics (BPA) has been recognized as having a significant impact on a company’s performance and can serve as a sustainable competitive advantage. However, there are limited studies that directly address this topic, often focusing on specific techniques and applications. The purpose of this work is to contribute towards bridging this gap by providing a managerial perspective on how companies implement BPA systems. This involves analyzing the key components of BPA, identifying the improvements it brings to controller activities, and how a company can benefit from implementing BPA. To attain the objectives, a qualitative approach was selected due to the investigative nature of the research. The initial step was to construct a theoretical framework, followed by seeking endorsement from experts and practitioners in the field. Finally, the theoretical framework was used to conduct eight exploratory case studies.
Keywords:Business performance analytics; Big data; Business analytics; Finance
Introduction
Big Data and Business Analytics research is acknowledged to be of high and increasing relevance since 2011 [1,2]. In 2012 Harvard Business Review published a special issue on these topics, whose articles would have been quoted many times in the forthcoming years. As an example, Davenport [3] explored the emerging job positions that would become essential in corporations. Meanwhile, McAfee [4] highlighted both the benefits and obstacles that could hinder the progress of this innovative trend. From that time on, research on this topic was boosted, covering different aspects and applications of the so-called “management revolution”.
Literature Review
Big Data and Business Analytics have become a recent and complex phenomenon that significantly affects how companies operate, leading to a “Management revolution” [4]. Their impact on a firm is extensive, encompassing not only technology but also competencies, organization, and culture [4-6]. Big Data and Business Analytics are often seen as the crucial connection between complex Performance Measurement and Management Systems (PMMS) and their practical application [7]. They can also serve as a solution to the lack of progress in accounting research overall [8]. The combination of these fields is referred to as Business Performance Analytics (BPA). BPA utilizes performance management models that incorporate PMMS, IT infrastructure, Big Data, and Business Analytics to enhance comprehension of business dynamics, formulate business strategies, and measure and manage performance [9]. Based on the information provided, it is possible to identify four essential components (Figure 1). A PMMS is a complex system of measures used to evaluate the efficiency and effectiveness of business actions, planning, and future management [10,11]. The IT infrastructure plays a crucial role in enabling this system [12]. The infrastructure supporting Big Data and Business Analytics is rapidly changing. This includes the enabling infrastructures, such as data warehouses and data lakes, as well as software systems like SQL, NoSQL, and NewSQL. Big Data, with its high Volume, Variety, and Velocity characteristics, cannot be managed using typical database software tools Manyika et al. [13] Business Analytics, including machine learning and data mining, are used to analyze data and classified as descriptive (analyzing historical data), predictive (analyzing future data), and prescriptive (i.e.: given a scenario, what is the best action to take?) Holsapple et al. [14]. The four main components that contribute to the BPA system can be summarized as follows:
Figure 1:BPA key component [9].
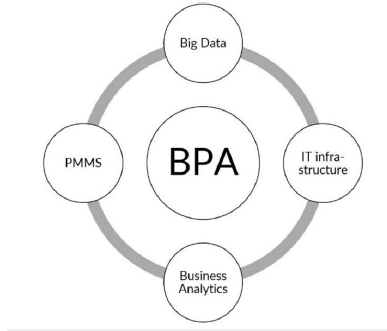
A. PMMS, which sets BPA system goals.
B. IT infrastructure, which enables BPA system.
C. Big Data, which acts as BPA “fuel”.
D. Business Analytics, which elaborates Big Data through IT
infrastructure tools to achieve the goals set by PMMS.
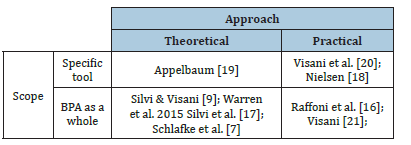
Despite being recognized as relevant, research on BPA is still in its early stages and falls short of expectations [15]. According to Raffoni et al. [16], there is a lack of empirical validation for the theoretical implementation frameworks studied. This weakness is discussed in studies by Schläfke et al. [7] and Silvi et al. [17]. In recent times, journals have published research studies that aim to bridge the gap in specific areas of Performance Measurement and Management. These studies have implemented Business Analytics in tools like the Balance Scorecard (BSC) in both practical Nielsen [18] and theoretical Appelbaum [19] approaches. Additionally, methodologies like the Total Cost of Ownership (TCO) Visani [20] have also been utilized. Silvi [9] analyzed the key components of a BPA, while Raffoni et al. [16] highlighted challenges that need to be faced in the implementation process, building a framework that was then also validated by Visani [21]. Table 1 resumes this literature analysis. As shown in Table 1, only two studies, Raffoni et al. [16] and Visani [21], have analyzed the BPA system as a whole using a practical approach. However, in their works the authors do not take into account the impact on controllers’ daily activities, but just the macro-steps of BPA implementation.
Table 1:Core papers classification highlighting a gap in scientific literature.
Objectives
The objective of this work is to bridge the gap by presenting
a comprehensive overview of BPA, including its applications and
impact on business dynamics from a practical standpoint. This
will provide insight into companies’ strategic decision-making
regarding the adoption and implementation of these tools. More
specifically, the following research questions have been formulated:
RQ 1: What is the degree of diffusion of BPA systems among
companies, in terms of key components (PMMS, IT infrastructure,
Business Analytics, Big Data)?
Indeed, while the theoretical analysis of BPA key components in Figure 1 was well developed by Silvi and Visani [20], their market diffusion and configurations remain unclear. Therefore, this research question aims to clarify this point.
RQ 2: How do BPA improvement areas impact controllers’ activities?
Existing literature has focused on providing best practices for implementing BPA systems [16,21]. However, it has not been investigated how the several improvements generated by a fully or partially implemented system influence business dynamics and particularly controllers’ activities.
RQ 3: Which advantages are pursued by companies implementing a BPA system?
The existing literature discusses the benefits of Big Data and Business Analytics for companies but neglects to focus on BPA. The third question aims to evaluate the benefits and compare the results with those deriving from previous studies.
Methodology
A qualitative approach was chosen due to the infancy of BPA research and the lack of direct literature addressing many issues. In fact, while Big Data and Business Analytics have been extensively analyzed, their application in the BPA domain is still limited. A structured survey might be misinterpreted by the people being interviewed, leading to the omission of crucial details (Figure 2). The methodology consists of three main steps, as follows:
Figure 2:BPA framework primary blocks.

1. Development of an original theoretical BPA framework, both
organizing existing literature directly addressing BPA (Silvi
[9]) and adapting general results about Big Data, Business
Analytics, and Management Control tools impact [4].
2. As the current literature does not adequately cover the topics
addressed by the BPA framework, it was necessary to validate
and enrich it with preliminary interviews with field experts
and practitioners.
3. Eight companies have been selected to conduct case studies
on the effectiveness of BPA systems in real scenarios. During
the case studies interviews, a semi-structured approach was
followed, which allowed for the differences among companies
to come to light. The companies in the sample varied in size,
industry, and culture, as these factors can affect the BPA system
configuration. The development of each case study followed
the following same macro-steps:
a. Brief preliminary illustration of the objectives of the study (by
email/phone).
b. Face-to-face BPA framework presentation.
c. The interviewee was then asked to provide a brief overview of
the company they work for, including any unique business and
market characteristics.
d. The interviewee was then asked to give examples of current
and potential future applications of BPA in the company and
provide feedback on the clarity and completeness of the
framework. BPA framework.
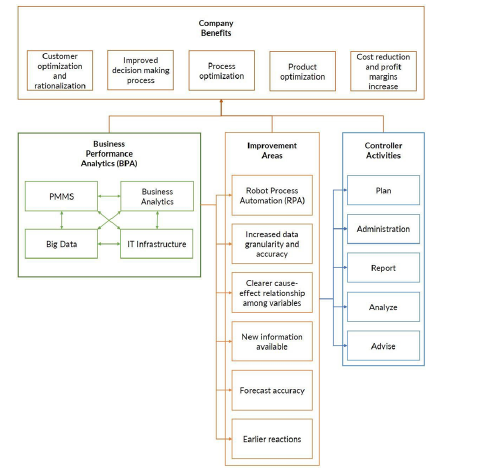
The interview consisted of 4 main sections and 20 subsections. These can be analyzed to answer research questions. The questions underwent a detailed analysis of existing literature and were validated and improved by experts in step 2. The BPA section was based on the work by Silvi [9]. Secondary blocks have been adequately detailed in dedicated chapters, giving special attention to Big Data and Business Analytics. The development of the remaining sections was based on a consistent body of literature (Manyika et al. [13]; Barton [22]; Chang et al. [23]; Cokins [24]; Cokins [25]; Gandomi [26]; Accenture [27], Plaschke et al. [28]), and then reviewed according to the results of preliminary interviews (Figure 3).
Figure 3:BPA framework.
Discussion of Findings
A cross-case analysis of each section’s answers improved the framework, clarifying content and relationships, and ultimately answering the research question. In the following the main findings are presented and discussed. About the first research question, BPA diffusion and macro-configuration (in terms of key components) have been found to depend primarily on company size (Figure 4). Case studies allowed us to analyze different firm sizes, ranging from SMEs to Fortune 500 companies. Large firms have more need for BPA systems, that enable them to analyze and find correlations between different business lines and markets, and capabilities to invest in technologies and competencies. Currently, since BPA systems are still in the early stages of their evolution, other drivers are still not definite enough. This has been suggested by several interviews, for example.
Figure 4:BPA configuration and company size.

“When we kicked off our analytics project for performance
management, we started looking for benchmarks but didn’t find
any. This is something completely new not only for us but for the
market” (Energy S.p.A. AFC Digital Hub - Chapter Leader Data
Competence Center and Advanced Analytics). Regarding the
second research question, although there is no statistical evidence
to generalize the results, the impact of Improvement Areas on
controllers’ activities has been measured and classified. From
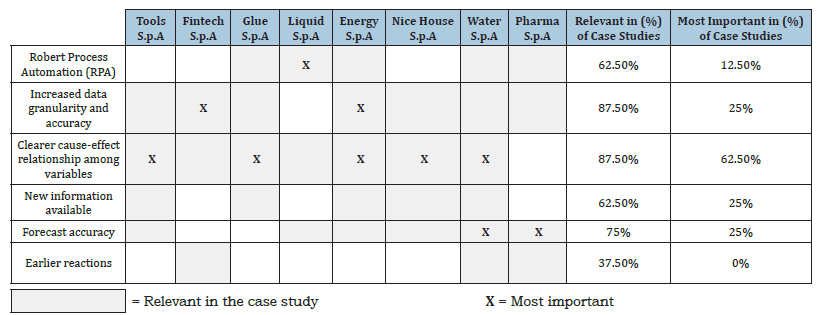
Table 2 it is possible to notice that Increased data granularity and
accuracy and Clearer cause-effect relationships among variables
are considered the improvements impacting Controller Activity
the most. But how? Two main relationships have been identified,
depending on the activity category:
A. Operational ⟶ Administration, (Report).
B. Strategic ⟶ Plan, Analyze, Advise, (Report).
Table 2:Improvement Areas block results summary.
Report activity can be both Operational and Strategic, depending on company choices. While advanced robots, through Robot Process Automation (RPA), are now executing most of the repetitive and not value-adding operational activities, BPA is enriching and increasing the potential of more strategic activities, thanks to increased data granularity and accuracy, clearer cause-and-effect relationships among variables, the availability of new information, higher forecast accuracy and higher timeliness (“earlier reactions”). With the use of data-driven approaches, controllers are now able to make more informed decisions based on factual information. For example, in the case of a furniture retail company, an example of a strategic decision that was supported by BPA is the following: “Entering Lebanon market, which brand and which kind of stores should we adopt?”.
These initial findings on the impact of BPA on controllers’ activities allow for the formulation of hypotheses on the evolution of the Finance function’s role, a topic that has long been debated in the literature. Will it become CEO’s “Strategic advisor” (Cokins [25]) and “ramp up as analytics leader” (Davenport [29]), empowered by BPA, or its strategic relevance will decrease because of increased automation (Frey [30])? Two main evolution drivers have been identified during exploratory case studies: Business and Culture. The impact of BPA on a company’s Finance function role is determined by its business characteristics, including market, customers, culture, and strategy. If a business is heavily influenced by consumer needs and prioritizes customer service and product differentiation, it’s likely that the Finance department’s strategic importance will decrease. On the other hand, a business operating in a commodity market and prioritizing internal processes and cost reduction will likely move in the opposite direction (Figure 5). Table 3 presents an overview of the most commonly mentioned company benefits in the exploratory case studies regarding the third research question. Cost reduction and profit margin increase, Improved decision-making process and Process optimization have been found to be the most common Company Benefits pursued by companies. More specifically, the improvement of decision making is achievable thanks to the data-driven approach enabled by BPA, while the optimization of processes is achieved by automating controllers, eliminating repetitive activities, and making it easier to identify inefficiencies in other processes. Instead, Customer optimization and rationalization and Product optimization, are often addressed by other data analytics implementations in Marketing function, rather than by BPA projects. It is important to note that the qualitative nature of this study means that the results cannot be generalized. This study therefore can serve as a starting point for further research, that can investigate more in detail a specific research question through the use of quantitative research methodologies [31].
Figure 5:Finance function role evolution.
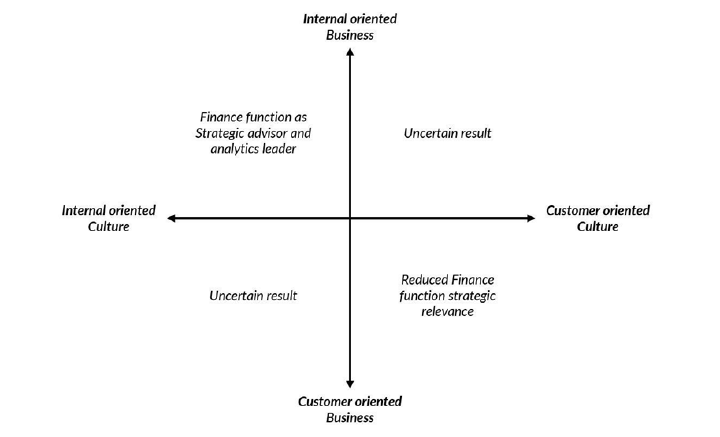
Table 3:Company benefits block results summary.

References
- Fosso Wamba S, Akter S, Edwards A, Chopin G, Gnanzou D (2015) How “big data” can make big impact: Findings from a systematic review and a longitudinal case study. International Journal of Production Economics 165: 234-246.
- Frizzo-Barker J, Chow-White PA, Mozafari M, Ha D (2016) An empirical study of the rise of big data in business scholarship. International Journal of Information Management 36(3): 403-413.
- Davenport TH, Patil DJ (2012) Data scientist: The sexiest job of the 21st Harvard Business Review 90(10): 70-76.
- McAfee A, Brynjolfsson E (2012) Big data: The management revolution. Harvard Business Review 90(10): 60-66.
- Burton Richard M, Dolly M, Salvador F (2014) Big data and organization design. Journal of Organization Design 3(1): 37-45.
- Davenport TH, Bean R (2018) Big companies are embracing analytics, but most still don’t have a data-driven culture. Harvard Business Review, pp. 6.
- Schläfke M, Silvi R, Möller K (2012) A framework for business analytics in performance management. International Journal of Productivity and Performance Management 62(1): 110-122.
- Merchant KA (2012) Making management accounting research more useful. Pacific Accounting Review 24(3): 334-356.
- Silvi R, Visani F (2016) Business analytics: Nuove prospective per il performance management. Management Control, pp.3-18.
- Bourne M, Neely A, Mills J, Platts K, Bourne M, et al. (2003) Implementing performance measurement systems: A literature review. Int J Business Performance Management 5(1): 1-24.
- Neely A, Gregory M, Platts K (1995) Performance measurement system design: A literature review and research agenda. International Journal of Operations and Production Management 15(4): 80-116.
- Ferreira A, Otley D (2009) The design and use of performance management systems: An extended framework for analysis. Management Accounting Research 20(4): 263-282.
- Manyika J, Chui M, Brown B, Bughin J, Dobbs R, et al. (2011) Big data: The next frontier for innovation, competition, and productivity. McKinsey Global Institute, CA, USA.
- Holsapple C, Lee-Post A, Pakath R (2014) A unified foundation for business analytics. Decision Support Systems 64: 130-141.
- Ask U, Magnusson J, Bredmar K (2016) Big data use in performance measurement and management: A call for action. Journal of Business and Economics 7(3): 402-417.
- Raffoni, A, Visani F, Bartolini M, Silvi R (2017) Business performance analytics: Exploring the potential for performance management systems. Production Planning and Control 29(1): 51-67.
- Silvi R, Möller K, Schläfke M (2010) Performance management analytics: The next extension in managerial accounting. Managerial Accounting E Journal 45(2): 1.
- Nielsen S (2017) Business analytics and performance management: A small data example combining TD-ABC and BSC for simulation and optimization. SSRN Electronic Journal: 1-23.
- Appelbaum D, Kogan A, Vasarhelyi M, Yan Z (2017) Impact of business analytics and enterprise systems on managerial accounting. International Journal of Accounting Information Systems 25: 29-44.
- Visani F, Barbieri P, Di Lascio FML, Raffoni A, Vigo D (2016) Supplier’s total cost of ownership evaluation: A data envelopment analysis approach. Omega 61: 141-154.
- Visani F (2017) Applying business analytics for performance measurement and management. The case study of a software company. Management Control 2: 89-123.
- Barton D, Court D (2012) Making advanced analytics work for you. Harv Bus Rev 90(10): 78-83.
- Chang RM, Kauffman RJ, Kwon Y (2014) Understanding the paradigm shift to computational social science in the presence of big data. Decision Support Systems 63: 67-80.
- Cokins G (2013) Top 7 trends in management accounting - Part 2. Strategic Finance, pp. 21-29.
- Cokins G (2014) Mining the past to see the future. Strategic Finance, pp. 23-30.
- Gandomi A, Haider M (2015) Beyond the hype: Big data concepts, methods, and analytics. International Journal of Information Management 35(2): 137-144.
- Accenture (2018) From bottom line to front line.
- Plaschke BF, Seth I, Whiteman R (2018) Bots, algorithms, and the future of the finance function. McKinsey and Company, USA, pp. 1-9.
- Davenport TH, Tay A (2016) Finance must ramp up role as analytics leader.
- Frey CB, Osborne M (2013) The future of employment: How susceptile are jobs to computerisation? Oxford Martin Programme on Technology and Employment, p. 79.
- Otley D (1999) Performance management: A framework for management control systems research. Management Accounting Research 10(4): 363-382.
© 2023 Paolo Maccarrone. This is an open access article distributed under the terms of the Creative Commons Attribution License , which permits unrestricted use, distribution, and build upon your work non-commercially.
 a Creative Commons Attribution 4.0 International License. Based on a work at www.crimsonpublishers.com.
Best viewed in


.jpg)


 Editorial Board Registrations
 Submit your Article
 Refer a Friend
 Advertise With Us
.jpg)


.jpg)


.bmp)
.jpg)
.png)
.jpg)


.jpg)


.png)

.png)


.png)


