
- About Us
- Information
-

The Author ensures that the research has been conducted responsibly and ethically with adherence to all relevant regulations. read more..
- For Authors
- For Reviewer
- Manuscript Guidelines
- Membership
- Publication Ethics
-
- Journals
- Reprints
- e-Books
- Videos
- Policies
- Contact Us
 COVID-19
- Submissions


Full Text
Strategies in Accounting and Management
Greek Corporate Failure Using a Logit Approach
Toudas Kanellos1, Giannakopoulos Themistoklis2 and Boufounou Paraskevi3*
1Department of Agribusiness and Supply Chain Management, Agricultural University of Athens, Greece
2School of Social Sciences, Hellenic Open University, Greece
3Department of Economics, National and Kapodistrian University of Athens, Greece
*Corresponding author:Boufounou Paraskevi, Department of Economics, National and Kapodistrian University of Athens, Greece
Submission:December 01, 2022Published: December 13, 2022

ISSN:2770-6648Volume3 Issue5
Abstract
The Greek economy’s prolonged financial crisis, which began in 2010, has resulted in the corporate bankruptcy of many Greek companies and is one of the most important subjects of scientific research. In this study, we estimate a Logit model to predict the likelihood of Greek company bankruptcy using financial indices for the period 2011-2022. The sample includes 96 firms, with an equal number of healthy and bankrupt firms. The study concludes that predictors representing business profitability (profitability ratios: Cashflow/turnover and EBITDA Margin) and operational efficiency (Net asset turnover and Credit period) lead to the distinction between healthy and bankrupt companies by studying 21 financial indices.
Keywords:Corporate failure; Logit, Financial crisis; SMEs; Financial indices
Introduction
According to EC [1], Small and Medium-Sized Enterprises (SMEs) play an important role in the Greek economy. They account for 63.5% of value added and have an unusually high labour share of 87.9%. Greek SMEs employ 2.6 workers on average, which is about a third less than the European Union average of 3.9 and have suffered disproportionately as a result of the crisis, unable to cope with changing spending patterns and unavailable credit [2]. Business failure is a contingency for business owners Pratten [3] and is a more likely outcome for new businesses, but there is little evidence-based knowledge of how/when it occurs. Such studies offer both useful insights into the conditions required for small businesses to succeed in times of economic hardship, and support for the development of government support strategies [4]. Abdelsamad [5] support the view that “while failures in a free-market system cannot be completely avoided, the failure rate can be reduced if some of the stimuli are identified and preventive measures are taken”. In this study, utilizing financial indices, we construct a Logit model to predict the likelihood of Greek company bankruptcy over the years 2011–2022. The sample consists of 96 businesses, with an equal proportion of profitable and unsuccessful businesses. The study, which looked at 21 financial indices, came to the conclusion that the predictors that represent operational profitability (profitability ratios of Cashflow/turnover and EBITDA Margin) and operational efficiency (Net asset turnover and Credit period) are what distinguish healthy from bankrupt companies. This study is organized as follows: At the beginning, a brief description of the basic definitions of corporate failure and the methods of its prediction that have been developed is given and a brief overview of the main studies on corporate failure in Greece is provided. The presentation of the methodological approach followed and the sample used follows. The main results of the research are then presented. Finally, the main conclusions of the study, the practical implications that could be drawn from its use and the possibilities for further research extension are critically commented upon.
Literature Review
Altman [6] stated that four different terms has been used when discussing financial distress
in companies: failure, solvency, bankruptcy and default. Many conceptual discussions have
focused on the different ways in which bankruptcy can be described. Everett [7] and “includes
liquidation of insolvent companies and personal bankruptcy.
According to Fredland [8], “bankruptcy suggests that resources
have been shifted to more profitable opportunities”. He notes that
“bankruptcy must mean an inability to ‘make ends meet’ whether
the losses involve one’s own capital or someone else’s” [9]. Watson
[10] defined five types of business failure:
A. Business interruption (for any reason),
B. Discontinuance or change of ownership.
C. Declaration of bankruptcy, discontinuance of business
D. Closure to prevent further losses; and
E. Failure to achieve financial objectives.
While many firms close due to a profitable takeover [11], many more close due to insolvency [12], which is especially common in Greece following the recent financial crisis of 2010 and on. Failure is defined by Dimitras et al. [13] as a company’s inability to repay creditors, vendors, preferred stockholders, and other creditors, or when a bank loan cannot be repaid or the company has been declared bankrupt by law. All of the preceding events caused the company’s operations to be halted. Poston et al. [14] identified five stages of survival business failure: incubation, financial insolvency, total insolvency, and confirmed insolvency. Financial indicators or signs, according to Taffler [15], can be analyzed to predict bankruptcy or organizational failures. The signs or indicators will appear if the company’s financial statements are examined during a specific time period [16,17]. He studied 45 healthy and 23 failed firms in the UK for four years, from 1968 to 1973, and has a predictive accuracy of 96% for failed firms and 100% for healthy firms. Financial ratios, according to Altman [18], should be used to determine whether an organization is experiencing operational and financial difficulties. Financial ratio analysis can predict financial distress five years before bankruptcy by determining a company’s earnings growth, liquidity, leverage, turnover, volatility, and size [19,20]. Many experiments have been conducted over the years to predict bankruptcy using various indicators. According to Bellovary et al. [21], the literature on bankruptcy prediction dates back to the 1930s, when the Bureau of Market Research published a report that identified eight indicators as successful indicators for failing firms. For the next 30 years, bankruptcy prediction models relied on univariate or univariate regression to forecast potential losses. Simple indicators (without multivariate regression) can be deceptive and insufficient for predicting default. Altman [18] was the first to apply a Multiple Discriminant Analysis (MDA) Model which calculates a Z-score based on five economic indicators, distinguishing between healthy and non-healthy firms. He studied 33 healthy and 33 failing U.S. firms (included in Chapter X). for 3 years in the period 1946-1965 and has a predictive accuracy of 76%. Subsequent studies also use a larger number of indicators, but this does not necessarily mean that better predictive ability is achieved. For example, the model of Jo et al. [22] achieves 81.94% predictive ability using 57 different indicators, while the model of Rose [23] achieves 76% predictive ability using 23 different indicators, and the model of Moses [24] achieves 85% predictive ability using 3 different indicators. These models are for various countries and time periods. To predict a company’s bankruptcy, models based on various ratios have been developed. When compared to Altman’s Z-score, which uses five different ratios to analyze a company’s bankruptcy, their MDA used more ratios, but this did not always result in higher predictive accuracy. Jo et al. [22] ’s model with 57 variables/indices has an 81.94% predictive accuracy, while the model of Rose [23] with 23 variables/indices has a 76% predictive accuracy, and the model of Moses [24] with 3 variables/indices has an 85% predictive accuracy.
In order to assess the impact of the Greek financial crisis of 2010, Benetatos [25] developed an Altman Z-score Multiple Discriminant Analysis (MDA) bankruptcy prediction model evaluating 21 financial indicators (19 used in previous studies and 2 new proposed by their study), studying more 350 healthy and 105 bankrupt Companies for the period 2006-08; and 350 healthy and 86 bankrupt Companies for the period 2010-12. Using discrete analysis methodology, a model for each of the time intervals was developed, which served as the primary tool for predicting classification into one of the two predefined groups (healthy and bankrupt companies). Following the crisis, the overall prediction rate for healthy companies was 98.9% in 2012. A number of new models followed, according to Bellovary et al. [21]. In the 1970s, 28 studies were published, followed by 53 in the 1980s and 70 in the 1990s. Eleven studies were published between 2000 and 2004. Neural network models and other Artificial Intelligence techniques [26-28] and Logit (Ohlson [29] and Probit (Zavgen 1983; Zmijewski [30] models have also been used to predict bankruptcy. As developed by Poston [14] and Dimitras et al. [13] these models are used by audit firms, financial consultants, insurance companies, insurers and financial institutions,
Although the majority of bankruptcy prediction literature has
focused on the United States and the United Kingdom, several
Discriminant Analysis bankruptcy prediction models for Greece
have been developed, according to Giannopoulos [31]:
A. Grammatikos [32] analyzed 29 healthy and 29 bankrupt
companies for the period 1986-1990 compared the
performance of Probit, logit and MDA linear probability
analysis prediction models. Probit and Linear Probability
models had the best predictive ability of 70.8%.
B. Theodossiou [33] compared the performance of a linear
probability model, a logit model and a Probit model and the
Linear Probability model had the best predictive ability 96.4%.
C. Dimitras et al. [34] and Dimitras et al. [13] compared the
performance of a rough set theory model, a multi-discriminate
analysis model, and a logit model and the rough theory model
had the best predictive ability of 73.7%
D. Zopounidis [35] developed a Multi-Criteria Decision Aid
(MCDA) discriminant model using twelve variables/indices to
study 58 healthy and another 58 bankrupt Companies for the
period 1990-1995 which had a predictive accuracy of 47.37%
to 84.21% for the bankrupt Companies.
E. Boufounou [36] compared the predictive ability of Logit and
Probit Models using financial ratios to predict corporate
bankruptcy for Greek companies listed and unlisted in the
Athens Stock Exchange (ASE) for the period 2005-2018 and
they concluded that duration is important. The shorter the
study time period before bankruptcy, the better the results.
The Logit Model was the better fit. The Probit method is
deemed, based on the reviewed literature, able to yield much
better results if the company’s Board of Directors were given
the opportunity to complete a questionnaire of the company in
question, to create an Ordered Probit Model. Excessive lending
was found to increase dramatically 3 years before bankruptcy
[37].
Materials and Methods
Sample characteristics
This study’s data sample consists of 92 firms, with 46 in each of the two categories of Bankrupt and Healthy. Companies in the Bankrupt category have declared bankruptcy under Greek law and have had their last year of operation between 2011 and 2021, and the sample consists of 96 firms, evenly distributed between healthy and bankrupt (i.e., 46 in each category). The data for the study came from financial statements dated one year before the bankruptcy. At the time of the study, the companies in the healthy group were still in operation. Financial ratios, by definition, deflate data by scale, removing a significant portion of the size effect, as is widely accepted. The logit model, discussed further below, tends to be stable enough to support large companies. The logit model estimated includes large bankrupt firms and undoubtedly applies to both small and medium sized firms. In theory, it would be desirable to analyze a set of indicators at time t to make predictions for companies in the future (t+1). This could not be explored due to data limitations.
Indices option
Based on the literature and the availability of data, a total of 21 indices were selected for bankruptcy prediction, classified into four categories, as shown in Table 1 below, which were classified into four general categories: profitability, efficiency, management structure and human resource management. The data necessary for their assessment were obtained from the financial statements (balance sheet and income statement) of each company in the two samples (Healthy and Bankrupt).
Table 1: Categories of Financial Indices.

Logit model
The Logit model is a probability methodology within certain conditions used to investigate the relationship between a set of characteristics of an individual (or company) and its tendency to belong to previously defined classes, a key feature of which is that the dependent variable can only have a value of 0 or 1 (dichotomous variable). To determine the parameters of the model, the maximum likelihood approach is used. Maximum likelihood estimation is one of the methods created by statisticians to estimate the parameters in a mathematical model. This approach can be used to estimate both complex nonlinear and linear models. Some multivariate statistical methods, such as discrete regression, are used to estimate a dichotomous dependent variable from a variety of independent variables. Linear discriminant analysis predicts the category to which the characteristic-bankrupt/non-bankrupt - corresponds directly. Although it is an optimal prediction rule, this strategy involves the assumption of multivariate normality of the independent variables and tables of variance-covariance is equal in both classes.
In the logit model there are no restrictions on the normality of the explanatory variables. Therefore, it seems less restrictive in its application. When applied to the logit model, the main objective of the maximum likelihood estimation method is to find the value of the parameters β and σ2 that maximize the probability given by the likelihood function. Thus, in the Logit model, the relationship between the probability of a business failure (p) and the price of financial indicators is a curve in S ranging between 0 and 1. The logit model is well known because it corresponds to the general sigmoid form of the accounting equation. If the vector Zi is interpreted as an index that incorporates the contributions of various risk factors, then F(Zi) represents the risk for a given value of Z. As a result, risk is small for low values of Z, increases over a range of intermediate Z values, and remains close to one until Z is high enough. The structure of a logit model is based on a logistic cumulative probability function, defined as:
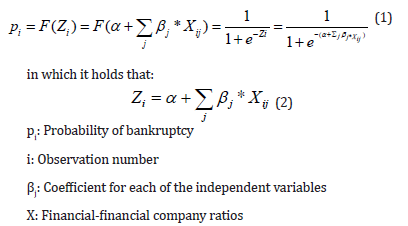
The parameters β of the equation define the rate of increase or decrease of the S-shaped curve for p(i). The sign of the parameter indicates whether the curve is rising (β > 0) or falling (β < 0), and the level of change increases as |β| increases. The right-hand side of equation (1) simplifies to a constant when β = 0. The curve then becomes a horizontal line when p(i) is equal to i. Equation (1) is suitable for modeling a probability since the values of F(Zi) range from 0 to 1 as it varies from -∞ to +∞. The probability of default is obtained by the product of the ratios and an index Z, which transforms the previous expression, allowing for a certain probability of default. Explanatory variables with negative coefficients reduce the probability of default by reducing 𝑒y to zero. Similarly, independent variables with a positive coefficient increase the risk of default.
The Logit methodology may present the problems that it
requires the groups to be clearly well separated; and the explanatory
variables to be independent, however it has important advantages,
including that:
A. It does not limit the researcher to assuming that the dependent
and independent variables have a linear relationship.
B. It does not require the variables to conform to a normal
distribution.
C. It is more robust than discriminant analysis, as it is applicable
outside the normal distribution.
D. The dependent variable can be thought of as the probability
that the firm will declare bankruptcy.
E. It gives a visually appealing S-shaped representation of the
cumulative effect of several risk factors on the probability of
an event.
Results
t-test
Table 2 below presents the average values of all Indices in the Healthy and Bankrupt companies in the sample. The table shows the individual sample t-test statistics and the relative p-values for the two groups. The analysis of the mean profitability indices of the two groups reveals that the bankrupt group had less potential to generate profits before bankruptcy. The t-tests also show a large change in the operating return ratio. In addition, the t-test results indicate that there is no significant variation between the two groups in terms of management organization and human capital ratios.
Table 2: Sample Characteristics.

The p-value (2-tailed) can be used to control for group variation:
a) If the p (2-tailed) value is equal to or less than 0.05, the mean
scores on categorical variables vary significantly between the
two groups.
b) If the p (2-tailed) value is above 0.05, there is no statistically
significant difference between the two groups.
As a result, Table 2 shows that the two groups of companies (Healthy/Bankrupt) differ in 10 indicators: A1 (Return on shareholders fund), A2 (Return on capital employed), A3 (Return on total assets), A4 (Cash flow/turnover), A5 (Profit margin), A6 (EBITDA margin), A7 (EBIT margin), A10 (Stock turnover), A12 (Credit period) and A16 (Solvency ratio).
Model results
Table 3 presents the estimated Logit Model’s fit with cut-off
point 0.5. The Wald test, presented in Table 3 below, which is widely
used to test the importance of each predictor in a Logit model,
shows the top four predictors with the most significant effects
on the dependent variable. The stepwise forward Logit method
selected and retained four predictors from 21 candidate variables/
indices that could be filtered to distinguish healthy from bankrupt
firms, with the significance level set at p-value=0.05. Α4 (Cash
flow/ turnover)
A. Α6 (EBITDA Margin)
B. Α8 (Net asset turnover)
C. Α12 (Credit period)
Table 3: Model Fit Wald-test.

Indices in step 1: Α1, Α2, Α3, Α4, Α5, Α6, Α7, Α8, Α9, Α10, Α11, Α12, Α13, Α14, Α15, Α16, Α17, Α18, Α19, Α20, Α21.
This does not mean that the bankrupt firms differ from the healthier ones only in these four predictors/indices, but that these four indices combined will best differentiate the two groups. The odds ratios for each selected index are represented by the values in the Exp column (B). When the value of the predictor increases by one unit, the odds ratio increases (or decreases if it is less than one unit) the probability of a firm being in an outcome group (healthy/ bankrupt). Four variables/indices from the original set of 21 are selected to achieve the best possible prediction of corporate failure. As a result, the logit model for predicting bankruptcy can be written in logit(y) as follows.

The values in the Exp column represent the odds ratios for each
selected indicator (B). The odds ratio increases (or decreases if it is
less than one) the probability of finding a firm in an outcome group
when the value of the predictive indicator increases by one unit. In
this case, the likelihood ratio of stable firms is distributed as 1, the
cash flow/turnover ratio of bankrupt firms is 2,024 times greater,
and all other predictors are held constant. The 95% confidence
interval (95% CI for Exp (B)) for each likelihood ratio is shown
in the last column, along with a lower and upper bound. The set
of predictors selected by the progressive stepwise method differs
from the independent-sample test set, from which a total of nine
variables are drawn. This does not mean that the bankrupt firms
differ from the healthier firms only in these four predictors. Rather,
it simply implies that these four indicators combined will better
differentiate the two groups. This model uses important financial
indicators in the areas of profitability and operating performance.
Therefore, according to the above, the reasons why SMEs fail are as
follows:
a) Reduction in profit generating capacity.
b) Insufficient labor resources and loss of interest payment
capacity, which contributes to greater financial distress; and
c) The lack of maintaining relationships with customers, as
evidenced by the longer time for a firm’s customer to extend
credit.
Table 4 below illustrates the utility of the model, while the Cox & Snell R Square and Nagelkerke R values reflect the magnitude of the difference in the dependent variable explained by the model; this range of variables explains 37.1% and 53.2% of the uncertainty, respectively. Table 5 below presents the Model’s goodness of fit test. Overall, the significance is less than .05, indicating that the approximate Logit model provides a good fit with the data and that the parameters of the estimated variables are significant. The Hosmer and Lemeshow goodness of fit test presented in Table 6 below, also confirms that the model has a good fit to the data (sig. value is 0.402 in this analysis with an x-squared value of 6.208 with 7 degrees of freedom), indicating that the final fourprediction model fits the results well, so there is no substantial difference between the observed and predicted classification. Table 7 below, presents the Classification Table with cut-off point 0.5, according to which the overall prediction rate is 73.15%, where the prediction rates for bankrupt and healthy firms are 70.3% and 76.0% respectively. Table 8 below presents the Pearson Correlation Table of the predictor variables/indices in the entire sample. There is a moderate correlation between A4(Cash flow/ turnover) and A6 (EBITDA Margin) at 1% significance level. This is explained by the nature of the two indices, as they are both Profitability Ratios and they “serve the same cause”, as if we have high cash flow cycles, it means that the company’s cash periods are moving fast (i.e. they can easily replenish and use cash on a more extensive basis), therefore they are efficient and therefore with high operating profit. Furthermore, it should be noted that coefficient Pearson between A4 (cashflow/turnover) and Α12 (credit period) is -0.100, indicating negative correlation significant at 5% level, which is the only negative correlation that is significant at a 5% level. The following are the main findings of the analysis for each category of firms separately.
Table 4:Model Synopsis.

(1) The estimation was terminated at iteration number 9 because the parameter estimates changed by less than .001.
Table 5: Goodness of Fit Test.

Table 6:Hosmer and Lemeshow Goodness of Fit Test

Table 7: Classification Table.

Table 8:Pearson Correlation Table.

*The correlation is statistically significant at level 0,05 (2-tailed). **The correlation is statistically significant at level 0,01 (2-tailed).
Bankrupt companies
Table 9 below presents the basic sample characteristics for
the sample of 46 bankrupt companies, where the following can be
observed:
A. Regarding the average cash flow cycle, it is at -2.30. This
ratio expresses how quickly the company goes through its cash
cycles in order to put cash to better use. It assesses the company’s
overall cash efficiency. There are more companies that are above
the industry average. This means that just because a company has
high profits but low cash does not always imply that it is in a strong
position. Companies with low cash reserves, on the other hand,
may require short-term financing in the near future to meet their
commitments.
B. The average EBITDA margin is currently at 0.5. This ratio
represents a company’s earnings before taxes and depreciation.
It calculates the gross operating profit as a percentage of sales.
As can be seen, there are slightly more companies that are above
the industry average, but the percentage is still relatively low. This
means that businesses are having problems with sustainability and
cash flow.
C. A company’s strong EBITDA does not always mean that it
is profitable. This is because EBITDA does not have improvements
in working capital, which is usually necessary for business growth.
In addition, it does not take into account the capital investments
used to cover assets on the balance sheet.
D. The average credit period is currently 126.32 days. This
indicates how many days a customer takes to pay an invoice. It
determines how much operating capital a company is willing to
spend on the open balances of its customers in order to generate
revenue. There are more companies that are below the industry
average. This means that businesses are collecting payments
more quickly. The disadvantage of this is that it may indicate
that a company’s credit policies are overly strict, and consumers
may seek out suppliers or service providers with more favorable
payment terms.
Table 9:Basic sample characteristics of Bankrupt Companies.

Healthy companies
Table 10:Basic sample characteristics of Healthy Companies.

Table 10 below presents the basic sample characteristics for
the sample of 46 healthy companies where the following can be
observed:
A. Observing the mean of each independent variable and focusing
primarily on the values obtained, we can conclude that the
mean values are all positive but not very close to zero. When
analyzing companies that are deemed healthy, it makes sense
for this value to be positive or close to zero.
B. The average cash flow cycle is currently 3.78. As previously
stated, this ratio reflects how quickly the company moves
through its cash cycles in order to use cash for better purposes.
It assesses the company’s overall cash efficiency. With a
positive sign, we can see that there are more companies that are
almost evenly divided above and below the industry average.
This means that the majority of businesses have a high cash
turnover, indicating a higher frequency of cash replenishment
through revenue.
C. In terms of average EBITDA margin, it is at 6.43, much higher
than the insolvent companies. As mentioned earlier, this ratio
reflects a company’s earnings before taxes and depreciation
and amortization. It estimates gross operating profit as a
percentage of sales. We note that there are slightly more
companies below the industry average, but still close to the
industry average. This means that companies have profitability
issues as well as cash flow issues. Positive EBITDA suggests
that company earnings are stable but remain relatively low
with most companies below 6.43%. The profitability and cash
flow issues are indicative of low EBITDA margins. This is due to
the fact that EBITDA has no improvements in working capital,
which is usually necessary for business growth. In addition, it
does not take into account capital investments used to cover
assets on the balance sheet.
D. In terms of net turnover of assets, it is at 3.03. As mentioned
earlier, this ratio compares the value of a company’s profits with
the value of its real estate. Net asset turnover is an indicator
of how efficiently a company uses its assets to generate sales.
We can see that there are more companies below the industry
average, but still have a positive sign. This means that most
companies are not effectively using their assets to generate
revenue or that the potential for sales is not being maximized.
On the other hand, companies that are above average have a
surplus of capital compared to their actual needs.
E. In terms of average credit period, it is 75.82, which is
significantly less than that of insolvent companies. As
previously stated, this rate expresses the number of days a
customer must wait before paying an invoice. It establishes
how much operating capital a company is willing to invest in
accounts receivable in order to generate revenue. We notice
that there are more businesses that are below the industry
average. This means that businesses can collect more quickly.
F. A drawback of this is that it may mean that a company’s credit
rules are too strict and consumers may seek suppliers or
service providers with more favorable payment terms. The
striking thing about this is that healthy companies collect
payments faster than insolvent or problematic companies.
Conclusion
At a time when companies are facing increasing difficulties, it is
especially important to develop mechanisms to detect whether or
not a company is on the verge of insolvency. In this context, the goal
of this research was to examine the Greek economy, which has been
in a deep economic slump since 2010. This study estimated a fourvariable
logit model with a cut-off point of 0.5 for predicting Greek
firm insolvency, with a 73% overall predictive ability. According to
the results of the t-test, the bankrupt group of companies (bankrupt
companies) has a lower ability to generate profit before bankruptcy
and there is a significant gap in the operating efficiency index.
According to the findings of this study, the predictors of operational
profitability (profitability ratios: Cashflow/turnover and EBITDA
Margin) and operational efficiency (Net asset turnover and Credit
period) lead to the distinction between healthy and bankrupt
companies, leading to the conclusion that the causes of bankruptcy
in Greece during the study period can be attributed to
a) To the reduction of the profit generating capacity.
b) To insufficient resources and loss of ability to pay interest.
c) The lack of control of relations with customers; and
d) The existence of a relatively slow collection mechanism,
weak credit practices and/or consumers/customers who are not
financially viable due to the recession.
A direct comparison of the findings of the corporate failure studies with each other is, as expected, not effective as they relate to different countries and/or different time periods. The study conducted helps to identify the warning signs of insolvency, as it provides information on the insolvency risk position of each company in Greece for the period 2011-2022. Its application can have significant practical consequences for banks, financial institutions, government action, and financial system regulators. The out-of-sample test is not included in all corporate failure studies (including this one) due to a lack of data from the failing firm. At the academic level, the current study could be expanded by investigating the significance of non-financial indicators, such as key firm characteristics, in predicting bankruptcy (size, age, capital investment and depreciation). It would also be an interesting extension of this study to conduct a similar study of corporate failures in other EU countries over the same time period, incorporating state-level risk indicators to determine the scope of the study.
References
- EC (2019) SBA fact sheet Greece, EC Publications.
- Pearce II JA, Michael SC (2006) Strategies to prevent economic recessions from causing business failure. Business Horizons, 49(3): 201-209.
- Pratten JD (2004) Examining the possible causes of business failure in British public houses. International journal of contemporary hospitality management 16(4): 246-252.
- Chittenden F, Robertson M, Watkins D (1993) Small Firms: Recession and recovery. Paul Chapman Publishing Ltd, London, UK.
- Abdelsamad MH, Kindling AT (1978) Why small businesses fail. SAM Advanced Management Journal 43(2): 24-32.
- Altman EI, Hotchkiss E (2011) Corporate financial distress and bankruptcy: Predict and avoid bankruptcy, analyze and invest in distressed Debt. (3rd edn), John Wiley & Sons, Hoboken, USA.
- Everett J, Watson J (1998) Small business failure and external risk factors. Small business economics 11(4): 371-390.
- Fredland JE, Morris CE (1976) A cross section analysis of small business failure. American Journal of Small Business 1(1): 7-18.
- Cochran AB (1981) Small business mortality rates: A review of the literature. Journal of Small Business Management (pre-1986), 19(4): 50.
- Watson J, Everett JE (1996) Do small businesses have high failure rates: Evidence from Australian retailers. Journal of Small Business Management 34(4): 45-62.
- Bates T (2005) Analysis of young, small firms that have closed: Delineating successful from unsuccessful closures. Journal of Business Venturing 20(3): 343-358.
- Politis D, Gabrielsson J (2009) Entrepreneurs' attitudes towards failure: An experiential learning approach. International Journal of Entrepreneurial Behavior & Research 15(4): 364-383.
- Dimitras AI, Slowinski R, Susamaga R, Zopounidis C (1999) Business failure prediction using rough sets. European Journal of Operational Research 114(2): 262-280.
- Poston KM, Harmon K, Gramlich JD (1994) A test of financial ratios as predictors of turnaround versus failure among financially distressed firms. Journal of Applied Business Research 10(1): 41-56.
- Taffler RJ (1983) The assessment of company solvency and performance using a statistical model. Accounting and Business Research 13(52): 295-308.
- Slatter S (1984) Corporate recovery: Successful turnaround strategies and their implementation. Strategic Management Journal 7(1): 99-100.
- Hunter J, Isachenkova N (2001) Failure risk: A comparative study of UK and Russian firms. Journal of policy modeling 23(5): 511-521.
- Altman EI (1968) Financial ratios, discriminant analysis and the prediction of corporate bankruptcy. Journal of Finance 23(4): 589-610.
- Leksrisakul P, Evans M (2005) A model of corporate bankruptcy in Thailand using multiple discriminant analysis. Journal of Economic & Social Policy 10(1): 95-141.
- Beaver WH (1966) Financial ratios as predictors of failure. Journal of accounting research 4: 71-111.
- Bellovary JL, Giacomino DE, Akers MD (2007) A review of bankruptcy prediction studies: 1930 to present. Journal of Financial Education 33: 1-42.
- Jo H, Han I, Lee H (1997) Bankruptcy prediction using case-based reasoning, neural networks, and discriminant analysis. Expert Systems with Applications 13(2): 97-108.
- Rose P, Kolari J (1985) Early warning systems as a monitoring device for bank condition. Quarterly Journal of Business and Economics 24: 43-60.
- Moses D, Liao S (1987) On developing models for failure prediction. Journal of Commercial Bank Lending, pp. 27-38.
- Benetatos E, Boufounou P (2022) Alternative models for corporate distress predictors during the financial crisis - a study of Greek companies. In: Honorary C Tsoumas (edn), Hellenic Open University Editions, Greece, pp. 90-125
- Messier WF, Hansen JV (1988) Inducing rules for expert system development: An example using default and bankruptcy data. Management Science 34(12): 1403-1415.
- Coats PK, Fant LF (1993) Recognizing financial distress patterns using a neural network tool. Financial management 22(3): 142-155.
- Katsis C, Goletsis Y, Boufounou PV, Stylios G, Koumanakos E (2012) Using ants to detect fraudulent financial statements. Journal of Applied Finance and Banking 2(6): 73-81.
- Ohlson JA (1980) Financial ratios and the probabilistic prediction of bankruptcy. Journal of Accounting Research 18(1): 109-131.
- Zmijewski ME (1984) Methodological issues related to the estimation of financial distress prediction models. Journal of Accounting research 22: 59-82.
- Giannopoulos G, Sigbjornsen S (2019) Prediction of bankruptcy using financial ratios in the Greek market. Theoretical Economics Letters 9: 1114-1128.
- Grammatikos T, Gloubos G (1984) Predicting bankruptcy of industrial firms in Greece. Spoudai 34(3-4): 421-443.
- Theodossiou P (1991) Alternative models for assessing the financial condition of business in Greece. Journal of Business, Finance and Accounting 18(5): 697-720.
- Dimitras AI, Zanakis SH, Zopounidis C (1996) A survey of business failures with an emphasis on prediction methods and Industrial applications. European Journal of Operational Research 90(3): 487-513.
- Zopounidis C, Doumpos M (2002) Multi-Group discrimination using multi-criteria analysis: Illustrations from the field of finance. European Journal of Operational Research 139(2): 371-389.
- Boufounou P, Papadopoulou E (2022) An appraisal of alternative corporate bankruptcy prediction models in Greece. In: Honorary Α Tsamis (edn), Panteion University Editions, Greece.
- Vermeulen EM, Spronk J, van der Wijst N (1996) Analyzing risk and performance using the multi-factor concept. European Journal of Operational Research 93(1): 173-184.
© 2022 Boufounou Paraskevi. This is an open access article distributed under the terms of the Creative Commons Attribution License , which permits unrestricted use, distribution, and build upon your work non-commercially.
Editor In Chief


.jpg)


Signup for Newsletter

Quick Links
 Editorial Board Registrations
 Submit your Article
 Refer a Friend
 Advertise With Us
Our Recent Edition

.jpg)


Top Editors


.jpg)


.bmp)
.jpg)
.png)
.jpg)


.jpg)


.png)

.png)


.png)


Financial Support

Sponsors

Latest e-Books

Latest Video

 a Creative Commons Attribution 4.0 International License. Based on a work at www.crimsonpublishers.com.
Best viewed in
a Creative Commons Attribution 4.0 International License. Based on a work at www.crimsonpublishers.com.
Best viewed in