
- About Us
- Information
-

The Author ensures that the research has been conducted responsibly and ethically with adherence to all relevant regulations. read more..
- For Authors
- For Reviewer
- Manuscript Guidelines
- Membership
- Publication Ethics
-
- Journals
- Reprints
- e-Books
- Videos
- Policies
- Contact Us
 COVID-19
- Submissions


Full Text
Strategies in Accounting and Management
The Motivation for ISO 9000 Certification: A Multivariate Predictive Approach
Maria do Rosário Texeira Fernandes Justino1*, José Figueiredo Almaça2, Joaquín Texeira Quirós2, Marina Godinho Antunes1 and Pedro Ribeiro Mucharreira3
1Lisbon Accounting and Business School-Lisbon Polytechnic, Lisbon, Portugal
2Autonomous University of Lisbon, 1169-023 Lisbon, Portugal
3Institute of Education-University of Lisbon, Lisbon, Portugal
*Corresponding author: Maria do Rosário Texeira Fernandes Justino, Lisbon Accounting and Business School-Lisbon Polytechnic, Lisbon, Portugal
Submission:September 01, 2022Published: September 26, 2022

ISSN:2770-6648Volume3 Issue5
Abstract
Our empirical study compares the responses provided by certified and non-certified companies using multivariate predictive models. Conceptually, there is a subtle difference between comparing questionnaire responses with T-tests and multivariate predictive models. The former should be employed when we conjecture that certification conducts to different responses to the questionnaire; the latter should be used when we believe that the respondent’s perception on the intensity with which quality practices are implemented in their firms is a predictor of certification. That is, rather than asking whether certified companies provide responses that are statistically different from those provided by non-certified companies, we try to understand which of these responses predict, or are associated to the likelihood of the firm being certified. Using a multivariate approach, we identify the set of questionnaire items that are statistically associated to this likelihood, after we control for other items. We consider two types of multivariate models. First, we implement a parametric logistic regression model. Then, because an incorrect specification of the expected value of the dependent variable in the logistic model may lead to incorrect inferences, we also implement a nonparametric decision tree model. It is shown that companies in which the respondent manifests greater concern with respect to the increased competition due to globalization, the motivation of employees, and strategic planning have higher likelihood of being certified. Using a questionnaire answered by a sample of certified companies and a control sample of companies which have not been certified, we show that T-tests and multivariate models provide different insights. According to the T-tests, most responses are significantly different whether they are provided by certified or non-certified companies. On the other hand, the logistic regression model suggests that only three questionnaire items are statistically significant in predicting if a firm is certified or not. The decision tree model indicates that a fourth item also explains the likelihood of certification.
Keywords:Quality; ISO9000; TQM; Logistic regression; Decision tree
Introduction
The Total Quality philosophy has been evolving since its appearance in the early 20th Century as companies feel the need to increase their level of competitiveness in order to secure their continuity. This has been driven by increasingly globalized markets which bring greater challenges into the entrepreneurial environment, and an increasing number of customers demanding high quality products. In today’s globalized markets, where dealings with international customers and suppliers are the norm, it is not enough for companies simply to launch products or services of high quality in the market. They must ensure that these meet standards and requirements that assure clients of their reliability. This sophisticated demand has led to the reflection on the importance of implementing a management system that is entirely quality oriented, i.e., a total quality management system. Customers are now much better informed and are increasingly demanding, and they confirm whether a product of a particular brand is certified so as to ensure its quality [1]. The rate of increase for ISO 9001 and ISO 14001 has been greater compared to previous years with +4% for ISO 9001 and + 12% for ISO 14001 mainly due to an important increase in China. Similarly to the previous editions of the survey, the results show some fluctuations at the country level that are explained by factors related to the participation such as the non-participation of some certification bodies for those specific countries. In the 2020 survey this is the case particularly for ISO 9001 and ISO 14001 for Belgium, Korea, Mexico, Ireland and Philippines and for ISO 28000, China.
In the literature, numerous studies can be found examining the motivations of companies to achieve certification under the ISO9000 standard. A comprehensive study that analyzes the relationship between ISO 9000 certification and organizational performance in the presence and absence of a Total Quality Management (TQM) environment is provided by Terziovski and Samson [2]. The analysis was performed on a sample of 962 industrial companies from Australia and 379 from New Zealand and found that ISO 9000 certification does not have a significantly positive organizational performance on its own. The authors say that the main motivation for companies to have quality certification is the ability of certification to open doors to new customers that would be difficult to achieve without it. According to Tsiotras and Gotzamani [3], there are essentially four main reasons that explain why companies implement a total quality management and cost system: improving the company’s image and reputation abroad, meeting foreign demand and market pressures, facilitating and simplifying procedures and contracts between the company and its customers, and increasing the company’s internal control on existing quality management systems. Jones et al. [4] suggest that companies get certified because they consider themselves obliged to do so. However, companies having a more developed concept of quality obtain more benefits. Terziovski and Smason [5] analyzed the possibility of existing a significant positive relationship between TQM elements and performance, in order to determine the relationship between TQM practices, individually and collectively, and company performance. The authors concluded that three elements of TQM, namely, leadership, customer focus and the focus on human resources had a significant positive effect. Similarly, Sun [6] found that TQM practices such as quality leadership, human resource development, and quality information contributed to an increase in customer satisfaction and business performance. In Gotzamani and Tsiotras [7], the business performance is more influenced by elements like leadership, employee participation and empowerment, and customer’s relations. Abraham et al. [8] suggest that certification provides little guarantee of effective performance outcomes, unless it is accompanied by a change in leadership, communication and structure. In Casadésus and Giménez [9], the ISO 9000 certification process represents an evolution in how a company and quality system should be managed and it is the key to the success of business management. Furthermore, Heras et al. [10] suggest that good quality control is related to competitive advantage. According to Corbett et al. [11], a consistent implementation of quality management systems contributes significantly to better financial performances. Boiral and Amara [12] suggest that the internal and managerial motivation to adopt ISO 9000 often has a positive effect on the likelihood of a certified organization achieving a better-performing effectiveness configuration.
This study contributes to the literature on the internal motivation of companies to achieve certification under the ISO 9000 standard, by performing a comparative analysis of questionnaires answered by a sample of certified companies and a control sample of companies which have not been certified. In particular, we assess how the manager’s perception on the intensity with which quality practices are deployed in their firms is associated to the likelihood of the firm being certified. In the literature, the comparison of questionnaires answered by certified and non-certified companies is typically performed with T-tests, in order to assess if there are statistically significant differences in the responses provided by the two groups [13-15]. In contrast to this conventional approach, our empirical study compares the responses provided by certified and non-certified companies using multivariate predictive models. Conceptually, there is a subtle difference between comparing questionnaire responses with T-tests and multivariate predictive models. The former should be employed when we conjecture that certification conducts to different responses to the questionnaire; the latter should be used when we believe that the respondent’s perception on the intensity with which quality practices are implemented in their firms is a predictor of certification. That is, rather than asking whether certified companies provide responses that are statistically different from those provided by non-certified companies, we try to understand which of these responses predict, or are associated to the likelihood of the firm being certified. Using a multivariate approach, we identify the set of questionnaire items that are statistically associated to this likelihood, after we control for other items. We consider two types of multivariate models. First, we implement a parametric logistic regression model. Then, because an incorrect specification of the expected value of the dependent variable in the logistic model may lead to incorrect inferences, we also implement a nonparametric decision tree model. Using a questionnaire answered by a sample of 172 certified companies and a control sample of 172 companies which have not been certified, we show that T-tests and multivariate models provide different insights. According to the T-tests, most responses are significantly different whether they are provided by certified or non-certified companies. On the other hand, the logistic regression model suggests that only three questionnaire items are statistically significant in predicting if a firm is certified or not. The decision tree model indicates that a fourth item also explains the likelihood of certification. This paper is organized as follows. The next section describes the research questionnaire employed in the empirical study. A preliminary analysis of the data is also presented. Section 3 shows the results given by the two multivariate models: the parametric logistic regression and the nonparametric decision tree. Finally, Section 4 presents some concluding remarks.
Data Description
Population and sample
Our analysis uses data obtained through the IPAC (Portuguese Institute of Accreditation). The initial universe consisted of 1015 certified companies with a quality management system, accredited through NP EN ISO9001, in a region of Portugal (Lisboa e Médio Tejo). Because many of these companies were corporate groups, NPOs, employment services and vocational training companies, the initial sample was reduced to 666 companies. We devised a structured questionnaire in order to assess the respondent’s perception on the intensity with which different quality practices are implemented in the firms. An initial telephone contact was first made to the target companies in order to explain the nature of the research. Then, an introductory letter formalizing the request and the actual research questionnaire were sent by e-mail. In the end, we obtained 172 responses, corresponding to a response rate of 26%. Since the objective of this research is to understand the relationship between questionnaire responses and ISO 9000 certification, we sought for a control sample of 172 non-certified companies willing to answer the questionnaire. While no matching process is perfect, both samples should have reasonably similar characteristics. We matched non-certified companies with their certified counterparts according to activity sector, approximate age and approximate number of employees.
Questionnaire design
The research design determined the inclusion in the
questionnaire of seventeen statements that measure the intensity
of different quality practices. The questionnaire is shown in the
Appendix. The statements aimed to ascertain the respondents’
opinions about the impact of quality elements on the activity and
economic environment of their firms. The seventeen statements
covered different elements of a quality management system:
customers relations (statements 1, 2 and 3); process management
(statements 4 and 5); human resources management (statements
6 and 7); quality costs (statements 8 to 13); strategic planning
(statements 14 and 15); and suppliers relations (statements 16
and 17). The Likert scale was used to measure how the companies
in the survey perceived the questionnaire statements. The level of
agreement or disagreement with the statements was encoded in an
ordinal scale with five categories:
A. Strongly disagree
B. Disagree
C. Neither agree nor disagree
D. Agree
E. Strongly agree
Through the Cronbach’s alpha we assessed the internal consistency of the responses. For research purposes alpha values greater than 0.7 to 0.8 are usually regarded as satisfactory [16]. We obtained a scale reliability coefficient of 0.73 for the questionnaire answered by the sample of ISO 9001 certified companies, and 0.81 for the questionnaire answered by the sample of companies which have not been certified, implying that the measurement scales are consistent and reliable.
Preliminary analysis
In order to understand the relationship between ISO 9001 certification and the respondents’ opinion about the quality elements in the questionnaire, we initiated the analysis by studying the properties of the responses individually. Table 1 presents the sample mean of the responses provided by certified and noncertified firms, the t-statistics for the null hypothesis that the difference between these means is zero, and the corresponding p-values. Table 1 shows that, across all items, the mean responses provided by certified companies are higher than those of their noncertified counterparts. Excluding statement 8 (“The company’s quality costs should be controlled and distinguished from other costs”) and statement 17 (“Innovative products of higher quality should be introduced, relocating industrial products of intensive labor to countries where labor force is cheaper”), there is a statistically significant difference between the responses provided by certified and non-certified companies at 5% significance level. These results show that the awareness towards the quality elements measured by this instrument is greater in the sample of ISO9001 certified companies.
Table 1: Sample mean values of the responses provided by certified and non-certified firms, two sample mean-comparison t-statistics and corresponding p-values. One (two) asterisk(s) indicate that the difference between means is statistically significant at 5% (1%) level.

Table 2 shows the bivariate correlations between questionnaire responses. We can see that several pairs of responses are substantially correlated. For instance, the responses to statement 1 (“As a quality management system is implemented, it is perceived by its customers”) and statement 2 (“It is easier to get your customers’ loyalty by being a company with quality certification”) present a correlation coefficient of 0.47. This value is not unforeseen since both statements measure the respondent’s opinion on customer relationship management. The responses to statement 14 (“Strategic planning is a continuous process that generates the company’s essential objectives. Those objectives should lead to a higher performance culture within the company”) and statement 15 (“Performance assessment and stronger strategic alliances, developing new business areas in main competencies, should be improved”) also present a relatively high correlation of 0.51. These statements focus on the respondent’s opinion on strategic and business planning, so it is natural that respondents more (less) susceptible to this quality element give higher (lower) values on both scales. On the other hand, many pairs of responses seem uncorrelated. For instance, statement 4 (“There is the need to reduce the development period of new products or services”) and statement 8 (“The company’s quality costs should be controlled and distinguished from other costs”) have non-significant correlation (p = 0.83). This is not totally unexpected since statement 4 assesses the respondent perception on the importance of process management, while statement 8 judges the opinion on measurement and control of quality costs. More interestingly, some items measuring the same quality element appear to be uncorrelated. For instance, statement 8 (“The company’s quality costs should be controlled and distinguished from other costs”) and statement 13 (“There may be a failure in the control of quality costs, as they might be miscategorized”) both measure the perception towards quality costs but present a non-significant correlation 0.08 (p = 0.14). This result suggests that, for the firms on our sample, there is a great distance between the determination to control quality costs and the ability to perform it successfully.
Table 2: Correlation matrix of questionnaire responses.

Multivariate Predictive Models
Logistic regression model
The logistic regression finds the equation that best predicts
the value of a nominal variable as a function of a set of explanatory
variables. The goal is to see whether the probability of getting a
particular value of the nominal variable is associated with any
of the explanatory variables. Suppose that x1, x2,..., xn is a set of
variables, β0, β1,..., βn is a set of coefficients, and E [y | x1, x2,..., xn]
is the conditional expected value of the dependent variable y. The
logistic regression equation is
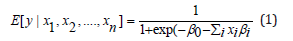
The estimators of the coefficients βi, i = 0,…,n, are obtained by maximization of a log-likelihood function. We performed a logistic regression on a nominal variable, which assumes the value 1 if the company is certified and the value 0 if the company is non-certified, as a function of the questionnaire responses. Table 3 shows the estimated coefficients of the logistic regression, the t-statistics for the null hypothesis that the probability of certification is not associated with a questionnaire response, and the corresponding p-values. The last row gives the likelihood ratio test for the null hypothesis that the coefficients are jointly zero. The p-value of the likelihood ratio statistic indicates that the null is strongly rejected and, therefore, our model fits significantly better than a model with no predictor variables. The sign and significance of the coefficients are instructive for understanding the underlying differences between the sample of ISO 9001 certified companies and the sample of companies which have not been certified. Table 3 indicates that most coefficients are not significantly associated with the probability of certification. In fact, only statements 3, 7 and 14 are significant in explaining the likelihood of a company being certified with 5% significance level. The remaining coefficients are not statistically significant at conventional levels. Statement 3 asks the respondent’s opinion about “Along with market globalization, there was an increase in competitiveness, which resulted in more demanding customers”. This statement assesses the respondent’s perception towards the quality element “customers relations”. The corresponding coefficient is positive, implying that higher values of the responses on the Likert scale are associated with certification. On the other hand, statement 7 (“Greater motivation of the employees provides an increase in commitment and individual responsibility towards the company”) measures the respondent’s awareness with respect to human resources management. Statement 14 evaluates the opinion about “Strategic planning is a continuous process that generates the company’s essential objectives. Those objectives should lead to a higher performance culture within the company”. This question focus on the respondent’s perception towards strategic and business planning. The coefficients for statements 7 and 14 are also positive, implying that higher values of the responses increase the probability of certification. Interestingly, all statements related to the quality elements suppliers relations, process management and quality costs are not significant in explaining the likelihood of certification.
Table 3: Coefficients, t-statistics and p-values of the logistic regression on the questionnaire responses. One (two) asterisk(s) indicate that the difference between means is statistically significant at 5% (1%) level. The last row shows the likelihood ratio significance test and corresponding p-value.

Decision tree model
A crucial assumption in the use of a logistic regression is the correct specification of the expected value of the nominal variable in Equation 1. Using an incorrect functional form for this expectation may lead to a wrong assessment of the statistical relevance of the questionnaire responses. Therefore, it is interesting to understand the relationship between certification and questionnaire responses using a model that does not require a priori the choice of a functional form for the expected value of the nominal variable. This task may be accomplished with nonparametric models, in which the relationship between the variable of interest and explanatory variables is not predetermined by the researcher but is derived from information provided by the data. A popular nonparametric model for predicting nominal variables is the decision tree [17,18]. In this approach, the original data set is recursively partitioned into smaller mutually exclusive subsets, and the models are represented by a sequence of logical if-then-else tests on the attributes of the observations.
Suppose one has a set of observations (i.e., companies) described by a vector of attributes (i.e., questionnaire responses), and that these observations belong to each of two classes (i.e., certified or non-certified). The goal of a decision tree is to separate as well as possible the observations that belong to one class from those that belong to the other through a sequence of binary splits on the data. The algorithm begins with a root node containing all observations. Then, the algorithm loops over all possible binary splits in order to find the attribute and corresponding cut-off value which gives the best separation into one side having mostly observations from one class and the other mostly observations from the other. This procedure is then repeated for the new daughter nodes until no further improvement in class separation is achieved or a stopping criterion is satisfied. Unsplit terminal nodes are referred by the figurative term of leaves and are depicted by rectangles in the schemes representing decision trees. Starting from the root node, all observations are routed down the tree according to the values of the attributes tested in successive nodes and, inevitably, terminate their path in a leaf. In the end, observations are classified according to the most prevalent class in the leaf where they terminated their path. Figure 1 shows the decision tree model for the questionnaire responses. The interpretation of this model is intuitive and straightforward. First, at the root node, the model inquiries about the response to statement 14. If the response to this statement on the Likert scale is smaller or equal to 3, then the model predicts that the company is not certified and the branch ends there. If the opposite occurs, the model then focuses on the response to statement 7. If the answer to this statement is smaller or equal to 3, the model again predicts that the company is not certified. If the contrary occurs, the model then inquiries about the response to statement 3. If the response to statement 3 is greater than 4, the model predicts that the company is certified. If the response to this statement is smaller or equal to 4, the model finally inquiries about the response to statement 12. If the response to this statement is smaller or equal to 3, the model predicts that the company is noncertified, otherwise it predicts that the company is certified. This tree structure allows us to draw the following conclusions. First, small values of the response to statement 14 are associated to non-certified companies, since the branch st14 ≤ 3 leads to a “noncertified” leaf. For the same reason, small values of the response to statement 7 are also associated to non-certified companies. Large (small) values of the responses to statements 3 and 12 are associated to (non-)certified companies, since conditions st3 > 4 and st12 > 3, respectively, lead to “certified” leaves. The remaining questions are not relevant since they are not present in the tree structure. The tree model corroborates the findings of the logistic regression, in which only statements 3, 7 and 14 were significantly associated to the probability of certification. Furthermore, in agreement with the logistic regression, the tree model suggests that higher values on the Likert scale of these responses to the statements are associated to certification [19-21]. However, the tree model also suggests that higher values of responses to statement 12 are associated to certification, while this question is not statistically significant in the logistic regression model at conventional significance levels (p = 0.343). This question asks the respondent’s opinion on “Administrators actually know how much the company may lose by lack of quality”, which evaluates the perception towards the element “quality costs”.
Figure 1: Decision tree model for questionnaire responses.

Conclusion
This paper presented an analysis of the responses to a questionnaire answered by a sample of ISO9001 certified companies and a control sample of companies which have not been certified, using multivariate predictive models. With this approach, we assessed which quality practices are associated to the likelihood of companies being certified. The parametric logistic regression model showed that the respondent’s opinion on three questionnaire items are significantly associated to the likelihood of certification. In particular, companies in which the respondent manifests greater awareness towards the greater competitiveness due to market globalization, the motivation of employees and strategic planning had higher likelihood of being certified. Interestingly, all statements related to quality elements such as suppliers relations, process management and quality costs were not significant in explaining the likelihood of certification. The results given by the logistic regression model were corroborated by a nonparametric decision model. However, the decision tree model further suggested that the respondent’s opinion on the administrators’ awareness about losses due to lack of quality may predict the probability of certification.
The reader should note that this study is based on data from a single country and of course, these results capture many idiosyncrasies of its economic and corporate environment. It would be interesting to understand if this type of analysis reveals some regularities across different countries.
Originality/Value
This study contributes to the literature on the internal motivation of companies to achieve certification under the ISO 9000 standard, by performing a comparative analysis of questionnaires answered by a sample of certified companies and a control sample of companies which have not been certified. In particular, we assess how the manager’s perception on the intensity in which quality practices are deployed in their firms is associated to the likelihood of the firm being certified.
Acknowledgment
The authors acknowledge the financial support of the Autonomous University of Lisbon.
References
- Texeira Quirós J, Justino MR (2013) A comparative analysis between certified and non-certified companies through the quality management system. International Journal of Quality & Reliability Management 30(9): 958-969.
- Terziovski M, Samson D (1997) The business value of quality management systems certification: Evidence from Australia and New Zealand. Journal of Operations Management 15(1): 1-18.
- Tsiotras G, Gotzamani K (1996) ISO 9000 as an entry key to TQM: The case of Greek industry. International Journal of Quality 13(4): 64-76.
- Jones R, Arndt G, Kustin R (1997) ISO 9000 among Australian companies: impact of time and reasons for seeking certification on perceptions of benefits received. International Journal of Quality & Reliability Management 14(7): 650-660.
- Terziovski M, Samson D (1999) The link between total quality management practice and organizational performance. International Journal of Quality & Reliability Management 16(3): 226-237.
- Sun H (1999) Diffusion and contribution of total quality management: An empirical study in Norway. Total Quality Management 10(6): 901-914.
- Gotzamani KD, Tsiotras GD (2002) The true motives behind ISO 9000 certification. Their effect on overall certification benefits and their long-term contribution towards TQM. International Journal of Quality & Reliability Management 19(2): 151-169.
- Abraham M, Crawford J, Carter D, Mazotta F (2000) Management decisions for effective ISO 9000 accreditation. Management Decision 38(3): 182-193.
- Casadésus M, Giménez G (2000) The benefits of the implementation of the ISO9000 standard: Empirical research in 288 Spanish companies. The TQM Magazine 12(6): 432-441.
- Heras I, Casadésus M, Garvin PM (2002) ISO 9000 Certification and the bottom line: A comparative study of the profitability of Basque region companies. Managerial Auditing Journal 17(1/2): 72-78.
- Corbett C, Montes-Sancho MJ, Kirsch DA (2005) The financial impact of ISO9000 certification in the United States: An empirical analysis. Management Sciences 51(7): 1046-1059.
- Boiral O, Amara N (2009) Paradoxes of ISO9000 performance: A configurational approach. Quality Management Journal 16(3): 37-60.
- Lima MAM, Marcelo Resende M, Hasenclevr L (2000) Quality certification and performance of Brazilian firms: An empirical study. International Journal of Production Economics 66(2): 143-147.
- Gotzamani KD, Tsiotras GD (2001) An empirical study of the ISO9000 standards' contribution towards total quality management. International Journal of Operations & Production Management 21(10): 1326-1342.
- Martinez-Costa M, Martinez-Lorente AR, Choi TY (2008) Simultaneous consideration of TQM and ISO 9000 on performance and motivation: An empirical study of Spanish companies. International Journal of Production Economics 113(1): 23-39.
- Bland JM, Altman DG (1997) Statistics notes: Cronbach's alpha. BMJ 314(7080): 572.
- Breiman L, Friedman JH, Olshen RA, Stone CJ (1984) Classification and regression trees. Wadworth International Group, Belmont, California, USA.
- Quinlan JR (1986) Induction of decision trees. Machine Learning 1(1): 81-106.
- Erel E, Ghosh GB (1997) ISO9000 implementation in Turkish industry. International Journal of Operations & Production Management 17(12): 1233-1246.
- Texeira Quirós J, Almaça J, Justino MR (2010) How quality affects the bottom line?: A literature review. Intangible Capital 6(2): 258-271.
- Witten IH, Frank E (2005) Data mining: practical machine learning tools and techniques. Morgan Kaufmann Publishers, USA.
© 2022 Maria do Rosário Texeira Fernandes Justino. This is an open access article distributed under the terms of the Creative Commons Attribution License , which permits unrestricted use, distribution, and build upon your work non-commercially.
Editor In Chief


.jpg)


Signup for Newsletter

Quick Links
 Editorial Board Registrations
 Submit your Article
 Refer a Friend
 Advertise With Us
Our Recent Edition

.jpg)


Top Editors


.jpg)


.bmp)
.jpg)
.png)
.jpg)


.jpg)


.png)

.png)


.png)


Financial Support

Sponsors

Latest e-Books

Latest Video

 a Creative Commons Attribution 4.0 International License. Based on a work at www.crimsonpublishers.com.
Best viewed in
a Creative Commons Attribution 4.0 International License. Based on a work at www.crimsonpublishers.com.
Best viewed in