
- About Us
- Information
-

The Author ensures that the research has been conducted responsibly and ethically with adherence to all relevant regulations. read more..
- For Authors
- For Reviewer
- Manuscript Guidelines
- Membership
- Publication Ethics
-
- Journals
- Reprints
- e-Books
- Videos
- Policies
- Contact Us
 COVID-19
- Submissions


Full Text
Strategies in Accounting and Management
Alternative Methods for Assessing Financial Motives for Asset Revaluation Using IAS: Empirical Results from Greek Firms During the Financial Crisis
Toudas Kanellos1*, Papasoteriou Spyridon2 and Boufounou Paraskevi2
1Department of Agribusiness and Supply Chain Management, Agricultural University of Athens, Greece
2Department of Economics, National and Kapodistrian University of Athens, Greece
*Corresponding author: Toudas Kanellos, Department of Agribusiness and Supply Chain Management, Agricultural University of Athens, Greece
Submission:July 28, 2022Published: August 09, 2022

ISSN:2770-6648Volume3 Issue4
Abstract
This study focuses on IAS 16, IAS 36, and IAS 38. IAS 16 outlines the recording of the book value of tangible fixed assets (plant, property, and equipment). The purpose of this paper is to determine whether a company’s ability to revalue its tangible (land, plant and equipment) or intangible (goodwill) assets in accordance with IAS 16 and IAS 38, in order to reflect their book value as closely as possible to their market value, is influenced by a variety of economic factors, such as the size, the intensity of use of these assets, leverage, liquidity, profitability, and current market value of a company. To achieve this, a sample of 125 Greek firms from 2014 to 2017 was used to examine the relationship between the decision to revalue fixed tangible or intangible assets and a number of financial variables, including size, fixed assets intensity, leverage, profitability and market value. As no sample company revalued intangible assets, this question is unanswerable. Additionally, few businesses reassessed their tangible assets. Logistic, Probit and OLS models were used to compare and evaluate the evidence provided. The outcomes demonstrated that there is no financial variable that influences the decision to revalue tangible assets. This result contradicts the majority of previous research in this field, but it is hardly surprising. This result is primarily attributable to the economic crisis that Greek firms are experiencing, as they have few incentives to reevaluate their tangible or intangible fixed assets in relation to their financial situation because the benefits are not so substantial.
Keywords:Fixed assets; Asset revaluation; Financial crisis
Introduction
The application of IAS 16 and 38, as well as IAS 36, has been made mandatory for all companies, regardless of size, that are listed on the Athens Stock Exchange. It became mandatory in 2005 and since then, it has been consistently implemented by all businesses. The application of these standards has altered the creditworthiness of a number of companies in the sector, which were making much smaller provisions for credit losses than required by IAS 16 and 38 and IAS 36. As a result, new adjustments have been made to their profits for each fiscal year applied. In many companies, this change in profits was also retroactively applied to previous years. The presentation of financial statements in accordance with IAS 16, 38 and 36 resulted in substantial variations in the Profit and Loss and Equity as well as the balance sheets of these companies. Both IAS 16 and IAS 38 emphasize the correct presentation of the company’s profitability from a financial perspective, adhering to accounting principles.
The application of IAS 16 and 38, as well as IAS 36, makes it possible to compare the figures of all balance sheet accounts between Greek and foreign companies in order to make decisions. According to the new laws, all countries must be harmonized on the basis of uniform accounting standards, but this creates a new situation for capital markets and investors, as comparisons become easier and more accessible for all in a market where financial and investment activities are borderless. Comparability is a major pressure factor in maintaining a sound and transparent financial structure and profitability, so this obviously creates new data and requirements for individual companies as well. The application of these IAS is especially crucial for the European Union, which recognizes that the comparability, transparency, and dependability of financial information is a fundamental requirement for a unified capital market.
The IAS are presented as the most applicable and acceptable accounting standards, which will enable listed companies to raise capital from international capital markets and will lend credibility and international comparability to published financial statements. The mandatory application of IAS 16 and 38 and IAS 36 by companies whose shares are traded on stock exchanges contributes to the development of a pan-European stock market with greater depth, liquidity and investor protection. Since their implementation began in 2005, these IAS have an impact on the dividend policy of companies and, by extension, the company values (valuation) of all European listed companies. Moreover, it is crucial to enable comparisons between Greek companies’ financial statements and those of foreign companies whose shares are traded on foreign stock exchanges. This makes possible the process of listing and trading Greek shares of listed companies on international capital markets. In addition, the IAS will be the strongest passport for the access of Greek companies, naturally the healthiest ones, to the European capital markets, as balance sheets based on the IAS are a fundamental requirement for them to be able to obtain a rating from the competent audit firms. Given that the Greek stock market, despite being among the mature markets, is still on the sidelines, many Greek listed companies still have opportunities on the international capital markets [1]. Companies that adhere to the IAS will benefit, as will those with substantial investments in fixed assets, which will be required to disclose the “hidden values” underlying their depreciable fixed assets. However, in order to confirm such an estimate (which would increase the value of depreciated property and equipment), objective methods of calculating the current value of the property and indicatorsof changes in property values would be required, as these companies would turn to certified real estate appraisers or other actuaries to bring the property and equipment to fair market value. Conversely, companies with equity portfolios that have sustained significant losses and companies with large portfolios of post-dated and other securities that remain real estate for an extended period will not have accurate balance sheets. The objective of the IAS is, among other things, to more accurately reflect the true value of claims held by listed companies against third parties. Especially in Greece, the repayment period for checks is significantly longer than the average for the European Union, which suggests a number of issues for companies that continue to hold securities with excessively long maturity dates.
IAS 16 and 38 promise to impose order on balance sheets by limiting company notes and auditors’ comments, which today, by their number and often by their seriousness, upset the balance sheet picture. Multinationalism and the tendency of companies to embellish their financial situation have resulted in company balance sheets often showing notes that have no consequence for the company instead of forecasts that affect their results. At the same time, the auditors’ observations, even if they identify irregularities or contradictions with the law, have no consequences for companies, since they are not taken into account either by investors or by the Ministry of Development, which rarely does not accept a balance sheet. With the application of these IAS, there will be significantly fewer notes, since there will be no ‘room’ for different interpretations and additional notes. These notes will be of a purely explanatory nature, specific and. With the IASs examined, company balance sheets will reflect in a quantified way the true financial position of companies. It will be clear that the norm is the Accounting Standards and not the tax law or any other provision. A further benefit of using International Accounting Standards is the enhancement of the audit of companies and thus the role of auditors, as well as the strengthening of their independence from the companies they audit. Auditing is a fundamental need of the global economy. It is not a routine process, but a complex task requiring a comprehensive understanding of the business environment and sound judgment on the appropriateness of the accounting principles chosen. International Accounting Standards do not favor accounting errors, omissions, fraud. They therefore help to prevent such unfortunate cases and to create a favorable climate of confidence of the investing public in the reports prepared by auditors.
Thus, the mandatory application of the euro to the valuations
of euro-area companies, the adoption of International Accounting
Standards in all 15 Member States, and the publication of their
financial results on a pan-European website will permit conclusions
to be drawn for each company individually, in particular with
respect to:
A. Its financial efficiency
B. Its competitiveness in the market in which it operates
C. The degree of creditworthiness and solvency
D. Its growth prospects within the industry
E. The impact of the company’s financial efficiency and
effectiveness on its share price performance.
Although it is widely acknowledged that the IASs are clearly superior to the Greek Accounting Standards on a number of criteria, their implementation has been accompanied by a number of issues, such as a lack of sufficient guidance, insufficiently qualified accountants and auditors, a lack of uniformity in application, and a significant amount of room for creative accounting. In addition, the institutional and legislative environment for the implementation of IAS has not been fully harmonized. Specifically, the tax rules for the application of IAS lack completeness and simplicity and leave the tax authorities with room for doubt. Specifically, the need to modernize the Greek Accounting Standards for unlisted companies in order to eliminate unjustified differences with IAS is emphasized. It is believed that the concurrent use of two significantly different accounting models creates conditions for unfair competition between businesses.
Literature Review
Numerous past studies have attempted to address this issue. Specifically, Iatridis and Kilirgiotis [2] investigated whether the revaluation of fixed assets depends on factors such as the size and intensity of fixed assets relative to total assets. They discovered that size influences revaluation potential positively. Thus, larger companies are more likely to revalue their assets. Additionally, they discovered that asset intensity is negatively related to the likelihood of asset revaluation. In other words, businesses with a smaller proportion of fixed assets in their assets are more likely to engage in such revaluations. In a recent study, Nijam [3] examined a variety of factors that may influence the likelihood of asset revaluation in various manufacturing and production firms. In addition, he investigated variables including size, the proportion of fixed assets to total assets, financial leverage, and profitability. Only leverage was found to be positively associated with the likelihood of revaluation, suggesting that companies with greater leverage are more likely to revalue their assets. According to Nijam [3], the absence of any other factor influencing the possibility of revaluation is contrary to theory and the findings of similar earlier studies. In a second recent study, Surgawi and Solikhah [4] investigated whether the potential for revaluation is contingent on various financial and non-financial factors. The companies included in this study belonged to diverse industries (construction, real estate, utilities, transportation, etc.). They investigated, among other things, whether financial factors such as company size, asset concentration in the total balance sheet, leverage, liquidity, and value influence the likelihood of asset revaluation. They discovered that none of these financial factors influence the likelihood of an asset revaluation occurring. However, it is worth mentioning that size has been found to have a positive effect on the possibility of asset revaluation, as shown in studies by Jung et al. [5], Tabari & Adi [6] and Hidayat & Hati [7], while no relevant effect has been found in studies by Ballas et al. [8] and Sudrajat et al. [9]. The intensity of tangible fixed assets in total assets has been found to have a positive effect on the decision to revalue fixed assets, according to studies by Choi et al. [10], Sudrajat et al. [9] and Tabari & Adi [6]. However, it has even been found to have a negative effect, according to studies by Aziz & Yuyetta [11] and Rahman [12]. Leverage has been found to have a positive effect in several similar studies, among them, by Cheng & Lin [13], Choi et al. [10], Sudrajat et al. [9] and Tabari & Adi [6]. In contrast, no relevant effect was found in the studies of Rahman [12] and Seng & Su [14]. Liquidity has been found to have a negative effect in some past studies such as those of Barac & Sodan [15], Lin & Peasnell [16] and Manihuruk & Farahmita [17]. In contrast, zero effect was found in the studies of Latifa & Haridhi [18] and Tay [19]. Efficiency is positively associated with the possibility of revaluing fixed assets, according to Barać & Šodan [15] and Barlev et al. [20] on the grounds that the most efficient firms have the possibility to revalue their fixed assets even though they then show slightly lower efficiency. In contrast, Choi et al. [10] argue that asset revaluation is negatively associated with profitability on the logic that less efficient firms resort to asset revaluation in order to embellish their asset picture and thus appear more attractive to raise debt capital. The current value of the company, as reflected in the stock market, has not been examined whether it may affect the possibility of an asset revaluation in too many studies, with one exception of Baek & Lee [21], Martini & Kurniawati [22] and Surgawi & Solikhah [4]. In this research, this financial factor is also to be investigated whether it may be related to the possibility of an asset revaluation. While all the above researches focused on revaluation on tangible assets (IAS 16), this study is going to examine the effect of all these factors on intangible assets (IAS 38) as well.
Methodology
Development of econometric model
Using the probability of a revaluation in intangible fixed
assets as the dependent variable and the indicators that measure
a company’s size, the intensity of intangible fixed assets, leverage,
liquidity, profitability and stock market value as the explanatory
variables, the following regressions are specified:
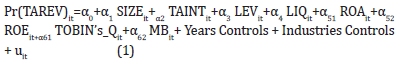
Pr (IAREV)it = probability that company i will revalue intangible assets in year t
SIZEit = size of company i in year t measured as a logarithm of assets
TAINTit = intensity of company i’s tangible assets in year t measured as the ratio of tangible asset value to total assets
IAINTit = intensity of intangible assets of company i in year t measured as the ratio of the value of intangible assets to total assets
LEVit = leverage of company i in year t measured as the ratio of total liabilities to equity
LIQit = liquidity of company i in year t measured as the ratio of total current assets to total current liabilities
ROAit = return on assets of company i in year t measured as the ratio of net profit to total assets
ROEit = return on equity of company i in year t measured as the ratio of net profit to total equity
TOBIN’s_Qit = market capitalization ratio of company i in year t measured as the ratio of market capitalisation + debt to total assets
MBit = market capitalisation ratio of company i in year t measured as the ratio of market capitalisation to total equity
Years Controls = dummy variables that take into account any year effect, where they take the value 1 for some year and 0 otherwise, taking one year as a benchmark
Industries Controls = dummy variables taking into account any industry effect, where they take the value 1 for an industry and 0 otherwise, taking an industry as the basis of comparison uit, εit = random errors of econometric models
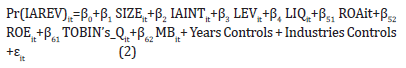
Empirically, the dependent variable in each regression is measured as a dummy variable based on the following definitions:
TAREVit = 1 if firm i has revalued tangible assets in year t, 0 otherwise
IAREVit = 1 if company i has revalued intangible assets in year t, 0 otherwise
The dependent variables are measured qualitatively by examining the notes to the accounts of tangible and intangible fixed assets, which indicate whether the change in the accounts is due to depreciation, additions due to purchases, reductions due to sales/dispositions, or revaluation. Therefore, based on the detailed definitions of the dependent variables, the following regressions are to be estimated:
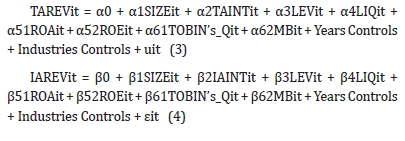
Regressions (3) and (4) are linear probability models, as the dependent variable is dichotomous and its estimation has the probability interpretation. However, estimating these regressions with the classical Ordinary Least Squares (OLS) method has two main disadvantages [8]. One is that such models have inherent heteroskedasticity. The second and most important is that it does not ensure that the dependent variable will be estimated in the interval [0,1] where a probability takes values. Consequently, explanatory issues arise. For the above reasons, we will estimate the nonlinear regression using the Logit method or Logistic Regression, which specifies the dependent based on the Logistic function, which ensures that its estimates will be in the interval [0,1]. The relevant specification is as follows:
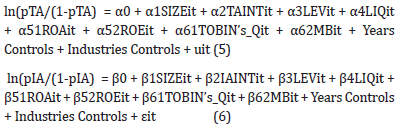
pTA = Pr (TAREV)it = probability that company i will revalue tangible assets in year tpIA = Pr (IAREV)it = probability that company i will revalue intangible assets in year t
The linear relationship, then, is specified between the logarithm of the odds ratio and the explanatory variables. The solution in terms of the odds ratio is as follows:
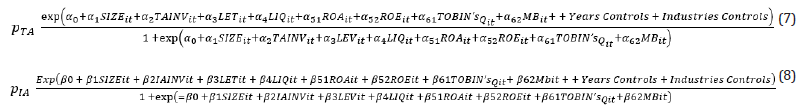
The parameters α0, α1, …., β0, β1 etc. in regressions (5), (6) will be estimated by applying the maximum likelihood method which is an appropriate estimation method for such a specification, assuming Bernoulli distribution and parameters pTA, pIA within which the estimated parameters α0, α1, …, β0, β1 etc under consideration lie. Another way to estimate regressions (3), (4) considering that the estimate of the dependent must take values in the interval [0,1], is the Probit method which is based on the probability density function of a standard normal distribution [8]. The relevant specification is as follows:
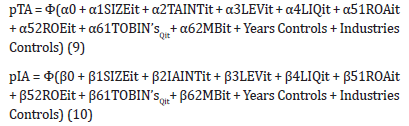
The estimates of the non-linear regressions (9) and (10) are carried out using the maximum likelihood method, where the parameters α0, α1, …, β0, β1 etc to be estimated are found in the likelihood function. For confirmation purposes, therefore, the original regressions (3) and (4) will be estimated using both Logistic Regression (Logit) and Probit regression.
Sample
The estimation of regressions (3) and (4) was based on a sample of Greek companies on the Athens Stock Exchange (ASE) for the period 2014-2017. Specifically, available data were obtained for 125 companies, resulting in a final sample of 500 firm-year observations, whose characteristics are presented in Table 1 below. The sample firms have an average size of just over 546 million euros, with a wide range of sizes as indicated by the standard deviation and the range of values. The asymmetry is positive and extremely high, and the kurtosis is also extremely high. This indicates that there is an excessive concentration of observations with medium sizes, as well as a small number of firms with excessively large sizes. The average size of tangible fixed assets is just over 263 million Euros, with extremely high volatility, positive asymmetry, and elevated kurtosis. It appears that tangible fixed assets account for nearly half of a company’s total assets. The average size of intangible assets is just around 18 million Euros, with extremely high volatility, positive asymmetry, and extremely high kurtosis. It appears that intangible assets do not account for a substantial portion of the total assets. As demonstrated by the standard deviation and the range of values, tangible fixed assets account for approximately 40 percent of total assets with a high degree of relative volatility. The asymmetry is negligible and the kurtosis is negative, indicating that the distribution of the tangible asset intensity is nearly symmetrical with a low middle value concentration. The intensity of tangible fixed assets demonstrates that tangible fixed assets comprise a substantial portion of the assets of Greek companies. The standard deviation and the range of values indicate that the intensity of intangible assets is highly volatile, averaging around 3.89 percent. The asymmetries are positive and extremely robust, and the kurtosis is high. This indicates that the distribution of the intensity of the ayllos is highly concentrated in a small range of values, with a few companies exhibiting excessively high values. The relatively low intensity of intangible assets indicates that Greek companies in the sample do not rely heavily on intangible assets because they do not constitute a substantial portion of their assets.
Table 1: Sample characteristics.

The intensity of tangible fixed assets is around 40% of total assets with a high relative volatility, as shown by the standard deviation and the range of values. The asymmetry is very low and the kurtosis is negative, which means that the tangible asset intensity is almost symmetrically distributed with a low concentration in the middle values. The intensity of tangible fixed assets shows that tangible fixed assets indeed constitute an important part of the assets of Greek companies. The intensity of intangible assets is around 3.89% on average with a high volatility, as shown by the standard deviation and the range of values. The asymmetry is positive and very strong and the kurtosis is high. This means that the distribution of the intensity of the alloys shows a high concentration in a small range of values with some excessively high values for a few companies. The relatively low intensity of intangible assets indicates that the Greek companies in the sample do not use intangible assets very strongly as they are not a significant part of their assets. The average leverage (debt to equity) is approximately 2.10, indicating that companies tend to use EUR 2 of debt for every EUR 1 of equity. However, the volatility is extremely high. The range indicates that the sample ratio can take on negative values. This is due to the fact that there are also businesses that have experienced negative equity for a number of years due to their poor financial performance in recent years. This would indicate the exclusion of these cases, as this indicator has no explanatory power for them. However, this would result in the loss of a substantial number of observations. For this reason, in this study, leverage will be measured as the ratio of total liabilities to total assets, where the ratio of total assets to total liabilities indicates leverage. Leverage, measured as the ratio of debt to total capital is 73% on average with a high relative volatility as indicated by the standard deviation and range of values. The asymmetry is strongly positive and the kurtosis is high, meaning that the distribution of leverage ratios shows a high concentration of values in a small range and a few observations with strongly high leverage. However, in each case the leverage is, in general, at a high level. Liquidity is on average 1.71, indicating that there is no tendency for Greek companies to be illiquid. Volatility is quite high with strong positive asymmetry and high kurtosis. Therefore, the liquidity distribution shows a high concentration in a small range of values with a few companies with excess liquidity.
Return on assets (ROA) is on average negative, although not very strongly negative. Volatility is very high with positive asymmetry and high kurtosis, meaning that the distribution of returns is concentrated in a small range of values with a few very high performing companies. Similar results are obtained for return on equity (ROE), which is simply somewhat more strongly negative, which is to be expected as equity is smaller than total equity. However, as there are cases of negative equity, this ROE is not meaningful in these cases. This is why profitability will, in the end, only be measured by return on assets (ROA), otherwise observations would have to be excluded and valuable information would be lost.
Tobin’s Q ratio was obtained at an average of 0.70, indicating market valuation of companies below book value of assets. Volatility is relatively high, while asymmetry is strongly positive and kurtosis is high. This implies that the distribution of index values is concentrated in a small price range and with a few companies with excessively high index values. Similar results are obtained for the Market-To-Book (MB) ratio. However, in cases where there are negative values of book equity, the ratio has no explanatory power. In order not to exclude these observations, the value of the company will ultimately be measured only by the Tobin’s Q index, as shown in Table 2 below. Only 40 cases in the sample were found where companies had made an adjustment to tangible assets (8.0%), while in no case was an adjustment to intangible assets found.
Table 2: Companies with adjustment to fixed assets.

Development of research cases
From the brief listing of various past studies and their results,
the following research hypotheses emerge concerning how each
factor is estimated to affect the probability of revaluation of fixed
assets. In the majority of studies, asset value or its corresponding
logarithm has been found to positively influence the likelihood of
a company resorting to an asset revaluation, as larger companies
with a larger volume of tangible assets are more likely to need to
revalue them during a given year. In fact, large corporations are
more likely to experience greater pressure to increase asset values,
resulting in higher depreciation, lower pre-tax income, and lower
tax payments, as well as greater pressure to disclose and publish
book values that are closer to current values. The likelihood of
having to revalue an organization’s intangible assets is believed
to be proportional to the size of its intangible assets. As a result,
the likelihood of having to revalue a company’s intangible assets
also varies proportionally with its size. Based on the preceding and
the majority of previous research findings, the following research
hypothesis emerges:
Η1: Size positively affects the probability of revaluation of
intangible assets
The intensity of tangible assets in total assets, measured as the ratio of the value of tangible assets to total assets, has been found in most studies to positively affect the likelihood of a company to resort to an asset revaluation on the grounds that when tangible assets are an important part of a company’s balance sheet, when they are revalued only then a significant goodwill arises that confers a correspondingly significant benefit and thus increases the incentive for a company to take such an action. Also, companies with high tangible fixed assets have more incentive to resort to their revaluation because they also substantially increase their borrowing capacity or avoid any clauses in their existing loan agreements. Exactly the same logic is expected to apply to intangible assets, where only when their value, in relation to their total balance sheet, is significant, is there a strong incentive for a company to resort to a revaluation (Table 3). Based on the above and also based on most of the findings of past research, the following research hypothesis emerges:
Table 3:Correlation coefficients between the explanatory variables for finding multilinearity.

Η2: The intensity of intangible fixed assets in relation to total assets has a positive effect on the probability of revaluation of intangible fixed assets
Leverage, measured as total liabilities divided by equity,
has been found in most studies to have a positive effect on the
probability that a company will resort to an asset revaluation, on
the grounds that in highly leveraged companies there is a greater
probability that debt covenants exist which, with an appropriate
asset revaluation, need not be triggered. Similarly, in companies
with a high leverage ratio there is more need to revalue assets in
order to increase the value of equity and reduce the ratio so as to
increase their borrowing capacity in case they need to raise more
debt in the future. Exactly the same logic is thought to apply to
intangible assets, where highly leveraged companies are more likely
to look to take advantage of opportunities to revalue these assets as
well. Based on the above and on the basis of most of the findings of
past research, the following research hypothesis emerges:
Η3: Leverage positively affects the probability of revaluation of
intangible assets
Liquidity, measured as total current assets to total current
liabilities, has been found in most studies to negatively affect
the likelihood of a company to resort to asset revaluation on the
grounds that in companies with low liquidity there is a greater
likelihood that they will need short-term debt financing and
therefore need to show a better picture of their assets, which can
be achieved by revaluing their fixed assets. Similarly, in companies
with a low liquidity ratio there is more need to revalue assets so
as to show a better financial picture and reduce the credit risk
that is looming and also to avoid triggering any clauses that exist
under current loan agreements. Exactly the same logic is thought to
apply to intangible assets, where companies with low liquidity are
more likely to look to take advantage of opportunities to revalue
these assets as well. Based on the above and on the basis of most
of the findings of past research, the following research hypothesis
emerges:
Η4: Liquidity negatively affects the probability of revaluation of
intangible fixed assets
Profitability, measured by the classical Return on Assets (ROA)
and Return On Equity (ROE) ratios, has been found in most studies
to positively affect the probability of a company to resort to asset
revaluation, in the sense that companies with high profitability have
the ability to resort to asset revaluations if they have to, even if their
future profitability decreases somewhat because the value of total
and equity capital increases. In a way, if they are highly efficient
companies they do not need to show even higher efficiencies and
are therefore more likely to resort to asset revaluation practices.
Exactly the same logic is thought to apply to intangible assets,
where highly efficient companies are more likely to have no issue
with revaluing these assets as well. Based on the above and on the
basis of most of the findings of past research, the following research
hypothesis emerges:
Η5: Efficiency positively affects the probability of revaluation of
intangible assets
In a few studies that have been examined, the value of a
company, as measured by Tobin’s Q, has been found to negatively
affect the likelihood of a company resorting to asset revaluation,
on the grounds that companies with a low stock market valuation
are more likely to resort to asset revaluations in order to increase
the value published on their balance sheets, thus providing
shareholders with information that their value is higher, which is
expected to be reflected in the stock market. Furthermore, asset
revaluation will be associated with increased borrowing capacity,
which may increase the value of borrowed capital, resulting in a
low Tobin’s’ Q ratio in the future. The market-to-book MB ratio,
which will also be used in this study to measure a company’s value,
is a similar indicator of company value. Companies with a low MB
ratio are expected to have a greater need for revaluation in order
to persuade shareholders that the company’s value is greater than
it appears. The same logic is expected to apply to intangible assets,
with companies with low values more likely to seek revaluation opportunities in these assets as well. Based on the foregoing and
the majority of previous research findings, the following research
hypothesis emerges:
Η6: Market value negatively affects the probability of
revaluation of intangible fixed assets
Results
Econometric valuation for linking asset revaluation to financial factors
Because no revaluation of intangible assets was discovered, the regression estimating the probability that a company will revalue its intangible assets could not be carried out. To be carried out, the dependent variable, which takes the values 0 and 1, must have taken both of these values in the sample and thus be a variable rather than a constant. Therefore, only the regression (3) linking the probability of revaluation in tangible assets to financial factors is estimated. It should be noted that there is no case of severe high partial multicollinearity, as the correlations between the explanatory variables were found to be very low. Therefore, the statistical tests for the coefficients are reliably carried out. Logistic Regression and Probit methods were applied, and the simple OLS method was also used for comparison purposes. The results are presented immediately below. The Logistic Regression model [1] was estimated using standard errors that were adjusted for heteroskedasticity (Huber-White Robust Standard Errors). According to the Pseudo-R2 coefficient, there is very low explanatory power, with only 2.30 percent of the variability in the probability of a company undertaking an asset revaluation explained by financial factors, industry, and year. Indeed, even at the 10% level (p > 0.10), the null hypothesis for an insignificant model is not rejected by the LR statistic. This means that the model is insignificant because no factor has a statistically significant effect on the relative probability. Tests using the Z statistic to determine the significance of each individual coefficient revealed that none of the coefficients are statistically significant even at the 10% level (p > 0.10), confirming that no financial factor influences a company’s likelihood of undertaking a material asset revaluation. The constant term was estimated to be statistically significant at 10% (p 0.10) and with a negative sign. This practically means that the likelihood of a company revaluing itself is less than 50%. Indeed, substitution in the estimation produces a very low probability of around 7%, which is consistent with the relevant sample. The Probit model [2] was estimated with standard errors adjusted for any heteroskedasticity (Huber-White Robust Standard Errors). The results show that there is very low explanatory power, according to the Pseudo-R2 coefficient, where only 2.25% of the variability in the probability of a company to revalue assets is explained by financial factors and by industry and year. Indeed, according to the LR statistic, the null hypothesis for an insignificant model is not rejected even at the 10% level (p > 0.10). This means that this is an insignificant model where indeed no factor has a statistically significant effect on the relative probability. Tests with the Z statistic for the significance of each individual coefficient showed that none of the coefficients are statistically significant even at the 10% level (p > 0.10), confirming that no financial factor affects the probability of a company making a material asset revaluation and based on this model. The constant term was estimated statistically significant at the 5% level (p<0.05) and with a negative sign. This practically means that the probability of a company to carry out a revaluation is below 50%. Indeed, substitution in the estimate yields a very small probability of around 8%, a number very close to the Logit estimate, which is consistent with the relevant sample, as mentioned earlier. It should be noted that the estimates of the logit, probit models did not include the health sector as an explanatory variable, because the values it receives in this sample are such that they prevented the application of the estimation of these two methods. There was no alternative but to not include this variable. Finally, the estimation of the linear probability model with the OLS method [3] was performed with standard errors adjusted for the certain existence of heteroskedasticity (White Robust Standard Errors). The results show that there is very low explanatory power, according to the R2 coefficient, where only 1.47% of the variability of the probability of a company to carry out an asset revaluation is explained by financial factors and by industries and year. Indeed, according to the F statistic, the null hypothesis for an insignificant model is not rejected even at the 10% level (p > 0.10). This means that this is an insignificant model where indeed no factor has a statistically significant effect on the relative probability. Tests with the t statistic for the significance of each individual coefficient showed that none of the coefficients are statistically significant even at the 10% level (p > 0.10), confirming that no financial factor affects the probability of a company making a material asset revaluation and based on this model. It therefore emerged that under all three models, no financial factor affects the probability of a company to undertake a revaluation of tangible fixed assets (Table 4 & 5)
Table 4: Econometric estimation of the association of probability of revaluation of property, plant and equipment with financial factors.

Table 5: Univariate analysis of the association of probability of revaluation of fixed assets with financial factors.

Univariate analysis for linking asset revaluation to financial factors
This section presents an additional analysis, which separately examines whether there is a statistically significant difference in the mean level of each explanatory variable between companies that revalued fixed assets and those that did not. The results are presented immediately below. It has been observed that companies that have undergone a revaluation of tangible fixed assets are larger in size, have higher tangible fixed asset intensity, are more leveraged, have lower liquidity, profitability, and value. The parametric statistical difference-in-difference t-test of means, on the other hand, revealed that the null hypothesis of equal means is not rejected even at the 10% level (p > 0.10). As a result, none of the above sample differences are statistically supported.
Conclusion
This study investigated whether financial factors such as firm
size, intangible asset intensity, leverage, liquidity, profitability,
and market value influence the likelihood that a firm will revalue
intangible assets. A sample of 125 companies listed on the CSE
from 2014 to 2017 was used for this purpose. There were 40
cases (company years) of tangible asset revaluation in this sample,
but no cases of intangible asset revaluation. As a result, only the
extent to which various financial factors influence the probability
of revaluation of tangible fixed assets could be investigated,
rather than the extent to which they influence the probability
of revaluation of intangible assets. The simple OLS estimation
method was also used within the linear probability model, where
the standard error of estimates adjusted for any heteroskedasticity
was taken into account in order to reliably test for the coefficients of the explanatory variables. Logistic regression and Probit
regression were used, which are the most appropriate when the
dependent variable is bivariate, and the simple OLS estimation
method was also used within the linear probability model, where
the standard error of estimates adjusted for any heteroskedasticity
was taken into account in all cases. All regression results were
consistent and showed very low explanatory power, which was also
found to be statistically insignificant, and no financial factor was
found to have a significant effect on the likelihood of a company
undertaking a revaluation of fixed assets. As a result, none of
the research hypotheses are confirmed in the case of the Greek
firm sample. The univariate analysis, which compared the mean
level of each explanatory variable between firms that carried
out an inventory revaluation and firms that did not, revealed no
statistically significant difference, implying that firms that carried
out an inventory revaluation do not differ financially from those
that did not, confirming that none of the relevant factors influence
the likelihood of a firm carrying out an inventory revaluation. On
a descriptive level, companies that have performed an inventory
revaluation have a larger size, not confirming the hypothesis, higher
tangible fixed asset intensity, confirming the hypothesis, higher
leverage, confirming the hypothesis, lower liquidity, confirming the
hypothesis, lower profitability, not confirming the hypothesis, and
lower market capitalisation, confirming the hypothesis. As a result,
four of the six research hypotheses were confirmed at a purely
descriptive level. The findings of this study contradict the majority
of previous research on this topic. However, it should be noted that
in several other studies, these hypotheses were not confirmed, indicating that these factors had no effect on the likelihood of
revaluation of tangible fixed assets. The Greek economy’s crisis is
thought to be a possible explanation for this phenomenon. The logic
is that many companies are experiencing a decline in sales, profits,
assets, and equity during this period, but revaluing tangible fixed
assets does not appear to be the solution to address their financial
problems and enhance their financial image.
A. In terms of size, it seems that even large firms do not
have the incentive to revalue their tangible fixed assets because
their profitability is low to negative and there is no incentive to
reduce their tax which is low anyway.
B. Regarding the intensity of tangible fixed assets, it appears
that even in companies with a high intensity, they are not so
inclined to revalue their tangible fixed assets because they do
not believe they can reap a large benefit from a relative goodwill,
and anyway, the borrowing capacity of most companies is low
due to the recession, so a revaluation of tangible fixed assets
is not expected to increase it significantly for the majority of
companies that already have a low borrowing capacity.
C. In terms of leverage, the difficulty of raising finance
in the context of the crisis, the high cost of capital, and the
general dysfunction in the capital markets and the banking
system do not provide strong incentives for Greek firms to
undertake material asset revaluations to improve their balance
sheets and financial position when they have high leverage to
increase their already limited borrowing capacity. Similarly, the
activation of clauses as a result of high leverage does not appear to be effectively avoidable by asset revaluation.
D. Regarding liquidity, even in companies with low liquidity,
a revaluation of tangible fixed assets does not seem to be able to
solve such problems, neither to embellish its image nor to avoid
the triggering of certain clauses.
E. Regarding profitability, it appears that even efficient
companies are not so efficient as to be able to undertake a
large-scale revaluation of fixed assets in order to achieve a
more ‘normal’ level of profitability. Due to the crisis, there are
very few cases of excessive profitability.
F. Finally, regarding market value, it seems that even in cases
of companies with a low market valuation, it is not the most
popular measure to revalue fixed assets, because it is probably
believed that shareholders will not take this as a signal for a
higher value.
This survey revealed, through the low intensity of intangible assets, that intangible assets do not constitute a significant portion of total assets; this is an obvious reason why Greek companies have not revalued their assets, on the grounds that they would gain little from such a move. As a result, no revaluation of intangible assets was to be expected. Finally, the low number of revaluations of tangible fixed assets may be due to the fact that such assets could not be revalued upwards in the context of the crisis and the collapse of the real estate market. In general, the decline in all values due to low investment opportunities and an unfavorable economic climate may be the reason why all tangible fixed assets do not have appreciating values and thus cannot be revalued. According to the findings on whether some financial factors affect the possibility of revaluation of tangible fixed assets in Greek firms, revaluation of tangible fixed assets is not a practice that firms follow to solve their financial problems when an economy is in crisis, where firms have high leverage, low efficiency, and profitability. It also demonstrates that Greek firms recognize that revaluing tangible fixed assets will not be perceived favorably by shareholders and creditors, and thus there is no point in engaging in such practices. From the aforementioned, it is reasonable to conclude that revaluation of tangible fixed assets makes more sense in more developed economies that are also experiencing a normal period rather than a crisis period, and that it is in no way a priority of an effective management that aims to effectively address their financial problems and actually improve their financial situation through other possible practices. Debt restructuring, negotiating with suppliers and creditors, but also developing new investments and a business plan that is appealing to new investors, are examples of such practices. Financial factors do not appear to be strong incentives to revalue tangible assets in many cases of developing economies and periods of crisis, as explained above, but there may be other relevant incentives. As the decision to revalue tangible and intangible assets is essentially a management decision, non-financial factors, such as corporate governance factors, may have a significant impact on a company’s ability to engage in such accounting practices, as suggested by Surgawi & Solikhah [4]. Therefore, it is suggested that future research investigate whether or not such factors motivate Greek firms to reevaluate their tangible assets [23].
References
- Gikas ChD (2007) Financial accounting, Benou Publications, Athens, Greece.
- Iatridis EG, Kilirgiotis G (2012) Incentives for fixed asset revaluations: The UK evidence. Journal of Applied Accounting Research 13(1): 5-20.
- Nijam HM (2018) Motives for reporting fixed assets at revalued amount: Evidence from a developing economy. Global Business Review 19(3): 604-622.
- Surgawi LA, Solikhah B (2018) Analysis of financial and non-financial factors to revaluation of fixed assets, International Conference on Economics. Business and Economic Education 2018: 1052-1066.
- Jung B, Pourjalali H, Wen E, Daniel SJ (2013) The association between firm characteristics and CFO’s opinions on the fair value option for non-financial assets. Advances in Accounting 29(2): 255-266.
- Tabari NY, Adi M (2014) Factors affecting the decision to revaluation of assets in listed companies of Tehran stock exchange (TSE). International Journal of Scientific Management and Development 2(8): 373-377.
- Hidayat M, Hati RP (2017) Pemilihan model Revaluasi Aset Tetap dan Dampaknya terhadap Nilai Perusahaan pada Sektor Perbankan, DIMENSI 6(3): 362- 379.
- Ballas A, Panagiotou V, Tzovas C (2014) Accounting choices for tangible assets: A study of Greek firms. Journal of Economics and Business 64(4): 18-38.
- Sudrajat Ahmar N, Mulyadi J (2017) Effect of leverage, operating cash flow, firm size and fixed asset intensity on fixed Asset revaluation decisions, scientific. Journal of Accounting Unit 5(2): 124-136.
- Choi TH, Pae J, Park S, Song Y (2013) Asset revaluations: Motives and choice of items to revalue. Asia- Pacific Journal of Accounting and Economics 20(2): 144-171.
- Aziz NA, Yuyetta ENA (2017) Analysis of factors encouraging companies to evaluate fixed assets, Diponegoro. Journal of Accounting 6(4): 1-11.
- Rahman T (2017) Revaluation of fixed assets before IPO: A study on textile industry in Bangladesh. Journal of Finance and Accounting 5(5): 200-205.
- Cheng CSA, Lin SWJ (2009) When do firms revalue their assets upwards? Evidence from the UK. International Journal of Accounting and Information Management 17(2): 166-188.
- Seng D, Su J (2010) Managerial incentives behind fixed asset revaluations: Evidence from New Zealand firms. Department of Accountancy and Business Law, Working Paper Series 3: 1-33.
- Barać ZA, Šodan S (2011) Motives for asset revaluation policy choice in Croatia. Croatian Operational Research Review 2(1): 60-70.
- Lin YC, Peasnell KV (2000) Fixed asset revaluation and equity depletion in UK. Journal of Business Finance and Accounting 27(3-4): 359-394.
- Manihuruk TNH, Farahmita A (2015) Analysis of factors affecting the selection of fixed asset revaluation methods in companies listed on stock exchanges of several ASEAN countries, Medan: Paper Presented at the XVIII National Accounting Symposium.
- Latifa CA, Haridhi M (2016) The effect of debt contracts negotiation, political cost, fixed asset intensity, and market to book ratio on companies conducting fixed asset revaluations, scientific. Journal of Accounting Economics Students 1(2): 166-176.
- Tay I (2009) Fixed asset revaluation: Management incentives and market reactions. Thesis Lincold University, pp. 1-100.
- Barlev B, Fried D, Haddad JR, Livnat J (2007) Reevaluation of revaluations: A cross-country examination of the motives and effect on future performance. Journal of Business Finance and Accounting 34(7-8): 1025-1050.
- Baek HY, Lee DY (2016) Motives for and effects of asset revaluation: An examination of South Korean data. Emerging Markets Finance and Trade 52(12): 2808-2817.
- Martini R, Kurniawati (2018) Factors influencing the selection of the revaluation model as a fixed asset measurement model and its impact on earnings management. Journal of Business Accounting 10(2): 104-123.
- Christou G (2011) Introduction to econometrics, Gutenburg Publications, Athens, Greece.
© 2022 Toudas Kanellos. This is an open access article distributed under the terms of the Creative Commons Attribution License , which permits unrestricted use, distribution, and build upon your work non-commercially.
Editor In Chief


.jpg)


Signup for Newsletter

Quick Links
 Editorial Board Registrations
 Submit your Article
 Refer a Friend
 Advertise With Us
Our Recent Edition

.jpg)


Top Editors


.jpg)


.bmp)
.jpg)
.png)
.jpg)


.jpg)


.png)

.png)


.png)


Financial Support

Sponsors

Latest e-Books

Latest Video

 a Creative Commons Attribution 4.0 International License. Based on a work at www.crimsonpublishers.com.
Best viewed in
a Creative Commons Attribution 4.0 International License. Based on a work at www.crimsonpublishers.com.
Best viewed in