
- About Us
- Information
-

The Author ensures that the research has been conducted responsibly and ethically with adherence to all relevant regulations. read more..
- For Authors
- For Reviewer
- Manuscript Guidelines
- Membership
- Publication Ethics
-
- Journals
- Reprints
- e-Books
- Videos
- Policies
- Contact Us
 COVID-19
- Submissions


Full Text
Strategies in Accounting and Management
The Effect of Corporate Tax Outcomes on Forced CEO Turnover
Xue Chang*
Faculty of Business, University of Nottingham Ningbo, China
*Corresponding author:Xue Chang, Faculty of Business, University of Nottingham Ningbo, China
Submission:February 25, 2022Published: May 17, 2022
ISSN:2770-6648Volume3 Issue3
Abstract
With market competition has increased in recent years, CEO turnover has become more frequent. The tax avoidance activities can maximize after-tax profits. After the CEO turnover, the company’s strategy needs to be repositioned. Therefore, this paper analyzes the impact of corporate tax avoidance on CEO turnover. This paper selects Chinese A-share market from 2010 to 2018 as a sample and combines theoretical analysis and empirical research to explore the impact of corporate tax avoidance on CEO turnover, and further analyzes the relationship under different ownerships. We find that there is a negative relationship between tax rates and forced CEO turnover. Listed companies with lower tax rates will cause social concern, leading to public doubts and inspections by tax authorities, which will further damage the company’s reputation. CEO turnover is the quick and easy way to respond the public accusations. We also find that state-owned enterprises undertake more social responsibilities than non-state-owned enterprises. The main contributions of this paper are as follows: On the theoretical perspective, this paper conduct systematic research on corporate tax avoidance and CEO turnover and analyze the relationship under different ownerships. In terms of practice, this paper puts forward relevant policy recommendations for the long-term development for enterprises and social responsibilities.
Keywords: Corporate tax avoidance; CEO turnover; Corporate social responsibility; Agency problem
Research Theory
This paper is based on two theories: agency theory and corporate social responsibility theory. The reason why we choose to join the corporate social responsibility theory is that the agency theory mainly focuses on the relationship between shareholders and managers and cannot fully explain the relationship between tax avoidance and corporate governance. Corporate responsibility theory can better explain the link between the company and all stakeholders (such as government agencies, political groups, customers and the public).
Like tax avoidance, corporate social responsibility lacks a clear definition. According to Lanis R [1] the social responsibility theory states the existence of an implicit contract between the corporations and society, and this contract is based on expectations of several groups in the society. Another important aspect of social corporate responsibility is that organizations seek legitimacy from various stakeholders within the society. The way to obtain legitimacy is to conduct operations in a socially responsible manner, which is determined by the stakeholders of corporations. The greater the influence and power of the reference groups, the more willing the organization to make changes to legitimatize itself to the relevant groups. Agency theory is provided by Meckling WH [2]. The separation of ownership and control due to the goal of the shareholders and managers is inconsistent. Shareholders are aimed at after-tax profits and managers pursue avoid risks [3]. In order to reduce agency cost, companies often choose equity incentive compensation [2]. In order to better understand Chinese companies, we must pay attention to the background of Chinese companies [4]. State-owned enterprises account for approximately 80% of Chinese stock market [5]. The selection and appointment of state-owned enterprises executives are mainly based on the “internal labor market” formed by the government officials, which has led to different taxation attitudes between SOEs and non-SOEs. Most scholars believe that the degree of tax avoidance in SOE is less than that of non-SOEs.
Literature Review
Corporate tax avoidance
In recent years, many researchers have paid attention to tax avoidance. John GR [6] review literatures of the three top accounting journals (Accounting Review, Journal of Accounting and Economics, Journal of Accounting Research) and find an upward trend on tax avoidance literatures. Many literatures have analyzed the motivations and consequences of tax avoidance [7]. We define tax avoidance broadly as covering any matter that reduces the company’s tax payment compared to pre-tax income [8]. We do not measure tax aggressiveness, tax risk, tax evasion, or tax sheltering. Previous researches have shown substantial variation in effective tax rates. Tax strategy is affected by many factors, such as: board composition, company structure and management compensation. Among many factors, the influence of executives is the most important. Jeong [9] finds that managers can manipulate income and hide negative information through complex tax techniques. Slemrod [10] find that if the marginal benefits of tax avoidance are greater than the marginal costs, managers will take all measures to reduce the tax expenses. Companies that use after-tax incentive compensation have lower effective tax rates than companies that use pre-tax performance incentives compensation [11,12]. The consequences of tax avoidance can be analyzed through the cost of equity, enterprises value, investors’ attitude, management reputation, and leverage and so on. Jesse Chan finds that the higher degree of tax avoidance, and managers are more likely to pursue self-interest.
The CEO turnover
CEO turnover has always been considered as an important factor of the change of enterprise strategy, because CEO is the decision-maker and implementer of enterprise strategy. In recent years, CEO turnover has become a core issue in the field of strategy, organization, finance and leadership. According to the previous literatures, the main factors that affect CEO turnover are company performance, industry competitiveness, board composition, insider ownership, and so on. CEO turnover is an important part of corporate governance. Board has the responsibility to replace the inappropriate CEOs if they cannot meet the requirement of shareholders [13]. Douglas [14] proposes that compared with state-owned companies, corporate fraud in non-SOEs is more likely to lead to CEO turnover in China. Edward [15] shows that effectively distinguishing between forced and non-forced CEO turnover can reduce bias in the test, which can analyze the relationship between tax and CEO turnover robustly. Because forcing the CEO to leave is a deliberate action taken by the board, which means that the company plans to change direction, strategy, and leadership. In developed countries, CEO turnover has been widely analyzed. However, in countries with weak legal systems and underdeveloped financial systems, the determinants of CEO turnover remain unclear. It is rare to analyze the effect of tax rate on CEO turnover in China. Our research also complements the existing literatures on CEO turnover.
Relevant research on the relationship between corporate tax avoidance and CEO turnover
Although the CEO is not a tax expert and cannot directly influence the company’s tax policies, the CEO is the ultimate decision-maker, whose position is higher than that of the tax director and CFO [16]. CEOs have a greater impact on effective tax rates than CFOs [17,18]. The CEO can use “tone at the top” to indirectly influence the tax policies [19]. They hold that the decision-making is affected by the CEO personal characteristics and has been confirmed by a large number of studies [20-23]. They believe that the CEO has a significant impact on corporate tax rates [21]. CEOs can adjust the company’s annual budget to avoid taxes. The decision to hire or dismiss a tax director is part of the CEO’s tax planning. The CEO can also instruct the CFO or tax directors to avoid tax by changing the compensation plan. Therefore, the CEO has the intention and ability to influence the company’s tax strategy. James Chyz [24] find that there is a positive relationship between tax avoidance and CEO overconfidence. Allison Koester [25] finds that executives with more resources are more effective in participating tax avoidance. Gaertner [26] analyses CEO turnover in the United States from 1993 to 2006. They find that there is a relationship between the tax rates and forced CEO turnover. When the tax rate deviates from the industry average, the CEO is more likely to be replaced.
Research Hypothesis
It is important for a company to gain legitimacy within the society; otherwise, the company will not be able to operate. Corporate attitudes towards corporate social responsibility, considerations of legitimacy, and more fundamental ethical issues affect the tax position of companies [27]. Tax expense has been considered as a primary way for companies to make social contributions [28]. Tax avoidance contravenes the expected social standards; therefore companies hardly ever publicize their tax avoidance practices [29]. Stakeholders regard tax avoidance as contradictory to their expectations of proper firm behaviors [30- 32]. when a firm engages in tax avoidance, the organizational legitimacy of the firm is questioned by the public [33]. The public shaming of tax-avoidant companies has been seen as an effective way to limit the tax avoidance activities [34]. CEOs are obligated to safeguard the stakeholders’ interests while executing their corporate duties [35]. Thus, companies seeking to uphold their legitimacy are expected to be less tax avoidant [31]. Tax avoidance will incur direct and indirect costs [36]. From the dimension of direct costs, companies not only need to pay related consulting fees and additional audit fees for tax planning, but also they may be punished for tax avoidance and forced to pay high fines, thereby reducing the company’s cash inflow and shareholders’ wealth [37]. From the dimension of indirect costs, tax avoidance is formed through complex transactions, which will exacerbate the information asymmetry between insiders and outsiders. Since external investors cannot identify the true situation of enterprises, they will demand a higher return. Tax avoidance will also increase the complexity of the operating structure and financial system and facilitate the management’s opportunistic behaviors such as profit manipulation [17,38]. Companies are subject to more stringent external regulatory risks, such as audit firms, media, government, consumers, etc. [23].
Corporate social responsibilities believe that the costs involving tax avoidance are greater than its benefits [39]. A commonly held belief in the tax literature is that reputational costs are a limiting factor in the extent to which firms and managers are willing to minimize their effective tax rates [40-42] suggest that when a company is involved in tax shelters, the company’s share price declines. Bankman J [43] find that firms may bear reputational and political costs for being labeled a “poor corporate citizen,” which might adversely affect product market outcomes. Network and media promote the establishment of a reputation mechanism and enhance trust and efficiency of the market. Dyreng SD [44] find that companies that adopt tax avoidance strategies will have a negative impact on the market value. The loss caused by reputation cost is far greater than the penalty imposed by the tax authorities [45]. From the perspective of managers, they have a strong motivation not to participate in tax avoidance. Because reputation costs and punishment are the main factors that managers are unwilling to reduce effective tax rates [40,17,42]. Scholes finds that CEOs suffer reputational damage due to tax avoidance [41]. As the spokesman of the corporation, the CEO is likely to become the “scapegoat”. The company is more willing to change the CEO to improve its corporate image and to show the market that the company hopes to change its tax strategy. As mentioned above, paying taxes is an important way for enterprises to undertake social responsibility. Hanlon M [42] find that company will be labeled as “poor corporate citizen” when the tax rate is too low, which will result in the increase of political and reputation costs. Stakeholders highly appraise companies that have made greater contributions to society. Companies that pay more taxes deliver excellent performance information to the market. In turn, companies will face stricter inspections by the tax authorities, media and even customers resist, which will affect the market value of the company. Based on the above analysis, we put forward the first hypothesis.
H1A: The possibility of forcing CEO turnover increases when the effective tax rates related to peer companies are low.
According to the principal-agent theory, the goal of the shareholders and managers is inconsistent. Shareholders are aimed at after-tax profits and managers pursue avoid risks [17].
As a kind of operating cost, tax expenses reduce the net profit and affect the reinvestment and reproduction of the enterprise. The implementation of tax avoidance can reduce the tax costs, retain more cash flow, and increase the competitiveness of enterprises [46]. As effective tax rates increase, the board of directors and shareholders will doubt the CEO’s ability to manage company’s resources. Managers will be more actively involved in tax avoidance to reflect their profitability and management level. From the perspective of CEO’s personal interests, tax avoidance occurs in three situations. Firstly, if companies have cooperating governance mechanism, CEOs can increase profits through tax avoidance to obtain higher compensation. Secondly, if the company lacks effective supervision and corporate governance mechanisms, it will not be able to coordinate agency problem through equity compensation. When there is no effective restriction and supervision, the CEO as a “rational person” has self-interest motivation [47]. They can make use of the tax avoidance transactions to grab private interests [17]. Slemrod J [10] finds that managers are likely to retain more surplus funds in enterprises through tax avoidance strategy and use them for enterprise expansion or private interests. There is a complementary relationship between tax avoidance and CEO’s rent-seeking [17,48].
Executives without effective supervision will take radical tax avoidance decisions to seek private interest, and rent-seeking behavior will further enhance executives’ willingness and ability to implement tax avoidance transactions. The cash flow generated by tax avoidance is the supplement of executive compensation. Desai and Dharmapala [17] find that if the compensation is increased, the degree of tax avoidance will be reduced. Managers tend to take aggressive tax avoidance if incentive contracts don’t work. Laguir I [49] confirm that CEOs with more power will implement more radical tax avoidance strategies and seize more private interests accordingly. Therefore, CEOs have the willingness and ability to manipulate profits by taking tax avoidance activities. Compared with corporate misconduct, tax avoidance activity may have little impact on the company’s reputation. Unlike accounting fraud, tax avoidance is mostly legal, or it belongs to the gray area of the tax law. The risks involved in tax avoidance may be different from other risks faced by companies (such as liquidity risks, competition risk, and continued operation risks). Therefore, the impact of tax avoidance on corporate reputation is not important. Gallemore J [50] study the possibility of CEO turnover after tax avoidance participation has been publicly disclosed. They find that there is no evidence of an increase in CEO turnover when the company’s participation in the tax avoidance, which shows that CEOs do not bear the reputation cost due to the choice of tax avoidance policies. From the perspective of reducing agency costs and CEOs’ personal interests, CEOs are more willing to avoid taxes. Failure to participate in tax avoidance may result in the CEO being unable to achieve the after-tax profit target and increase the possibility of dismissal. This leads to our second hypothesis:
H1B: The possibility of forcing CEO turnover increases when the effective tax rates related to peer companies are high.
From the of property rights theory, there are great differences between state-owned enterprises and non-state-owned enterprises, which also brings about different effects of tax avoidance on CEO turnover. Shareholders have different requirements for tax planning between state-owned enterprises and non-state-owned enterprises. SOEs have commercial and public welfare characteristics. The goal of SOEs is not only to increase corporate wealth, but also to undertake social responsibilities such as economic development and social stability. In order to achieve social goals, state-owned enterprises must bear more tax expenses to maintain the stability of the national tax revenue. The ownership and control of SOEs belong to the government. The government directly affects SOEs. The government requires state-owned enterprises to bear more tax expenses through administrative approaches. At the same time, the government controls the assessment, appointment and removal of CEOs of SOEs. In order to keep the position or favor the government, CEOs have the incentive to bear more taxes to ensure the stability of fiscal income and increasing the reputation value of the enterprise. (Shuai)Ma finds that the effective tax rate and cash tax payment of state-owned enterprises is higher than that of nonstate- owned enterprises.
Different from state-owned enterprises, the goal of non-stateowned enterprises is to maximize the value of the company. They have higher incentives to tax avoidance, so as to reduce tax cost and retain more cash flow in the enterprise and increase the value of shareholders. The non-state-owned enterprises bear less social responsibility, and the public is less critical of them in tax avoidance. Therefore, compared with state-owned enterprises, CEOs pay less tax is benefit to shareholders and less likely to be fired in non-stateowned companies. From the view of managers, CEOs in state-owned enterprises are often administrative appointments which bear a lot of administrative responsibilities, while CEOs of non-stateowned enterprises are agents elected by the board of directors. The differences make them have different attitudes towards corporate tax avoidance.
Based on the above analysis, this paper puts forward the second
hypothesis
H2: Compared with non-state-owned enterprises, tax avoidance
in state-owned enterprises has a more significant impact on forced
CEO turnover.
Data and Sample
Our sample is companies listed on both the Shanghai Stock Exchange (SHSE) and the Shenzhen Stock Exchange (SZSE) from 2010 to 2018. The main reason for the sample period begins from 2010 is that China has implemented the new enterprise income tax law since 2008. The revision of the new income tax law has reduced the maximum enterprise income tax rate from 33% to 25%. Therefore, it is expected that the implementation of this policy in 2008 will significantly affect the tax avoidance of enterprises. In addition, the global financial crisis started in 2008 has a partial impact on China’s economy, leading to the fluctuation of national policy. In short, in order to avoid the impact of the new income tax law and the global financial crisis, this paper takes 2010 as the starting year of the research sample. The sample period ends in 2018, because 2018 data is the latest research data available in this paper.
Next, the samples are screened as follows steps:
A. remove the samples whose pre-tax accounting profit is less
than or equal to zero.
B. remove the abnormal samples whose income tax expense is
less than or greater than pre-tax accounting profit.
C. delete the abnormal samples whose debt cost is less than or
greater than one.
D. exclude firms with incomplete information on the key
variables.
E. delete the listed companies in the financial industry, because
the accounting standards in the financial industry are quite
different from those of other industries, and the relevant
indicators are not comparable.
F. We delete companies marked as ST or * ST because of
irregularities and negative profits for two or three consecutive
years.
G. Excluding the samples with abnormal actual income tax rate
(the actual income tax rate is less than 0 and greater than 1).
Table 1: Reasons for CEO turnover presented in CSMAR database.

The research data comes from CSMAR database. In addition, all variables are winsorized at the 1% and 99% level. In 2010-2018, there are 11,000 firm-year observations. There are 1,701 CEO turnovers during the sample period. In Table 1, there are 12 reasons for CEO turnover, which provided by CSMAR database. Change of job is taking up highest percentage, which accounting for 28.81% of the turnover. The second one is contract expiration, which represents 27.81%, and the third is Personal reasons (12.17%). Only 0.76% falls in the dismissal category. We reclassify reasons on job changes, resignations, personal reasons, and reasons not given [51]. Other turnover rates are classified as normal with one exception: if the CEO is less than 60 years old and stated reason is retirement, we classify this turnover as forced Huson MR [52] Table 2 summarizes the reasons for CEOs forced and normal turnover and the corresponding frequency. By reexamining 958 cases through a search for CEO resume, 432 cases are not forced. We can see those 241 cases remaining as board chairman or vice chairman and 191 cases are promoted (186 CEOs promote as chairman or vice chairman; 5 CEOs became government officials). We classify the remaining 526 cases as forced turnover. These included 78 CEOs who accepted new positions ranked lower than CEO position and 448 cases without any traceable destination information. In conclusion, 1154 normal turnover events which accounted for 67.84% of the total and 516 cases as forced turnover (32.16%).
Table 2: Classification of CEO turnover.

Measures
According to Hanlon and Heitzman [48], they find that there are many approaches to measure tax avoidance to ensure the robustness of research conclusions. In this paper, we use four measures from the balance sheet dimension and cash flow statement dimension: Effective Tax Rate (ETR), Cash Effective Tax Rate (CASH_ETR), Book Tax Difference (BTD), and Discretionary Book-Tax Difference (DDBTD). They are the core variables in the study of tax avoidance and have been used in many literatures [53]. They conclude that a higher ETR or cash- ETR indicates lower tax aggressiveness, while a higher BTD and DDBTD indicates a higher tax avoidance (Table 3)
Table 3: Classification of CEO turnover.

ETR
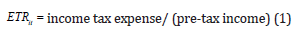
ETR (Effective Tax Rate) as the simplest measure used by many scholars [54,31]. Lower ETR reflects lower tax expenditure caused by tax avoidance [55].
Cash-ETR
Our second measure is Cash-ETR which reflects firms’ actual cash tax payments for a given level of pre-tax income [56,57].

BTD
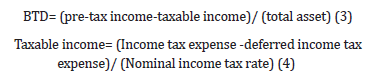
Book-Tax Difference (BTD) refers to the difference between
book accounting profit and the taxable income declared to the tax
authority, which was proposed by Plesko GA [58]. The larger the
BTD, the greater the difference between the accounting profit and
the taxable income [17].
DDBTD
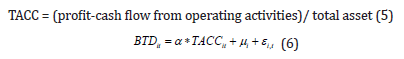
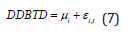
Discretionary Book-Tax Difference (DDBTD) are the residuals from the following model (7) [17]. DDBTD can more accurately measure and reflect the tax avoidance behavior. DDBTD can be calculated from the model (3). TACC it is total accruals profit scaled by total assets; u_i is the average value of the residual for firm i over the sample period; and ε_(i,t) is the deviation in year t from firm i’s average residual u_i. The residual from this regression (DDBTD) can be used as a measure of tax avoidance. DDBTD represents the part of the BTD that cannot be explained by accrued profit.
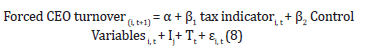
In order to test whether tax avoidance will affect the probability of forced CEO turnover, this paper uses Linear Probability Models (LPM) to test hypothesis Chang Ec [59]:
We estimate the model (4) and give the results of ETR, cash
ETR, BTD and DDBTD respectively. Control variables can be
divided into two aspects. We use (Duality structure and CEO’s
tenure) variables to control the characteristics of CEOs [60]. We
control firm characteristics through capital structure, corporate
size, and companies’ ownership. We also control for three firm
characteristics: capital structure, size, leverage, and the ownership
of the largest shareholders [61]. We use the accounting performance
indicator (ROA) to measure profitability. The dummy variable
(State) indicates that whether a listed firm is controlled by state
or private shareholders. We calculated industry-Adjusted Returns
(AR) as the firm’s industry-adjusted annual stock return (including
dividends) [62]./
Empirical Results
Descriptive statistics
Table 4 presents descriptive statistics. We can see that the average length of tenure is 5.286 years. Duality is not a common feature of the corporate governance structure in listed companies; only 27.2% of the CEOs are also serving as the chairman of the board. The average size of listed companies is 22.13. The average leverage is 0.392, indicating that the total liabilities account for one third of the total assets. The average ROA for all listed firms is 6.2%. Among The four taxable avoidance variables, the average values of ETR and Cash-ETR are 17.1% and 52.3% respectively. And the average of BTD and DDBTD are 0.7% and 0.5% respectively.
Table 4: Classification of CEO turnover.

Variable definitions
ETR equals tax expenditure to pre-tax income. CASH_ETR means cash tax payment to pretax income. Book-Tax Difference (BTD) means that the total differences between book and taxable incomes. DDBTD means a measure of unexplained total book-tax differences. TO_FORCE is a dummy variable that equals 1 if there was a forced turnover and 0 otherwise. STATE presents a firm has a greater percentage of state shares, State takes the value of 1, and 0 otherwise. Tenure indicates that the number of years that a CEO has served in a listed firm. SIZE means the size of a listed firm, measured as the natural logarithm of the book value of total assets. AR presents firm’s industry-adjusted annual stock return (including dividends). DUALITY is used to measure whether the CEO is concurrently as a chairman or not. It is a dummy variable. The value of concurrent is 1, otherwise it is 0. LEV is defined as total liabilities divided by total assets. ROA equals after tax profit divided total assets.
Correlations
In order to test the relationship between variables initially, the Pearson correlation coefficient between the main variables is shown in Table 5. In the table, “*, **, ***” indicate the significance levels at 10%, 5%, and 1%, respectively. It can be seen from the table above:
Table 5: Classification of CEO turnover.

(1) The correlation coefficient between the Effective Tax Rate (ETR) and forced CEO turnover (TO_FORCE) is -0.024 the correlation coefficient between cash-ETR and TO_FORCE is -0.039, and the correlation coefficient between BTD (DDBTD) and TO_ FORCE is 0.043 and 0.037, respectively and significant at the 1% level. This indicates that the higher tax rate, the lower level of tax avoidance and the CEO is unlikely to be fired, which is consistent with the hypothesis 1A. (2) The correlation coefficient between the STATE and the Effective Tax Rate (ETR) and CASH_ETR is 0.13 and 0.103 respectively and is significant at the level of 1%. This indicates that the effective tax rate in state-owned enterprises is higher than that of non-state-owned enterprises which is consistent with hypothesis 2. In order to ensure multi-collinearity is not a problem, we calculate the Variance Inflation Factors (VIF) for each independent variable. All the VIFs do not exceed 2, which suggest that our models are not prone to multi-collinearity problems. After descriptive statistical analysis and Pearson correlation coefficient test, we have a preliminary understanding of the relationship between tax rates and forced CEO turnover. In order to test the correctness of the hypothesis in this paper, we will regression analysis. This table reports Pearson correlation coefficients for the full sample. Forced CEO Turnover is measured as year t+1, while all other variables as measured at t. *, **, *** Denote statistical significance at the 10 percent, 5 percent, and 1 percent levels, respectively, for one-tailed tests examining forced turnover quintiles, and two-tailed otherwise.
Variable definitions
ETR equals tax expenditure to pre-tax income. CASH_ETR means cash tax payment to pretax income. Book-Tax Difference (BTD) means that the total differences between book and taxable incomes. DDBTD means a measure of unexplained total book-tax differences. TO_FORCE is a dummy variable that equals 1 if there was a forced turnover and 0 otherwise. STATE presents a firm has a greater percentage of state shares, State takes the value of 1, and 0 otherwise. Tenure indicates that the number of years that a CEO has served in a listed firm. SIZE means the size of a listed firm, measured as the natural logarithm of the book value of total assets. AR presents firm’s industry-adjusted annual stock return (including dividends). DUALITY presents 1 if the CEO and the Chairman of the Board of Directors are the same person, and 0 otherwise. LEV is defined as total liabilities divided by total assets. ROA equals after tax profit divided total assets.
Regression analysis
In order to test hypothesis, we will carry out LPM regression. Table 6 shows the regression results. The regression coefficient between the Effective Tax Rate (ETR) and forced CEO turnover (TO_FORCE) is -0.1298, between CASH_ETR and TO_FORCE is-0.0367, between BTD (DDBTD) and TO_FORCE is 0.2422 (0.2357) and significantly above the 1% level. This indicates that the lower the effective tax rate (cash effective tax rates), the higher the degree of corporate tax avoidance and the higher likely forced CEO turnover, which verify the hypothesis 1A. According to Gaertner FB [26], I also conduct the linear Probability Model with year fixed effects control for the effect of market-wide macroeconomic fluctuations and time trend on CEO turnover decisions, the result is consistent with hypothesis 1A. The empirical test in Table 6 confirms the relationship between corporate tax avoidance and forced CEO turnover. In China, state-owned enterprises occupy an important part of listed companies. It is necessary to distinguish the nature of property rights to explore the difference between state-owned enterprises and non-state-owned enterprises. Therefore, an empirical test of hypothesis 2 is carried out. Table 7 shows that in state-owned enterprises, the Effective Tax Rate (ETR) and CASHETR is negatively correlated with and TO_FORCE, and is significant at the 1% level, BTD (DDBTD) is significantly positively correlated with TO_FORCE and significant at the 1 % level. Compared with SOEs, Table 8 shows that the relationship between tax rates and forced CEO turnover is not significant in non-state-owned enterprises, which is consistent with Hypothesis 2. Table 7 shows that the lower the effective tax rate of the state-owned enterprise group, the higher the degree of corporate tax avoidance, and the greater the possibility of mandatory changes to the CEO. This table reports results for our main tests examining the effect of taxes on forced CEO turnover using a Linear Probability Model. Regression coefficients and standard errors are reported side-by-side. Forced CEO Turnover is measured as year t+1, while all other variables as measured at t. *, **, *** Denote statistical significance at the 10 percent, 5 percent, and 1 percent levels, respectively, for one-tailed tests examining forced turnover quintiles, and two-tailed otherwise.
Table 6: Classification of CEO turnover.

Table 7: Classification of CEO turnover.

Table 8: Classification of CEO turnover.

Variable definitions
ETR equals tax expenditure to pre-tax income. CASH_ETR means cash tax payment to pretax income. Book-Tax Difference (BTD) means that the total differences between book and taxable incomes. DDBTD means a measure of unexplained total book-tax differences. TO_FORCE is a dummy variable that equals 1 if there was a forced turnover and 0 otherwise. STATE presents a firm has a greater percentage of state shares, State takes the value of 1, and 0 otherwise. Tenure indicates that the number of years that a CEO has served in a listed firm. SIZE means the size of a listed firm, measured as the natural logarithm of the book value of total assets. AR presents firm’s industry-adjusted annual stock return (including dividends). DUALITY presents 1 if the CEO and the Chairman of the Board of Directors are the same person, and 0 otherwise. LEV is defined as total liabilities divided by total assets. ROA equals after tax profit divided total assets. This table reports results for our main tests examining the effect of taxes on forced CEO turnover using a Linear Probability Model in SOEs. Regression coefficients and standard errors are reported side-by-side. Forced CEO Turnover is measured as year t+1, while all other variables as measured at t. *, **, *** Denote statistical significance at the 10 percent, 5 percent, and 1 percent levels, respectively, for one-tailed tests examining forced turnover quintiles, and two-tailed otherwise.
Variable definitions
ETR equals tax expenditure to pre-tax income. CASH_ETR means cash tax payment to pretax income. Book-Tax Difference (BTD) means that the total differences between book and taxable incomes. DDBTD means a measure of unexplained total book-tax differences. TO_FORCE is a dummy variable that equals 1 if there was a forced turnover and 0 otherwise. STATE presents a firm has a greater percentage of state shares, State takes the value of 1, and 0 otherwise. Tenure indicates that the number of years that a CEO has served in a listed firm. SIZE means the size of a listed firm, measured as the natural logarithm of the book value of total assets. AR presents firm’s industry-adjusted annual stock return (including dividends). DUALITY presents 1 if the CEO and the Chairman of the Board of Directors are the same person, and 0 otherwise. LEV is defined as total liabilities divided by total assets. ROA equals after tax profit divided total assets. This table reports results for our main tests examining the effect of taxes on forced CEO turnover using a Linear Probability Model in Non-SOEs. Regression coefficients and standard errors are reported side-by-side. Forced CEO Turnover is measured as year t+1, while all other variables as measured at t. *, **, *** Denote statistical significance at the 10 percent, 5 percent, and 1 percent levels, respectively, for one-tailed tests examining forced turnover quintiles, and two-tailed otherwise.
Variable definitions
ETR equals tax expenditure to pre-tax income. CASH_ETR means cash tax payment to pretax income. Book-Tax Difference (BTD) means that the total differences between book and taxable incomes. DDBTD means a measure of unexplained total book-tax differences. TO_FORCE is a dummy variable that equals 1 if there was a forced turnover and 0 otherwise. STATE presents a firm has a greater percentage of state shares, State takes the value of 1, and 0 otherwise. Tenure indicates that the number of years that a CEO has served in a listed firm. SIZE means the size of a listed firm, measured as the natural logarithm of the book value of total assets. AR presents firm’s industry-adjusted annual stock return (including dividends). DUALITY presents 1 if the CEO and the Chairman of the Board of Directors are the same person, and 0 otherwise. LEV is defined as total liabilities divided by total assets. ROA equals after tax profit divided total assets.
Robustness
In this subsection, we perform a series of additional tests to ensure the robustness of our results.
Logit
We also conduct logit model to support hypothesis, which shows in Table 9. The result is consistent with LPM model.
Table 9: Classification of CEO turnover.

*, **, *** Denote statistical significance at the 10 percent, 5 percent, and 1 percent levels, respectively, for one-tailed tests examining H1 and H2, and two tailed otherwise. This table reports coefficients and standard errors for our variables of interest for a series of robustness tests. In this table, we estimate several variations of our main results, but for brevity, only report the coefficients on ETR, CASH_ETR, BTD, and DDBTD. Full estimation results are available from the authors upon request. Robustness tests are estimated in ten groupings, (1) to (7): (1) controls for earning management by adding ABSDA; (2) controls for information quality by adding OPAQUE; (3) controls for management ability by adding MA_SCORE; (4) takes the base model and adds all variables used in (1), (2), and (3); (5) uses LOGIT to estimate instead of the Linear Probability Model; (6) uses LOGIT to estimate SOEs; (7) uses LOGIT to estimate non-SOEs.
Changes of tax rates after forced CEO turnover
If low taxes played a role in the CEO’s firing, then we expect these trends to be reversed under new management. There is a positive relationship between ETR (CASH_ETR) and TO_FORCE. The results showed in Table 10, which shows that tax rates increase following forced turnover. This table reports ETR, CASH_ETR, BTD and DDBTD for firms experiencing forced turnover. Forced CEO Turnover is measured as year t+1, while all other variables as measured at t. *, **, *** Denote statistical significance at the 10 percent, 5 percent, and 1 percent levels, respectively, for one-tailed tests examining forced turnover quintiles, and two-tailed otherwise.
Table 10: Classification of CEO turnover.

Variable definitions
ETR equals tax expenditure to pre-tax income. CASH_ETR means cash tax payment to pretax income. Book-Tax Difference (BTD) means that the total differences between book and taxable incomes. DDBTD means a measure of unexplained total book-tax differences. TO_FORCE is a dummy variable that equals 1 if there was a forced turnover and 0 otherwise. STATE presents a firm has a greater percentage of state shares, State takes the value of 1, and 0 otherwise. Tenure indicates that the number of years that a CEO has served in a listed firm. SIZE means the size of a listed firm, measured as the natural logarithm of the book value of total assets. AR presents firm’s industry-adjusted annual stock return (including dividends). DUALITY presents 1 if the CEO and the Chairman of the Board of Directors are the same person, and 0 otherwise. LEV is defined as total liabilities divided by total assets. ROA equals after tax profit divided total assets.
Table 11: Classification of CEO turnover.

To ensure primary results are not spurious or the result of correlated omitted factors generally inherent to CEO turnover, we conduct a falsification test. Specifically, we re-estimate our main tests after substituting Unforced CEO Turnover for Forced CEO Turnover. According to Table 2, we obtain 1,154 normal CEO turnover cases, which unlikely to be the result of organizational stress or crisis that drives board action to deliberately change its leader or firm strategy [15]. The results of our falsification test (Table 11) are supportive of our hypotheses, as UNFORCED CEO turnover are not significant positively related tax indicators. This table reports results for our falsification tests examining the effect of taxes on unforced CEO turnover using a Linear Probability Model. Regression coefficients and standard errors are reported side-byside. Forced CEO Turnover is measured as year t+1, while all other variables as measured at t. *, **, *** Denote statistical significance at the 10 percent, 5 percent, and 1 percent levels, respectively, for one-tailed tests examining forced turnover quintiles, and two-tailed otherwise.
Variable definitions
ETR equals tax expenditure to pre-tax income. CASH_ETR means cash tax payment to pretax income. Book-Tax Difference (BTD) means that the total differences between book and taxable incomes. DDBTD means a measure of unexplained total book-tax differences. TO_FORCE is a dummy variable that equals 1 if there was a forced turnover and 0 otherwise. STATE presents a firm has a greater percentage of state shares, State takes the value of 1, and 0 otherwise. Tenure indicates that the number of years that a CEO has served in a listed firm. SIZE means the size of a listed firm, measured as the natural logarithm of the book value of total assets. AR presents firm’s industry-adjusted annual stock return (including dividends). DUALITY presents 1 if the CEO and the Chairman of the Board of Directors are the same person, and 0 otherwise. LEV is defined as total liabilities divided by total assets. ROA equals after tax profit divided total assets.
Contributions and Limitations
Our research expands the research perspective through investigates the impact of tax outcomes on forced CEO turnover from different theories, which helps to understand corporate tax avoidance from a more complete perspective and enrich the existing literature. Firstly, we document the important relationship between tax outcomes and forced CEO turnover. Many researchers question the role of CEOs in tax planning because they are not tax experts and do not know the details of tax strategy. This paper studies the role of CEO in corporate tax planning. Secondly, we provide a new perspective on forced CEO turnover. CEO turnover is a hot issue in the current research, but the existing literatures focus on the impact of corporate performance on CEO turnover. There are few researches analyses the relationship between tax avoidance and forced CEO turnover. Thirdly, we enrich the existing literature on tax avoidance. There are many researchers investigate the reasons and impacts of tax avoidance since the literature published by Hanlon and Heitzman [48]. However, few of them analyses on tax avoidance from corporate social responsibility theory. We also analyze the relationship under different ownerships, which provides a new perspective for corporate tax avoidance and CEO turnover. Due to time, energy, research capabilities and data availability, the research still has the limitations. This article chooses control variables mainly from the company level. The increase in operating income and the rate of return on the stock market are mostly indicators commonly used in the research of the US capital market. Taking into account the maturity of the Chinese capital market, these indicators are easy to be affected by other factors. When selecting control variables in subsequent research, more consideration should be given to the development of the Chinese capital market, and more explanatory control variables should be selected [63,64].
References
- Lanis R, Waller DS (2009) Corporate Social Responsibility (CSR) disclosure of advertising agencies: An exploratory analysis of six holding companies annual reports. Journal of Advertising 38(1): 109-122.
- Meckling WH, Jensen MC (1976) Theory of the firm: Managerial behavior, agency costs and ownership structure. Journal of Financial Economics 3(4): 305-360.
- Desai MA, Dharmapala D (2009) Taxes, institutions and foreign diversification opportunities. Journal of Public Economics 93(5-6): 703-714.
- Spicer A, McDermott GA, Kogut B (2000) Entrepreneurship and privatization in central Europe: The tenuous balance between destruction and creation. Academy of Management Review 25(3): 630-649.
- Economist (2012) Edging toward capitalism.
- John GR, Jana SR, Shackelford DA (2012) Research in accounting for income taxes. Journal of Accounting and Economics 53(1-2): 412-434.
- Desai MA, Dharmapala D (2007) Taxation and corporate governance: An Economic Approach, pp. 24.
- Scoot DD, Hanlon M, Maydew EL (2008) Long-run corporate tax avoidance. The Accounting Review 83(1): 61-82.
- Jeong BK, Yinghua L, Zhang L (2011) Corporate tax avoidance and stock price crash risk: Firm-level analysis. Journal of Financial Economics 100(3): 639-662.
- Slemrod J (2004) Are corporate tax rates, or countries, converging? Journal of Public Economics 88(6): 1169-1186.
- Gaertner FB (2014) CEO after‐tax compensation incentives and corporate tax avoidance†. Contemporary Accounting Research 31(4): 1077-1102.
- Powers K, Robinson JR, Stomberg B (2016) How do CEO incentives affect corporate tax planning and financial reporting of income taxes? Review of Accounting Studies 21: 672-710.
- Weisbach SM (1988) Outside directors and CEO turnover. Journal of Financial Economics 20: 431-460.
- Douglas JC, Wenxuan H, Edward L (2011) Corporate fraud, CEO turnover, and state ownership in China. SSRN Electronic Journal.
- Edward Fee C, Hadlock CJ, Pierce JR (2013) Managers with and without style: Evidence using exogenous variation. The Review of Financial Studies 26(3): 567-601.
- Cazier R, Rego S, Tian X, Wilson R (2014) The impact of increased disclosure requirements and the standardization of accounting practices on earnings management through the reserve for income taxes. Review of Accounting Studies 20(1): 436-469.
- Desai MA, Dharmapala D (2006) Corporate tax avoidance and high-powered incentives. Journal of Financial Economics 79(1): 145-179.
- Feldstein M (1999) Tax avoidance and the deadweight loss of the income tax. The Review of Economics and Statistics 81: 674-680.
- Mason PA, Hambrick DC (1984) Upper echelons: The organization as a reflection of its top managers. The Academy of Management Review 9(2): 193-206.
- Chyz JA (2013) Personally tax aggressive executives and corporate tax sheltering. Journal of Accounting and Economics 56(2-3): 311-328.
- Maydew EL, Hanlon M, Dyreng SD (2010) The effects of executives on corporate tax avoidance. The Accounting Review 85(4): 1163-1189.
- Olsen KJ, Stekelberg J (2015) CEO narcissism and corporate tax sheltering. Journal of the American Taxation Association 38(1): 1-22.
- Wilson R, Rego SO (2012) Equity risk incentives and corporate tax aggressiveness. Journal of Accounting Research 50(3): 775-810.
- James Chyz, Gaertner FB, Kausar A, Watson L (2014) Overconfidence and corporate tax policy. Review of Accounting Studies, pp. 44.
- Allison Koester TS, Daniel W (2016) The role of managerial ability in corporate tax avoidance. Management Science 63(10): 3147-3529.
- Gaertner FB, James CA (2018) Can paying too much or too little tax contribute to forced CEO turnover? The Accounting Review 93(1): 103-130.
- Avi-Yonah RS (2008) Corporate social responsibility and strategic tax behavior. Tax and Corporate Governance, pp. 183-198.
- Lanis R, Richardson G, Liu C, McClure R (2018) The impact of corporate tax avoidance on board of directors and CEO reputation. Journal of Business Ethics 160: 463-498.
- Sikka P (2010) Smoke and mirrors: Corporate social responsibility and tax avoidance. Accounting Forum 34(3-4): 153-168.
- Kerr G, Johnston K, Amanda B (2008) A framework of corporate social responsibility for advertising accountability: The case of Australian government advertising campaign. Journal of Marketing Communications 14(2): 155-169.
- Lanis R, Richardson G (2012) Corporate social responsibility and tax aggressiveness: An empirical analysis. Journal of Accounting and Public Policy 31(1): 86-108.
- Lanis R, Richardson G (2014) Is corporate social responsibility performance associated with tax avoidance? Journal of Business Ethics 127: 439-457.
- Hairul Azlan A, Salihu IA, Sheikh Obid SN (2014) Corporate ownership, governance and tax avoidance: An Interactive Effects. Procedia-Social and Behavioral Sciences 164: 150-160.
- Holt G, Barford V (2013) Google, Amazon, Starbucks: The rise of tax shaming, BBC News Magazine.
- Freeman ER, Wicks AC, Parmar B (2004) Stakeholder theory and the corporate objective revisited. Organization Science 15(3): 364-369.
- Badertscher BA, SPK, Katz Sp, Rego SO (2013) The separation of ownership and control and corporate tax avoidance. Journal of Accounting and Economics 56(2-3): 228-250.
- Slemrod J, Crocker KJ (2005) Corporate tax evasion with agency costs. Journal of Public Economics 89(9-10): 1593-1610.
- Frank MM, Lynch L, Rego SO (2009) Tax reporting aggressiveness and its relation to aggressive financial reporting. The Accounting Review 84(2): 467-496.
- Shuping C, Chen X, Cheng Q, Shevlin T (2010) Are family firms more tax aggressive than non-family firms? Journal of Financial Economics 95(1): 41-61.
- Agnes Cheng CS, Huang HH, Li Y, Stanfield J (2012) The effect of hedge fund activism on corporate tax avoidance. The Accounting Review 87(5): 1493-1526.
- John RG, Michelle H, Shevlin TJ, Shroff N (2014) Incentives for tax planning and avoidance: Evidence from the field. The Accounting Review 89(3): 991-1023.
- Hanlon M, Slemrod J (2009) What does tax aggressiveness signal? Evidence from stock price reactions to news about tax shelter involvement. Journal of Public Economics 93(1-2): 126-141.
- Bankman J (2004) The tax shelter problem. National Tax Journal 57(4): 925-936.
- Dyreng SD, Hanlon M, Maydew EL, Thornock JR (2017) Changes in corporate effective tax rates over the past 25 years. Journal of Financial Economics 124(3): 441-463.
- Karpoff JM, John RL (1993) The reputational penalty firms bear from committing criminal fraud. The Journal of Law & Economics 36(2): 757-802.
- Blouin J (2014) Defining and measuring tax planning aggressiveness. National Tax Journal 67(4): 875-900.
- Warfield TD, Cheng Q (2005) Equity incentives and earnings management. The Accounting Review 80(2): 441-476.
- Hanlon M, Heitzman S (2010) A review of tax research. Journal of Accounting and Economics 50(2-3): 127-178.
- Laguir I, Staglianò R, Elbaz J (2015) Does corporate social responsibility affect corporate tax aggressiveness? Journal of Cleaner Production 107: 662-675.
- Gallemore J, Maydew EL, Thornock JR (2014) The reputational costs of tax avoidance. Contemporary Accounting Research 31(4): 1103-1133.
- Firth M, Fung PMY, Rui OM (2006) Firm performance, governance structure, and top management turnover in a transitional economy. Journal of Management Studies 43(6): 1289-1330.
- Huson MR, Malatesta PH, Parrino R (2004) Managerial succession and firm performance. Journal of Financial Economics 74(2): 237-275.
- Wanfu L, Pittman JA, Wang ZT (2019) The determinants and consequences of tax audits: Some evidence from China. The Journal of the American Taxation Association 41(1): 91-122.
- Bertrand M, Schoar A (2003) Managing with style: The effect of managers on firm policies. The Quarterly Journal of Economics 118(4): 1169-1208.
- Blaylock B, Shevlin T, Wilson RJ (2012) Tax avoidance, large positive temporary book-tax differences, and earnings persistence. The Accounting Review 87(1): 91-120.
- Chun Keung H, Wu Q, Zhang H (2013) Is Corporate Social Responsibility (CSR) associated with tax avoidance? Evidence from Irresponsible CSR Activities. The Accounting Review 88(6): 2025-2059.
- Lanis R, Richardson G (2007) Determinants of the variability in corporate effective tax rates and tax reform: Evidence from Australia. Journal of Accounting and Public Policy 26(6): 689-704.
- Plesko GA (2003) An evaluation of alternative measures of corporate tax rates. Journal of accounting & economics 35(2): 201-226.
- Chang EC, Wong SML (2009) Governance with multiple objectives: Evidence from top executive turnover in China. Journal of Corporate Finance 15(2): 230-244.
- Shivdasani A, Kong JK (1995) Firm performance, corporate governance, and top executive turnover in Japan. Journal of Financial Economics 38(1): 29-58.
- Armstrong CS, Blouin JL, Larcker DF (2012) The incentives for tax planning. Journal of Accounting and Economics 53(1-2): 391-411.
- Hubbard TD, Christensen DM, Graffin, SD (2017) Higher highs and lower lows: The role of corporate social responsibility in CEO dismissal. Strategic Management Journal 38(11): 2255-2265.
- Kanaan F, Jenter D (2015) CEO Turnover and relative performance evaluation. The Journal of Finance 70(5): 2155-2184.
- Richardson G, Lanis R (2013) Corporate social responsibility and tax aggressiveness: A test of legitimacy theory. Accounting, Auditing & Accountability Journal 26(1): 75-100.
© 2022 Xue Chang. This is an open access article distributed under the terms of the Creative Commons Attribution License , which permits unrestricted use, distribution, and build upon your work non-commercially.
Editor In Chief


.jpg)


Signup for Newsletter

Quick Links
 Editorial Board Registrations
 Submit your Article
 Refer a Friend
 Advertise With Us
Our Recent Edition

.jpg)


Top Editors


.jpg)


.bmp)
.jpg)
.png)
.jpg)


.jpg)


.png)

.png)


.png)


Financial Support

Sponsors

Latest e-Books

Latest Video

 a Creative Commons Attribution 4.0 International License. Based on a work at www.crimsonpublishers.com.
Best viewed in
a Creative Commons Attribution 4.0 International License. Based on a work at www.crimsonpublishers.com.
Best viewed in