- Submissions

Full Text
Strategies in Accounting and Management
Aviation Industry Recovery from COVID-19: A Case for Malaysia
Geraldine Guarin1*, Samantha Joy Cinco2 and Adrian Jude Jumangit3
1University of Houston, USA
2Leuphana University of Lüneburg, Germany
3University of the Philippines, Philippines
*Corresponding author: Geraldine Guarin, University of Houston, USA
Submission:June 22, 2021Published: July 14, 2021

ISSN:2770-6648Volume2 Issue5
Abstract
The COVID-19 virus outbreak paralyzed travel and mobility in Malaysia, as with other countries across the globe. Mobility through air transport constitutes 12.5% of its transport sector or 0.5% of its gross domestic output without the mobility disruption. As with global air statistics, aviation in- dustry of Malaysia suffered throughout the pandemic. This paper uses the deep learning model Long Short Term Memory (LSTM) in forecasting the recovery period of the country’s aviation industry. Results suggest that the number of flights to and from Malaysia rebound to its pre-pandemic level within four to five months after the containment of the virus.
Keywords: LSTM; Deep learning; Big data; COVID-19; Aviation
JEL Codes: C5; C53; Z30
Introduction
Aviation industry has suffered deeply throughout the COVID-19 pandemic. The industry’s multiplier effect-from tourism to businesses cannot be emphasized further. In 2020, international travel lost an estimated USD 1.3trillion in export revenues and around 120 million tourism jobs were at risk [1]. Malaysia which has gained momentum as air transport hub of the Asia region, lost 17.1% of its GDP in 2020, which is deeper than the effect of the Asian Financial Crisis [2]. Strategically located in Southeast Asia, bordering the business hub of Singapore, and the Borneos, Malaysia’s economy benefits 0.5% of its Gross Domestic Product (GDP) from air transport1. Malaysia progresses on its plan to be a regional hub for aircraft maintenance and repairs. In the most recent report of the Malaysian Aviation Commission (MAVCOM), the country has exceeded its 100 million passenger traffic mark in 2018 owed to regional travel [3]. Significant progress was observed from 12.8 million traffic passenger in 2012 to 30.4million in 2011. Along with China, Japan and India, the country is 22nd largest civil aviation market, and a major transport hub of the region [4]. In 2020, the progress has been reversed. Transport Minister cited a RM13 billion projected losses of the aviation industry due to the mobility disruption. Its major players have consequently suffered and have undergone restructuring [5]. As of December 2020, 35% of the complaints received by the Aviation Commission is related to refunds, followed by cancellation, 21% [6]. MAVCOM’s most recent forecast showed further contraction of passenger traffic between 72.8% y-o-y and 75.7% y-o-y [2]. Perhaps, predicting when the pandemic will end has already met its obsolesce, but knowing when an economy will recover remains an important question for economic and business planners. As in previous outbreaks, non-linearity is observed in the transmission of COVID-19 [5] which motivated earlier research [7-9] to use neural network methods such as Recurrent Neural Networks (RNN), Long Short-Term Memory (LSTM), Gated Recurrent Unit (GRU) to understand the pandemic. LSTM is used in this paper to forecast the recovery of Malaysia’s aviation industry. LSTM is found viable due to its forecasting efficiency and higher predicting capacity, control for missing data, and long term dependency [10,11]. We also followed the UNWTO assumption that economic activity resumes after the pandemic is contained. The model used high frequency datasets such as flights data, mobility data, COVID-19 confirmed cases, stringency index, vaccination rate, among other economic data available.
Footnote
1Computed using the Multiregional Input Output Table (MRIOT) for 2019 from the World Input-Output Database (WIOD) and Asian Development Bank (ADB) MRIOT database.
Materials and Methods
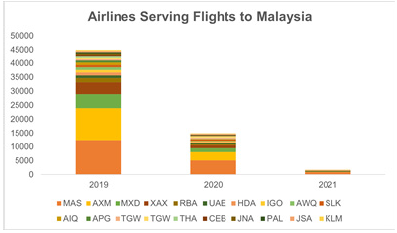
We used total flights to and from Malaysia as the target variable measuring aviation activity in Malaysia. Daily flights were collected from January 2019 to April 2021 through the Open Sky Network [12]. We processed the data to include only international flights to and from Malaysia, i.e. domestics flights within Malaysia were excluded from this analysis. Figure 1 shows the summary of total international flights to and from Malaysia for 2019-2021. Other than the vast literature on flights as measure of aviation industry, tourism industry, and corresponding multiplier effect to related sectors [12-17], the availability of the daily data matches the Covid variables which share the same frequency which is an attractive feature of time series forecasting (e.g., we limit the data manipulation to reconcile the variables). Using the same Open Sky flights data, airline statistics were also collected. As shown in Figure 2, there was a significant drop in flight levels and variety of airlines in Malaysia. Pre-pandemic, Malaysia Airlines (MAS) and Air Asia Red Cap (AXM) have dominated the industry. Their lead carried on to 2020, but not without losses [12]. The slowed air traffic led these Malaysian-based airlines to scale down operation, introduce salary cuts and unpaid leaves, and urgent restructuring exercise to stay afloat [5]. COVID-19-related variables were collected through the Our World in Data (OWID) [12], Google COVID-19 Community Mobility Reports [18]2, and Apple COVID-19 Mobility Trends Report [19]3 which also use daily frequency. We expect a negative relationship of confirmed COVID-19 cases, stringency index, and Google and Apple Mobility variables with the target variable as the economy will further restrict mobility with higher cases, stringency index is an indicator of level of strictness of the country where 100 is the most restrictive [20], and the mobility reports are also reflective of the on the ground effects of the stringency. We expected a positive relationship between vaccination rate and flights as vaccination is among the foremost measures in containing the spread of the virus and promoting herd immunity [21-24]. Adopting the assumption that recovery starts after the virus is contained is limited within Malaysia. In the model, the variable for new daily COVID-19 cases was decayed to 0 during the last week of the time series which is considered as the tail end of the pandemic. Various economic control variables were also used as a measure of economic health4. The model used -1 to fill missing data. The complete data set has an observation size of 851 with 18 variables. The multivariate used the 17 variables as features and flights as target variable. The univariate only used the target variable. Similar to earlier works which approached disease outbreaks using deep learning model [7-10], this paper utilized Long Short-Term Memory (LSTM) to understand and to forecast the Covid-19 out- break given its capacity to handle massive missingness [25], multivariate problems, and nonlinearities inherent to data on virus outbreaks [8-11]. Having input, forget and output gates, and the LSTM cell5 better handles long term dependencies, to moderate information flow, and to resolve the vanishing gradient problem6 which was present in earlier neural network models [26-29].
Figure 1: Total international flights to and from Malaysia plummeted from a monthly average of 9,081 in 2019 to 3,418 in 2020. Author estimations are based on daily reported flights [25].
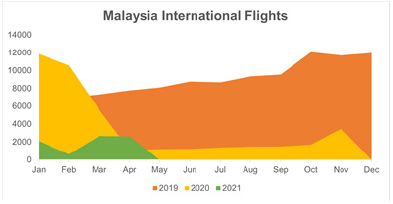
Figure 2: During the pandemic, even if there was a noticeable drop in the total number of flights to Malaysia, Malaysia Airlines (MAS) and AirAsia Red Cap (AXM) were able to maintain their market dominance. Other top players in Malaysian air industry include Malindo Air Express (MXD), AirAsia X Xanadu (XAX), Emirates (UAE), Royal Brunei Airlines (RBA), Dragonair/Hong Kong Dragon Airlines (HDA), IndiGo Airlines Ifly (IGO), China Airlines Dynasty (CAL), KLM Royal Dutch Airlines (KLM). Author estimations are based on daily reported flight [25].
Footnote
2Google mobility reports provide insights on the requests of google map users across different categories, namely retail
and recreation, grocer and pharmacy, parks, transit stations, workplaces, and residential, as a percentage against prepandemic
levels.
3Apple mobility reports provide insights from the apple map application across three categories-driving, transit, and
walking-as a percentage against pre-pandemic levels.
4Economic control variables used in this model include gross domestic product, property price index, price-to-earnings
ratio, equity index, and stock prices.
5sup>Each LSTM cell has forget gate,  , input gate,
  , output gate,
  , candidate state,
  , current state,
  , and output gate,
  moderates the flow of
information to the cell state [26-28].
6The gradients of the loss function approach zero as number of hidden layers increase resulting incapacity of the model
to train the parameters.
Results and Discussion
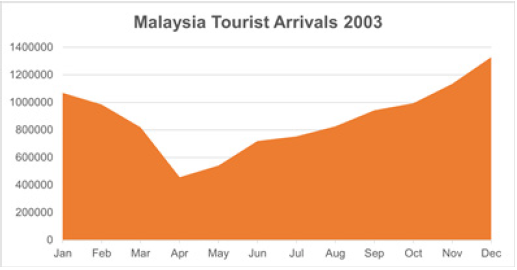
Forecast results of the univariate or using flights data alone, indicates that Malaysia will reach 58% of its 2019 average flights within 148 days after the end of the containment of the virus (rmse=33.7). Considering other factors affecting the aviation activity, features COVID-19 cases, vaccination rate, stringency index, Google mobility trends, Apple mobility trends, and economic control variables were used to predict flight levels. The fully connected multivariate network indicates that within 136 days after the containment Covid, the country recovers up to 97% of its 2019 average flights (rmse=30.6). Panel a of Figure 3 illustrates the results of the univariate and multivariate model. The result of the multivariate model is largely attributed to the level of stringency that Malaysia imposes on its citizens due to the spread of the virus following progress in vaccination and consumer confidence. The stringency index of Malaysia primarily contributed in the departure and arrival of flights in Malaysia with a relevance score of 28.23 in 2019, 6.87 in 2020, and -97.33 in 2021, measured using Shapely Additive Explanations (SHAP)7. As the country is more restrictive, there less mobility and therefore flights allowed. Other variables that contribute to the prediction include the financial indicators equity index, the price-to-earnings ratio negatively, and positively, respectively. The latter is an investor’s evaluation of a stock, while the former is a measure of stocks or shares’ performance. The difference in direction of the scores is plausibly attributed to the risk perception of individual who has limited life, and that of a company which has perpetual life [30]. The results of fully vaccination, and the Google mobility insights to the workplace follow our intuition that lack of travel to work is related to lack of mobility including aviation activities. Meanwhile, increase in vaccination, a direct measure of containing the virus, positively contributes in the predicted flight levels. While the mobility restrictions left a huge dent in the aviation industry, the positive outlook is merited by the country’s past history of rebounding from related crisis. As observed in Figure 4, there were also mobility disruptions in 2003 due to the outbreak of the Severe Acute Respiratory Syndrome (SARS). Tourist arrivals dropped 44% from March to April 2003 following the start of the SARS Outbreak [31]. However, one month after, arrivals to Malaysia already registered positive growth whereas global tourist arrivals took five months before it registered positive growth [32]. Though the depth of this crisis is incomparable to COVID-19, the tourism sector also suffered from this major outbreak. At the containment of the spread, the industry was able to make a rebound. Our results show that the situation will be similar at the containment of COVID-19.
Figure 3: y-axis of panel (a) refers to daily average international flights bound to and from Malaysia, and x-axis
refer to the forecast dates. y-axis of panels (b) refers to the relevance score of the predictors measured using Shapely
Adaptive Explanations (SHAP) where relevance scores refer to the contribution of the predictor to the average daily
flight arrivals for period 2019, 2020 and the most recent period of 2021 where Good Work refers to Google Mobility
report on movement to work place, TotVaccDoses refers to total fully vaccinated persons, and SIndex refers to
stringency index, and financial indicators PERatio refers to price to earnings ratio, and Equi In refers to equity
index. The economy’s average daily international flights to and from Malaysia averaged to 252.9 in 2019, 112.1 in
2020 and 59.8 up to the most recent period in 2021.
(a) International Flights actual vs forecast, Univariate and Multivariate LSTM
(b)2019-2021 Feature Importance, using SHAP
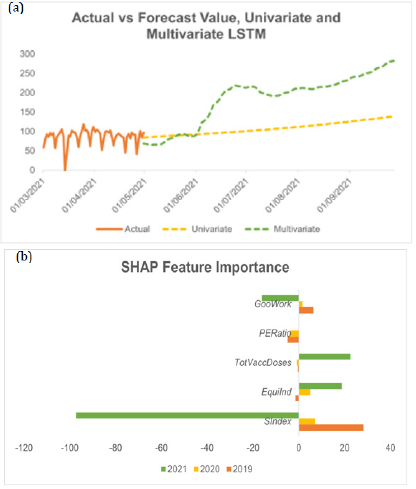
Figure 4: Tourist arrivals to Malaysia fell from a total of 819,376 arrivals in March to 456,374 in April 2003 as a result of the SARS outbreak.
Conclusion
The results of the LSTM model indicate that the number of flights to and from Malaysia will return to its pre-pandemic level four to five months after the end of the pandemic. Moreover, the primary contributor to this result is the stringency index of Malaysia. These results follow the narrative we are expecting. It is expected that flights would return to normal once quarantine or stringency measures implemented by the government institutions are lifted. This is in line with the 2019-2021 SHAP results which indicate that stringency index affects flights to and from Malaysia the most. In our model, the number of new COVID-19 cases was decayed to 0 in the last seven days signaling the end of the pandemic. Intuitively, this would lead to the lifting of stringency measures and an eventual return to the pre-pandemic situation. Further, the stringency index also affects flights negatively in 2021 as expected. Our study limited its analysis to Malaysia and did not include the top frequent flight origin and destination countries. Our study also did not disaggregate between flights that carry cargo and passengers or include flights data before January 2019, as these were not available, at least publicly. Moreover, data availability of most economic reports were lacking at the time of this writing, thus our analysis used alternative higher frequency data. This paper provides motivation for further investigation on travel corridors which would include the topflight origin and destination countries for Malaysia, use of a longer data set, employing hybrid or extensions of the LSTM model, and further the analysis on risk behavior of economic players during the crisis.
Footnote
7SHAP employs methodology to explain predictions of machine learning models, specifically it computes for the contribution of each feature or variable to the prediction [33].
References
- Yuh UNWTO (2020) Worst year in tourism history with 1 billion fewer international arrivals.
- MAVCOM (202) Malaysian aviation industry outlook waypoint report December 2020.
- MAVCOM (2019) 2018 annual report.
- Direct EM (2020) Malaysia industry research: Aviation industry.
- Farhana Sheikh YS (2020) The impact of covid-19 on Malaysia’s air-line industry.
- MAVCOM (2020) Mavcom consumer report July to December 2020.
- Chimmula VKR, Zhang (2020) Time series forecasting of covid-19 transmission in Canada using lstm networks. Chaos, Solitons & Fractals 135: 109864.
- Shahid F, Zameer A, Muneeb M (2020) Predictions for covid-19 with deep learning models of lstm, gru and bi-lstm. Chaos, Solitons & Fractals 140: 110212.
- Bandyopadhyay SK, Dutta S (2020) Machine learning approach for confirmation of covid-19 cases: Positive, negative, death and release. Medrxiv.
- Istaiteh O, Owais T, Al-Madi N, Abu-Soud S (2020) Machine learning approaches for covid-19 fore- casting. In 2020 International Conference on Intelligent Data Science Technologies and Applications (IDSTA), pp. 50-57.
- Koenecke A (2020) Applying deep neural networks to financial time series forecasting.
- Olive X, Strohmeier M, Lübbe J (2020) Crowdsourced air traffic data from the open sky network.
- Haitovsky Y, Salomon I, Silman L (1987) The economic impact of charter flights on tourism to Israel: An econometric approach. Journal of Transport Economics and Policy 21(2): 111-134.
- Smith SL (2014) Tourism analysis: A handbook, Routledge, UK.
- Macchiavelli A, Pozzi A (2015) Low-cost flights and changes in tourism flows: Evidence from bergamo orio al serio international. Tourism and Leisure, pp. 323.
- Lau H, Khosrawipour V, Kocbach P, Mikolajczyk A, Ichii H, et al. (2020) The association between international and domestic air traffic and the coronavirus (covid- 19) outbreak. Journal of Microbiology, Immunology and Infection 53(3): 467-472.
- Susilawati S, Falefi R, Purwoko (2020) Impact of covid-19’s pandemic on the economy of Indonesia. Budapest International Research and Critics Institute (BIRCI-Journal): Humanities and Social Sciences 3(2): 1147-1156.
- Google (2021) Covid-19 community mobility reports.
- Apple (2021) Covid-19-mobility trends reports.
- Hale T, Angrist N, Goldszmidt R, Kira B, Petherick A, et al. (2021) A global panel database of pandemic policies (oxford covid-19 government response tracker). Nature Human Behaviour 5(4): 529-538.
- Rosen B, Waitzberg R, Israeli A (2021) Israel’s rapid rollout of vaccinations for covid-19. Israel journal of health policy research 10(1): 1-14.
- Iboi EA, Ngonghala CN, Gumel AB (2020) Will an imperfect vaccine curtail the covid-19 pandemic in the us? Infectious Disease Modelling 5: 510-524.
- Lurie N, Saville M, Hatchett R, Halton J (2020) Developing covid-19 vaccines at pandemic speed. New England Journal of Medicine 382(21):1969-1973.
- Yong E (2020) How the pandemic will end. The Atlantic 25.
- Fouladgar N, Främling K (2020) A novel lstm for multivariate time series with massive missingness. Sensors (Basel, Switzerland), pp. 20.
- Aydin O, Guldamlasioglu S (2017) Using lstm networks to predict engine condition on large scale data processing framework. In 2017 4th International Conference on Electrical and Electronic Engineering (ICEEE) 281-285.
- Sherstinsky A (2020) Fundamentals of recurrent neural network (RNN) and long short-term memory (LSTM) network. Physica D: Nonlinear Phenomena 404: 132306.
- Hochreiter S, Schmidhuber J (1997) Long short-term memory. Neural computation 9(8): 1735-1780.
- Jeong JH, Yu BW, Lee DH, Lee SW (2019) Classification of drowsiness levels based on a deep spatio-temporal convolutional bidirectional lstm network using electroencephalography signals. Brain sciences 9(12): 348.
- Bauer RA (1967) Consumer behavior as risk taking.
- Malaysia T (2003) Tourist arrivals and receipts.
- UNWTO (2020) International tourism and covid-19.
- Lundberg SM, Lee SI (2017) A unified approach to interpreting model predictions. In: Guyon I, Luxburg UV, et al. (eds.), Advances in Neural Information Processing Systems 30, Curran Associates, Inc, New York, USA, pp. 4765-4774.
© 2021 Geraldine Guarin. This is an open access article distributed under the terms of the Creative Commons Attribution License , which permits unrestricted use, distribution, and build upon your work non-commercially.
 a Creative Commons Attribution 4.0 International License. Based on a work at www.crimsonpublishers.com.
Best viewed in


.jpg)


 Editorial Board Registrations
 Submit your Article
 Refer a Friend
 Advertise With Us
.jpg)


.jpg)


.bmp)
.jpg)
.png)
.jpg)


.jpg)


.png)

.png)


.png)


