- Submissions

Full Text
Strategies in Accounting and Management
Impact of 2008 Recession on Consumer Discretionary Sector
Atasi Basu*
Department of Business and Economics, Utica College, USA
*Corresponding author: Atasi Basu, Department of Business and Economics, Utica College, USA
Submission: January 16, 2020; Published: January 27, 2020

ISSN:2770-6648Volume1 Issue3
Abstract
I examine the effect of the 2008 economic recession on the current assets, sales, COGS, and day’s sales of companies in consumer discretionary sector. The study focuses on 19 companies in the consumer discretionary sector selected from S&P 500. The study finds similar effects of recession on different groups of companies except for day’s sales. The companies are grouped with the same four-digit SIC codes within the consumer discretionary sector. All groups show increased sales, inventory, COGS, and current assets after recession. Interestingly, some groups show faster day’s sales after recession and some show slowdown in the consumer discretionary sector.
Introduction
The economic recession in 2008, sometimes called the financial meltdown, affected all sectors of the industry in the USA. In the academic literature, there are many articles that examined the impact of the 2008 recession/meltdown [1-3]. Goodman & Mance [1] focus on labor, oil, construction-related manufacturing, real estate, mortgage finance, and retail furniture stores. Roubini’s article (2008) relates to twelve steps: financial systems related to subprime mortgages, prime mortgages, financial institutions, consumer debts like credit cards, auto loans, student loans, commercial real estate loan markets, regional and national banks, and more. Roubini [3] also discusses issues related to housing problem. Kerr’s paper (2011) presents three stories regarding 2008, related to corporate laws. Kerr [2] examines Bank of America, Citigroup, and General Motors. These papers do not show extreme changes of assets and incomes during 2008. My paper is based on Consumer Discretionary Sector related to simple accounting information.
Study objectives
In the present study, we examine how the 2008 recession affected the retail sector in the USA. As retailers directly serve consumers, a change in employment and income of consumers should have an immediate, direct effect on the accounting metrics of retailers. To study such effects, we examine a wide spectrum of retailers ranging from high-end entities such as Nordstrom to retailers such as Family Dollar that serve lower income consumers. The specific objective of our study is to identify which metrics were affected by the 2008 recession and which retailers were affected.
Data and results
I have collected data from nineteen retail companies included in the consumer discretionary sector of S&P 500. The companies include Macy’s, Kohl’s and J.C. Penney Company with SIC 5311; Abercrombie & Fitch, The Gap, Nordstrom, Ross Stores, The TJX Companies, Urban Outfitters with SIC 5651; Target, Dollar General, Family Dollar Stores, Big Lots, Dollar Tree with SIC 5331. Best Buy (SIC 5751), Bed Bath & Beyond (SIC 5700), Ralph Lauren (SIC 2320) are also included. The Home Depot and Lowe’s are included (SIC 5211) also. The study period runs from fiscal year 1999 to 2013. Other than current assets, sales, and COGS, I also study the day’s sales. Day’s sales are defined as Inventory*365/COGS which measures how many days it would take to sell the inventory. Interestingly, some SIC sectors show faster sales and some show slower sales after the recession within the consumer discretionary sector of S&P 500 list. Some of the companies included in this study are removed from the current S&P500 list. J.C. Penney, Big Lots, Family Dollar Stores, and Abercrombie & Fitch are not part of the current S&P 500 list anymore. Dollar Tree acquired Family Dollar Stores in July 2015. The current S&P500 list has 505 companies (Table 1).
Table 1: Summary of results.

The single (double) star in the above table indicates 5% (1%) significance. In all groups, sales, COGS, inventory, and current assets show increase after the recession. Companies within SIC 5311, SIC 5331, and SIC 5211 show increased sales after the recession but the increases are not significant. However, Best Buy, Bed Bath & Beyond, Ralph Lauren, and high end retailers show significant increase in sales. Increasing day’s sales indicate inventory is moving at a slower rate after recession. Best Buy (SIC 5751), Home Depot, Lowe’s (SIC 5211) show significantly slowdown moving inventory after the recession. However, Bed Bath & Beyond (SIC 5700), Target, Dollar Tree, Family Dollar Stores, Dollar General, Big Lots (SIC 5331), show significantly faster inventory move after the recession. SIC 5311 shows slower movement which is not significant. SIC 5651 and SIC 2320 show faster movements but the movements are not significant. Among these groups, SIC 5331 shows the fastest inventory movement after the recession whereas the sales, inventory, COGS do not show any significant increase. This group, SIC 5331, includes five low-end retail companies. SIC 5751 includes one company, Best Buy, which shows significant sales increase after the recession. However, it shows significant slower inventory movement after the recession. Significant increase in sales is expected to indicate faster inventory movement, however, Best Buy (SIC 5751) shows the opposite result. On the other hand, SIC 5331 show insignificant sales increase but inventory movement is significantly faster. Data are collected from fiscal year 1999 to 2013 for every company, except for Family Dollar Stores and Dollar Tree. For these two companies the data are collected for the fiscal years 2000-2013. The study period is partitioned in two segments. Fiscal years 1999 - 2007 are designated as “Before Recession” and 2008-2013 are designated as “After Recession”. The results are given in the following tables (Table 2-8). The above tables show similar effects of the recession on different groups of companies except for day’s sales. All groups show increased sales, inventory, COGS, and current assets after the recession. Interestingly, some groups show faster day’s sales after the recession and some show slowdown in the consumer discretionary sector. In the low-end retail stores (SIC 5331) the inventory movement is the fastest and highly significant after the recession. Bed Bath & Beyond also shows fast and significant inventory movement after the recession. The Home Depot, Lowe’s as well as Best Buy show significantly slower inventory movement after the recession. These results match with the economic downturn during the study period.
Table 2:
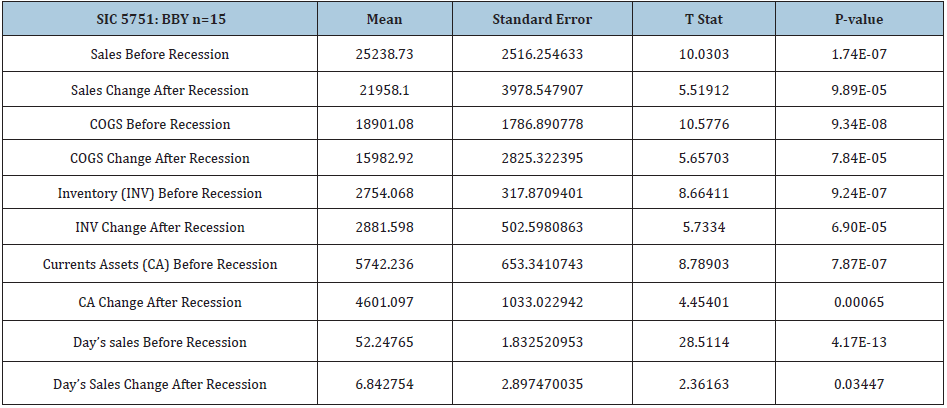
Table 3:

Table 4:

Table 5:

Table 6:

Table 7:
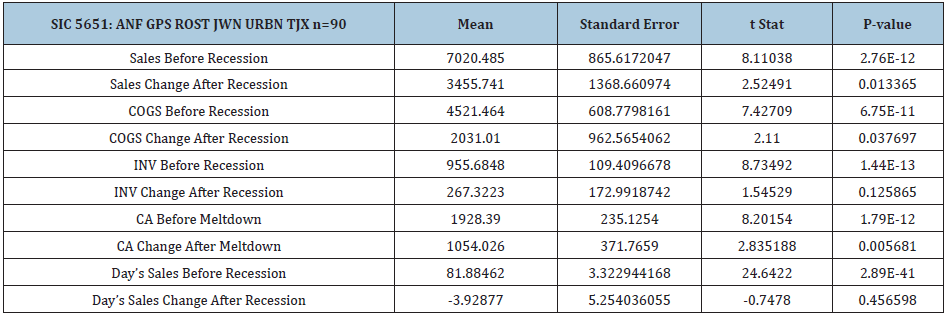
Table 8:

Graphs
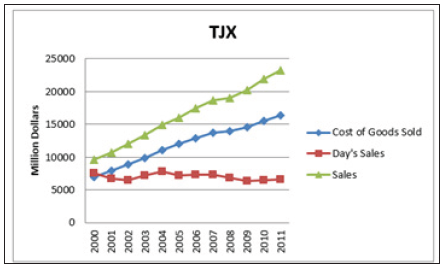
This section includes time series plots for five companies for concise presentation. The other plots will be provided upon request. The descriptive statistics in the above tables represent the difference in means but the time series plots provide graphical information over time. Time-series plots for sales show a downward trend for most retailers around 2005-2008. The day’s sales in inventory estimates how many days it will take to convert end of the period inventory to cash or accounts receivable. It is determined as Inventory*365/COGS. To include this ratio in the same graph as sales and COGS, I multiplied this ratio by 100 as Inventory*36500/ COGS. The graphs are based on data from fiscal years 2000-2011 (Figure 1-6). Macy’s, Kohl’s, and JC Penney show different results. In particular, JC Penney’s results are quite different from all other retailers. JC Penney’s senior management change seems to play a significant role. Interestingly, Kohl’s sales show a steady growth and do not show a significant drop in sales during 2007-2008. Macy’s sales as well as total assets started decreasing from 2006 and continued to decrease for several years. Macy’s sales started recovering from 2009 and total assets show increase from 2010 onwards.
I present two other companies’ graphs, Nordstrom and TJX Companies (Figure 7&8). They are given below. Nordstrom shows a slight decrease in sales during 2008 whereas TJX shows flat sales around that time. Nordstrom’s day’s sales shows a steady decrease until 2008 after which it stabilizes whereas TJX’s day’s sales shows a stable pattern throughout. Among the nineteen companies studied so far, Nordstrom, Ross Stores, Urban Outfitters, Abercrombie & Fitch show a lot of variation in days’ sales. The graphs of all nineteen companies have not been included for a concise presentation. These graphs of rest of the companies will be provided upon request. The above graphs provide the time-series results of five individual companies. It may be noted from the graphs that even when the sales of a company continued to grow, there is generally a change in the rate of growth around the time of the financial the recession.
Figure 1:
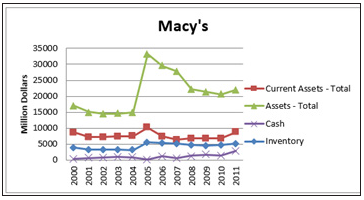
Figure 2:
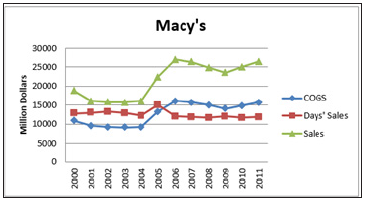
Figure 3:
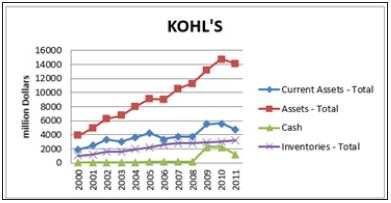
Figure 4:
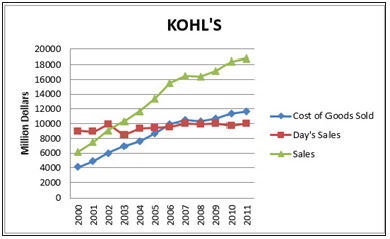
Figure 5:
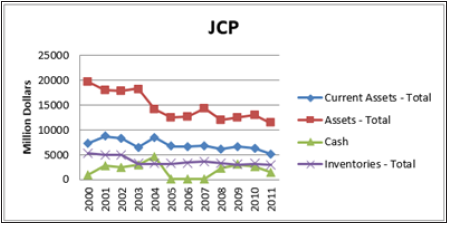
Figure 6:
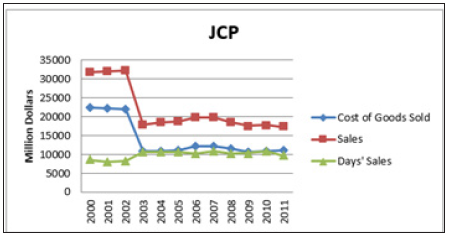
Figure 7:
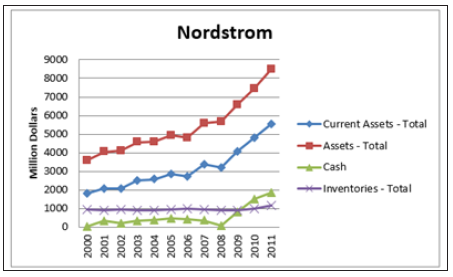
Figure 8:

Figure 9:
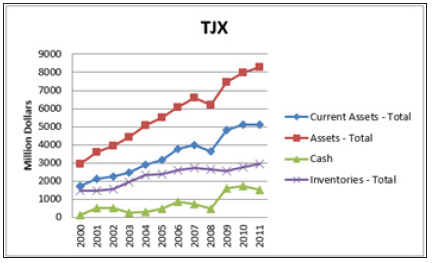
Figure 10:
Conclusion
The effects of the recession/financial meltdown on current assets, sales, COGS, and day’s sales are studied based on nineteen companies from the consumer discretionary sector of S&P 500. The companies are grouped within the same four-digit SIC codes. The study finds similar effects of the recession on different groups of companies except for day’s sales. All groups show increased sales, inventory, COGS, and current assets after the recession. Interestingly, some groups show faster day’s sales after the recession and some show slowdown in the consumer discretionary sector. In the lowend retail stores the inventory movement is the fastest and highly significant after the recession. Bed Bath & Beyond also shows fast and significant inventory movement after the recession. The Home Depot, Lowe’s as well as Best Buy show significantly slow inventory movement after the recession. These results match with the economic downturn during the study period.
References
- Goodman CJ, Mance SM (2011) Employment loss and the 2007–09 recession: An overview. Monthly Labor Review 3-12.
- Kerr JE (2011) The financial meltdown of 2008 and the Government's intervention: Much needed relief or major erosion of American corporate law? The Continuing Story of Bank of America, Citigroup, and General Motors. St. John’s Law Review 85(1).
- Roubini N (2008) The rising risk of a systemic financial meltdown: The twelve steps to financial disaster. RGE Monitor, A Roubini Global Economics Service.
© 2019 Atasi Basu. This is an open access article distributed under the terms of the Creative Commons Attribution License , which permits unrestricted use, distribution, and build upon your work non-commercially.
 a Creative Commons Attribution 4.0 International License. Based on a work at www.crimsonpublishers.com.
Best viewed in


.jpg)


 Editorial Board Registrations
 Submit your Article
 Refer a Friend
 Advertise With Us
.jpg)


.jpg)


.bmp)
.jpg)
.png)
.jpg)


.jpg)


.png)

.png)


.png)


