- Submissions

Full Text
Significances of Bioengineering & Biosciences
Atmospheric Study of Unusual Cloud & Rainfall Condition over Indonesia Area During the End of 2017-Beginning 2018
Paulus Agus Winarso*
State College Meteorology Climatology and Geophysics, Indonesia
*Corresponding author:Paulus Agus Winarso, State College Meteorology Climatology and Geophysics, Indonesia
Submission: July 12, 2018; Published: September 12, 2018

ISSN 2637-8078 Volume2 Issue4
Abstract
Unusual rainfall occurrence at the end of the year 2017 up to beginning 2018 over some places in Indonesia has occurred to reduce the flooding areas that they had developed since November-beginning December 2017. The unusual condition in term of the decreasing of the total daily rainfall over some places in Indonesia area for the period the end of 2017-the beginning 2018 as the period of maximum monthly rainfall of the peak wet season. It would be interesting to be studied using atmospheric and oceanographical data. The data would be collected from several sources of operational meteorological and oceanographical information from Indonesia (BMKG.) and Australia (BoM.). The study might start the studying atmospheric and oceanographic condition from the global- and regional- scales point of view and the dynamic of atmospheric and oceanographic.
Keywords: Rainfall; MJO; Meteorology; Cloud; Rainfall
Introduction
Indonesia area lies in the tropical areas under 11 degrees latitudes either in the Southern and Northern Hemisphere. As the tropical area composes waters and islands, the hot and wet condition would be the climatic condition such that this area could be so-called Maritime Continent area [1-3]. Climatologically, the area affected by the global phenomena of the so-called El Nino phenomena causing the dry condition and La Nina phenomena causing wet condition several places of the study area [1]. With respect with the MJO: Madden Julian Oscillation, as the new aspect in meteorological dynamic could be in terms of enhancing and unusual the convective cloud development over Indonesia Maritime Continent area [3-5]. MJO is intraseasonal fluctuation or wave in the tropical area including Indonesia Maritime Continent area to create most of the weather and climate over the tropical region as well as Indonesia area. MJO has eight distinct phases where MJO phases number of 3,4,5 and 6 could be over Indonesia Maritime Continent area and MJO phase number 7,8,1 and 2 could be over the tropical area of East Pacific Ocean up to West Indian Ocean. These eight distinct phases could be as MJO cycle. There were several studies to find that inter-annual variability of MJO to be partly linked with the ENSO cycle. The strong MJO is frequently observed during weak La Nina years or during ENSO (El Nino Southern Oscillation)-neutral years, meanwhile weak or absent MJO activity is frequently observed during strong El Nino years. Based on these previous studies might guide this study to investigate these global phenomena as the beginning of this study.
The regional perspective of this study applied the seasonal wind and rainfall condition over Indonesia maritime continent area [6,7], where during the period of end December 2017-beginning January 2018 the seasonal wind would be westerly wind coincide with the maximum patterns of the monthly rainfall. Another word, the entire period could be in term of the Westerly winds with frequent of the cloud and rainfall occurrences with supporting warm waters over the area [8]. Unfortunately, these meteorological and oceanographical could not occur because of less amount of the rainfall and below normal of the weekly and monthly sea surface temperatures over Indonesia waters. Normally during period December -January, warm waters, the convergence of the westerly winds in the lower level as part existing Inter-Tropical Convergence Zone (ITCZ.) and occurring rainfall daily toward maximum rainfall pattern over Java island and its surrounding area [9]. The abnormal or unusual meteorological and oceanographical might be investigated in this study.
The objective of this study is to explore the meteorological condition of unusual the rainfall during the end December 2017-beginning January 2018, where some unusual condition of the meteorological and oceanographical might presented in this study. Description of the global-local scales of the natural phenomenon would be applied to gather the meteorological mechanism causing the unusual of the total rainfall over several places. Follow up this effort, some operational charts describing the meteorological and oceanographical condition would be involved to describe the dynamics of the meteorological and oceanographical condition especially during the period end of December 2017-beginning 2018. Hopefully, some physical mechanism related to the unusual rainfall condition would investigate in this study.
Data and Method
The data of this study in term of the charts from both global and regional perspective would be used. They consist oceanographical data in term of the global sea surface temperature chart and meteorological data in terms time section of the global anomaly Outgoing Longwave Radiation (OLR), time section of the anomaly westerly wind in the lower level, spatial charts for regional scale of Indonesia Maritime Continent area of surface pressure and gradient wind.
The lack of the rainfall chart over Indonesia would be taken from the Meteorological Climatological and Geophysical Agency of Indonesia (BMKG, www.bmkg.go.di) to be selected one chart at the end December 2017 and the other chart at beginning January 2018. These charts would describe the lack of the rainfall where were measured by meteorological stations. Then explore the global and the regional scales of the meteorological and oceanographical condition would be applied to investigate the global and regional point of view the dynamical meteorology and oceanography. In this step would like to have a summary of the atmospheric and oceanographic phenomenon who might have been the relationship in the physical mechanism of the lack of the rainfall entire period of the end of 2017 and beginning 2018 over Indonesia Maritime Continent.
This study would like to investigate the physical mechanism of dynamic atmospheric and oceanographic processes in relation to the unusual total number of the rainfall over Indonesia Maritime Continent area. Where the dynamical meteorology and oceanography would be the main consideration to investigate the natural phenomenon causing the unusual cloud and rainfall during the end 2017 and beginning 2018. The proper method came from global up to regional approaches in this study.
Unusual Rainfall Study
Indonesia area has three types of climate based on the rainfall characteristic namely monsoonal-, local and Equatorial types. Both monsoonal- and equatorial types of the rainfall characteristic are majoring rainfall character of Indonesia area that every the end of the year up to beginning next year has much more rainfall, especially over monsoonal types to be the maximum number of the total monthly rainfall. The climate types based on the rainfall characteristic over Indonesia area to be shown in Figure 1 as follows [10]. The unusual atmospheric condition would be subjected anomaly values of the cloud cover and rainfall. Anomaly Values of Outgoing Longwave Radiation (OLR) would represent cloud cover, where positive anomaly values would be clear condition and negative anomaly values would be cloud cover condition. Anomaly rainfall would be taken from direct observation from meteorological observing stations spreading over Indonesia Maritime Continent area. Unusual cloud cover and rainfall in from December 2017 up to middle January would like 2018 would like to investigate using some operational meteorological charts from representative meteorological agencies. The Monthly Anomaly of the OLR last December 2017 would be taken from Bureau Meteorology Australia (BoM. Website http://www.bom.gov.au/). The monthly rainfall anomaly would be taken from Meteorological Climatological and Geophysical Agency of Indonesia (BMKG, website http://www.bmkg.go.id/) with additional each consecutive days during December 2017 and January 2018. Rainfall anomaly would be classified in three terms of below normal, normal and above normal condition. That most of the meteorological charts would be shown in the Figure 2-5 as follows.
figure 1:Climatic type of the Indonesia rainfall characteristic.
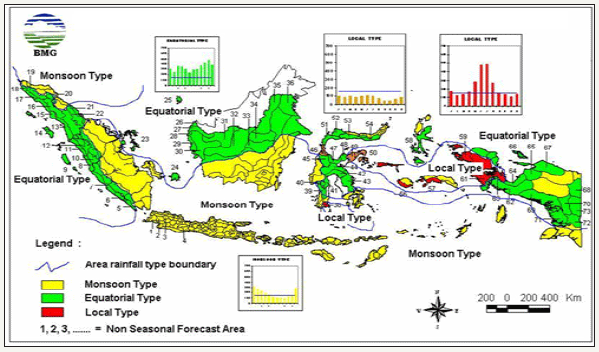
figure 2:Monthly anomaly of the OLR (Outgoing Longwave Radiation) represent cloudless (yellow and red color) and cloudyovercast (light-deep blue) (www.bom.gov.au).
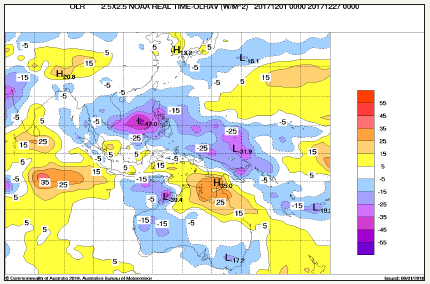
figure 3:Monthly anomaly of the rainfall on December 2017, where during December 2017 to be mostly normal up to below normal.
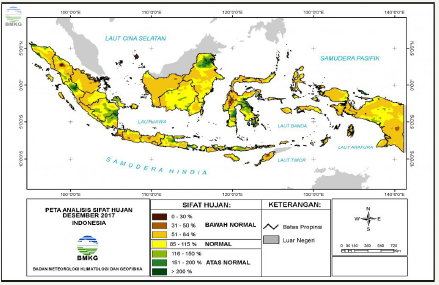
figure 4:Daily Rainfall over Indonesia on last December 27th, 2017 with no rainfall with grey color (www.bmkg.go.id).
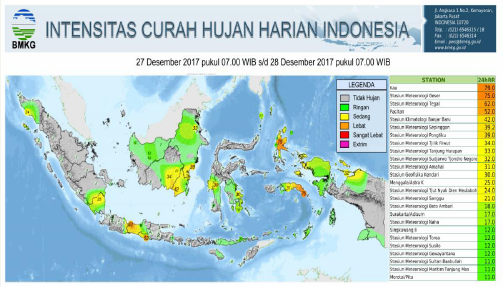
figure 5:Daily Rainfall over Indonesia on last January 15th, 2018 with with no rainfall with grey colour (www.bmkg.go.id).
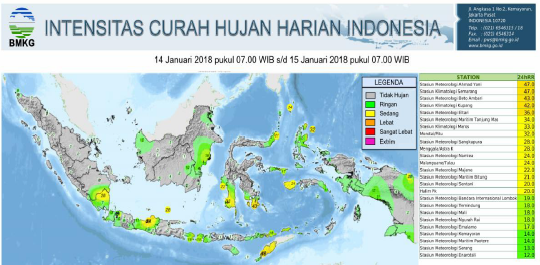
Anomaly monthly rainfall on December 2017 would be represented in the Figure 3 as follows. The daily rainfall over Indonesia area would be taken from the end of December 2017 as follows [11-13]. The daily rainfall data over Indonesia area would be taken from the middle of January 2017 as follows. From the discussion in above, an indication of unusual of the cloudy and rainfall had been investigated that cloudless and unusual rainfall occurred. This unusual rainfall might be the as unusual atmospheric condition with respect to the normal atmospheric condition that period December-February most of the area having climatic types of monsoonal- and equatorial types of rainfall characteristic with maximum rainfall. The unusual cloudy and rainfall during this period could study and discuss in the next discussion.
The Dynamical Meteorology and Oceanography Study
Further discussion, it would be better to apply the dynamical study of Meteorology and Oceanography for investigation various physical condition starting from global up to regional perspective to investigate some activities of the physical phenomenon whose are existed. The global physical phenomenon would like to study existing activities of the El Nino or La Nina, MJO with its equatorial waves and regional weather disturbances such as the surface trough, wind shear, and surface wind convergence/divergence. They would express the dynamical Meteorology and Oceanography on the period of December 2017 up to January 2018.
The global phenomenon would study the global scale of sea surface temperature anomaly during December 2017 to be taken from the Australian Bureau of Meteorology(www.bom.gov.au). This global sea surface temperature anomaly during December 2017 would be shown in the following Figure 6. From this Figure 6, most of the tropical region was in the below normal value comparing with mean monthly sea surface temperature as the normal value. It seems that entire tropical area (between 20 degrees latitudes either Northern/Southern Hemisphere) having below normal or cooling condition with an indication over the tropical area of East Pacific Ocean to have below -1 centigrade. It should represent the existing La Nina phenomena with above normal of the sea surface temperature over Indonesia waters. This warming of the waters might support other global phenomena such as Madden Julian Oscillation with several equatorial waves namely: Kelvin-wave (KW), Rossby-wave (RW) and Mixed Rossby Gravity-waves (MRGW). At the period of December 2017-January 2018, the Rossby-wave has frequently occurred than other waves such as KW and MRGW. Description of the double vortices extending in the equatorial area North-South to express existing equatorial waves during one day each during consecutive month of December 2017 and January 2018 would be shown in the Figure 6-8. The double vortices as expressing the equatorial Rossby wave has frequently occurred in the period December 2017 and January 2018 with impact the air mass distributes either Southern/Northern Hemisphere. This air mass distribution may frequently encourage the diverging of the wind during this consecutive period with cloudless and unusual of the daily rainfall at the period December 2017-January 2018.
Summary and Conclusion
Based upon this study, it can be summarized as follows,
A. The anomaly condition with positive values of the Outgoing Longwave Radiation (OLR) was on December 2017, it means the frequent clear sky condition to suppress daily rainfall over most the study area,
B. From study of the dynamics of oceanography and meteorology, it would find that there was activity of the La Nina phenomena and the equatorial wave of the so-called Rossby Wave. Where Rossby wave would be in term of the double vortices in the lower atmospheric level. Each vortex was located ones each hemisphere. The negative anomaly value of the sea surface temperature on December 2017 were observed that the below normal, it might have not so much moisture condition for cloudless condition over Indian Ocean and some places of Indonesia Maritime Continent area.
figure 6:The global anomaly sea surface temperature on December 2017 from Australian Bureau of Meteorology.
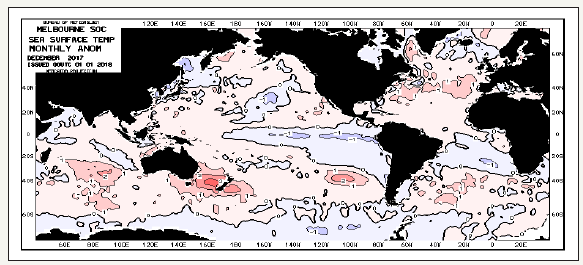
figure 7:Surface gradient last December1st 2017 at 00.00 UTC (www.bom.gov.au).

figure 8:Surface gradient last January third, 2018 at 00.00 UTC (www.bom.gov.au).

From this study would like to conclude that the dynamics of oceanography and meteorology during end 2017 up to beginning 2018 could be classified the unusual atmospheric condition over Indonesia Maritime Continent. Where the global phenomena of La Nina would not work properly to be due to divergence of the regional surface wind to encourage downward motion and then less cloud cover and rainfall.
Acknowledgement
Most of these meteorological and oceanograhical charts were taken from the websites from meteorological agencies namely Australian Bureau of Meteorology (BoM) and Badan Meteorologi Klimatologi dan Geofisika (BMKG) as Meteorological Climatological and Geophysical Agency from Indonesia. Author deeply thank to my wife Agustin Sukeni who always supports to produce the paper even without any funding.
References
- Bannu S, Takeuchi N, Kuze H (2003) Impact of the ENSO and IOD phenomena: Longterm analysis in Indonesia region. National Institute of Aeronautics & Space, Indonesia.
- Hendon H, Zhang C, Glick J (1999) Interannual variation of the madden Julian oscillation during Austral winter. J Climate 12: 2538-2550.
- Madden RA, Julian PR (1971) Observation of the 40-50 days tropical oscillation: A review. Mon Wea Rev 112: 814-837.
- Madden RA, Julian PR (1972) Description of the global-scale circulation cells in the tropic with a 40-50 days period. J Atmos Sci 29: 1109-1123.
- Madden RA, Julian PR (1994) Observation of the 40-50 days tropical oscillation. A Review. Mon Wea Rev 122: 814-837.
- Manabu DY (2016) Physical climatology of Indonesia maritime continent: An outline to comprehend observational studies. Atmos Res 178- 179: 231-259.
- Rahmat H, Shoichi K (2009) Influence of the Madden Julian oscillation on Indonesia rainfall variability in Austral summer. Int Jour Climatology 30(12): 1816-1825.
- Ramage (1968) Role of a tropical maritime continent in the atmospheric circulation. Monthly Weather Review 96(6): 365-370.
- Xiaoqing W, Xin-Zong L, Guan JZ (2003) Seasonal Migration of ITCZ across the equator: Why GCM can’t simulate it? Geoph Res Letter 30(15): 1029-1033.
- Zhang C (2005) Madden Julian oscillation. Review of Geophysics 43(2): 1-32.
- (BMKG): Badan Meteorologi, Klimatologi, Dan Geofisika.
- http://www.bom.gov.au/.
- http://www.cpc.ncep.noaa.gov/.
© 2018 Paulus Agus Winarso. This is an open access article distributed under the terms of the Creative Commons Attribution License , which permits unrestricted use, distribution, and build upon your work non-commercially.
 a Creative Commons Attribution 4.0 International License. Based on a work at www.crimsonpublishers.com.
Best viewed in


.jpg)


 Editorial Board Registrations
 Submit your Article
 Refer a Friend
 Advertise With Us
.jpg)


.jpg)


.bmp)
.jpg)
.png)
.jpg)


.jpg)


.png)

.png)


.png)


