- Submissions

Full Text
Research & Investigations in Sports Medicine
The Relationship Between Isometric Rate of Force Development and Isometric Maximum Strength Ratio to Dynamic Performance in Youth Athletes
Garrett C Giles and Greg Lutton*
School of Kinesiology, George Mason University, Manassas, USA
*Corresponding author:Greg Lutton, School of Kinesiology, George Mason University, Manassas, USA
Orcid:https://orcid.org/0000-0001-7973-6800
Submission: March 12, 2024;Published: April 15, 2024

ISSN: 2577-1914 Volume10 Issue3
Abstract
Background: The ability for an athlete to express force maximally and rapidly is key for athletic success. A popular method for obtaining key metrics involves holding a testing day or days, that ultimately are time consuming and fatiguing. These testing days usually provide one metric per assessment and do not demonstrate any interactions between assessments. This could poorly guide training programs as it might not provide the full picture of an athlete. A quick and accessible assessment method that can obtain key athlete data frequently is crucial for practitioners. Furthermore, the ratio between rate of force development and maximum strength obtained from said assessments could better dictate training plans.
Purpose: To identify the relationship between isometric Rate of Force Development (RFD) and isometric maximum strength ratio to dynamic performance assessments and determine if thresholds exist that support superior performance.
Methods: Data was obtained from nineteen subjects in the youth athletic population (n=19 (male n=14, female n=5)), age: 14±2.49, height:165.46±12.75cm, mass: 55.39±19.77kg (lean body mass: 47.20±15.99kg, percent body 15.11±0.085%) and included various backgrounds and sports including lacrosse, basketball, football, swimming, motorcycle racing, track, soccer and baseball. Data was procured retrospectively. Assessments included body composition (total body mass, fat mass, fat-free mass, and height), isometric mid-thigh pull RFD (IMTPrfd), isometric mid-thigh pull max strength (IMTPmax), counter movement jump height (CMJ), drop jump height and ground contact time (DRJh and DRJgct), maximum sprint time at 10 and 20 meters (Sprint10m and Sprint 20m) and change of direction (COD5-10-5). Statistics were run for all participants and then broken into three groups consisting of high, medium, and low threshold groups. A Pearson correlation coefficient was run to determine strength and direction of linear association between variables and p-value to determine level of significance.
Results: The low ratio threshold group had a moderate negative relationship with COD5-10-5 (r=-0.62). This was found too not be statistically significant. The low ratio threshold group also had a low negative correlation (r=-0.34) with DRJgct. This was also found too not be statistically significant. The other variables (CMJ, DRJh, Sprint10m and Sprint20m) when compared to the low threshold group yielded negligible correlations (r<0.30) that were not statistically significant. The medium threshold group compared to traditional field tests yielded negligible correlation (r<0.30) across all variables (CMJ, DRJh, DRJgct, Sprint10m, Sprint20m, COD5-10-5). Additionally, no variables were statistically significant. The high threshold group of IMTPrfd:IMTPmax had a very high positive correlation with CMJ (r=0.91) while unfortunately having no statistical significance. Additionally, there was a moderate positive correlation with IMTPrfd:IMTPmax and DRJh (r=0.63), again no statistical significance was found. There were high to very high negative correlations found between IMTPrfd:IMTPmax and Sprint10m (r=-0.72), Sprint20m(r=-0.79) and COD5-10-5 (r=-0.92). There was statistical significance for any other variables. When DRJgct was compared to the high threshold group there was a negligible correlation (r<0.30) that was not statistically significant.
Conclusion: Our findings suggests that the ratio between IMTPrfd:IMTPmax does correlate to dynamic performance and furthermore there are thresholds that exists that could be utilized to better dictate an athlete’s training program.
Practical application: Practitioners working with youth athletes should take into consideration using an assessment method such as the IMTP to evaluate their athlete’s performance and progress. Additionally, practitioners should consider the ratio between IMTPrfd:IMTPmax of their athletes to identify whether an athlete requires a specific training stimulus to enhance performance capabilities.
Introduction
The ability to produce maximal force is an essential quality for athletes to reach their maximal athletic potential, thus deeming maximal strength an important bio motor ability to assess and monitor [1]. Additionally, the ability for an athlete to express strength rapidly in short time intervals is also critical for athletic performance and success in an athlete’s respective sport [2,3]. Rapidly producing force is typically referred to as the Rate of Force Development (RFD) and is essential for optimal performance, arguably more so than maximal force production alone, in activities involving sprinting, jumping and change of direction [4,5]. Such athletic attributes are found in many common fields and court sports (i.e., basketball and soccer).
Recent advancements and access to technology have allowed more practitioners to utilize devices, such as dynamometers, that give them the ability to obtain valuable information regarding force- time curves such as maximal force development and RFD at various time intervals. A common exercise utilizing a dynamometer that has been proven reliable and valid for assessing force-time curves is the Isometric Mid-Thigh Pull (IMTP) [6-9]. The IMTP has been reported to have a strong association between maximum force development and One Rep Maximum (1RM) testing in back deadlifting, weightlifting, and back squat, which are traditional lower body strength and power assessments commonly used to track athletic performance [10-12]. More recently, there has been an increase in research that has demonstrated a strong association between RFD during the IMTP and vertical jumping, horizontal jumping, sprint time and change of direction performance [2,4,11]. IMTP testing allows for data capture at time intervals that are similar to ground contacts times of jumping, sprinting and change of direction (i.e., ≤200ms) [2,4,11]. This highlights the usefulness of IMTP to assess both maximum strength and RFD, as well as justify the relationship between maximum strength and RFD to dynamic performance.
Furthermore, the IMTP is a quick and relatively easy assessment that requires little to no skill to perform [6,13]. Several studies demonstrate learning the IMTP can be done in one session thus IMTP test familiarity can be conducted on testing day without negatively impacting the integrity of the assessment [6,8]. Due to the strong relationship between IMTP RFD performance and dynamic performance, it could be advantageous for strength or sport coaches to utilize the IMTP as it requires little to no skill, is a safe movement, and saves time and energy of both coaches and athletes. The use of IMTP and athletics has gained popularity over the past decade in sports science research. Due to financial reasons and access to technology most of the current research reflects collegiate and professional athletes. Therefore, the purpose of this research paper is twofold. The first aim is to determine if there is a relationship between RFD and dynamic performance assessments in youth athletes. The second aim is to determine if there are thresholds that exist between the ratio of RFD to maximum strength and if those threshold classification ratios correlate to dynamic assessment performance.
Methods
Subjects
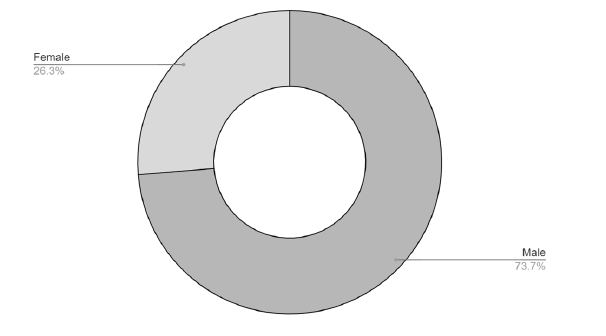
The subjects (n=19 (male n=14, female n=5)), age: 14±2.49,
height:165.46±12.75cm, mass: 55.39±19.77kg (lean body mass:
47.20±15.99kg, percent body 15.11±0.085%) included in this study
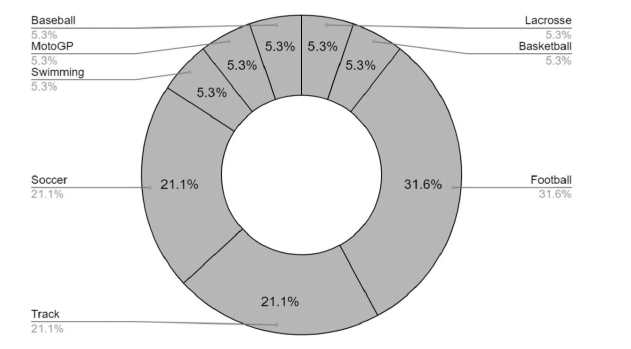
came from various backgrounds and sports including lacrosse,
basketball, football, swimming, motorcycle racing, track, soccer
and baseball. The investigation was approved by George Mason
University’s internal review board. All testing was conducted and
supervised by certified strength and conditioning specialist through
the National Strength and Conditioning Association (NSCA).
Inclusions
A. Currently participating in an organized sport
B. Younger than 20 years old
Exclusions
a) Severe injury in past 6 months that has limited or paused
training completely.
b) Currently rehabbing an injury that limits training.
c) Limitations or restrictions by primary doctor.
d) Not enrolled or planning to enroll in sport.
e) Sedentary and no sports training.
Experimental design
A retrospective analysis of the data was utilized to explore the relationship between the ratio of RFD and maximal strength and dynamic performance related to traditional field testing. Part of the regular onboarding for youth athletes at Exsurgo Strong and Fit (Ashburn, Va) includes body composition testing (height, mass, lean and fat body mass), strength and RFD testing (IMTP), jump testing (counter movement jump and drop jump), sprint testing (acceleration and maximum velocity), and change of direction testing. All testing for each individual was conducted on the same day, in the same facility, under the same supervision, and with the same equipment. Since new athletes join the training facility during different time periods, each athlete’s data collection took place on different days throughout the summer of 2022. After the onboarding was complete and the data was recorded, the researchers retroactively went through looking for relationships regarding the variables of interest.
Validity and reliability
The InBody 570 (Cerritos, CA) multi-frequency bioelectrical impedance analysis is a quick and easy-to-use instrument that has been studied and tested thoroughly to be a valid and reliable body composition measuring tool. When compared to air displacement plethysmography, the InBody 570 demonstrated a strong correlation for total body weight (rs(35)=0.99, P<0.0001) and fat mass (r (35)=.93, P<.0001), with the lowest correlation examined for fat-free mass (r (35)=.93, P<.0001) [14]. Additionally, when the InBody 570 was compared to a dual-energy x-ray absorptiometry analysis body fat percentages were significantly related (r=.94, P<0.0001) [15]. The repeatability of body composition results is also well supported, with one study demonstrating a small coefficient of variation (<3.0%) [16]. Ultimately, the InBody 570 multifrequency bioelectrical impedance can be used as a quick, easy, and cost-efficient method for accurately and reliably measuring body composition. The GStrength (Exsurgo Technologies, Ashburn, VA) is a commercially available strain gauge that is able to measure RFD at various time intervals, and maximal force production in many body positions or exercise movements. A study conducted by Ripley and McMahon [17], utilized calibrated weight from the International Weightlifting Federation and found a perfect relationship between the known loads and strain gauge (r=1.00, p<0.001).
Additionally, during the data collection the weights hung from the strain gauge for 5 seconds and there were only small trivial differences between the first and last second. The GStrength device is a valid method to assess RFD and maximal force production. The GFlight (Exsurgo Technologies, Ashburn, VA) is a commercially available tool to measure jump height by utilizing a high-density photoelectrical beam that determines jump height through interruption of the beams with your feet. When the GFlight is compared to other devices that measure jump height like the Just Jump Mat, Push Bands, My Jump App and force plates there was a strong relationship regarding jump height performance [18]. This indicates that GFlight is a valid tool to measure jump height. The GSprint (Exsurgo Technologies, Ashburn, VA) is also a commercially available tool that is used as a timing gate to measure sprint and change of direction ability. There are no current validation or reliability studies on the GSprint. However, the GSprint timer is based off a 32Hz crystal oscillator that has near atomic clock precision.
Procedures
Prior to any exercise testing all participants were informed
on the tests that will take place, the order, duration, demand, and
overall, what their testing day will consist of. All participants were
informed about body composition testing and informed on the
proper protocol to ensure the best results and were encouraged
to bring a light snack to consume after the body composition
testing and before the start of the exercise testing. The participants
arrived at Exsurgo Strong and Fit (Ashburn, VA) on their scheduled
assessment day. Upon arrival participants were again given an
explanation of the testing protocols and procedures.
Body composition: The InBody 570 was used to measure body
composition. The main metrics were total body mass (kg), lean body
mass (kg), and body fat percentage. Height was measured using a
stadiometer. The participants were given a general and dynamic
warm-up lasting no longer than 10-15 minutes. The assessments
that were investigated and tested proceed in the following order.
Each assessment was given 1-2 minutes of rest between each
repetition and participants were also given 2 minutes of rest
between each individual assessment.
IMTP Max: The GStrength was used to measure maximum
strength of the participants during an IMTP strength assessment.
An explanation was given on how to perform the test, as well as
proper form to reduce the risk of injury. The participants then
completed 3 gradual ramping efforts for 5 seconds followed by
3 seconds of rest in succession. This was to increase familiarity
with the test and ensure proper technique on form and the test
itself was used. After the practice attempts a two-minute break
was allowed for recovery. The participants then began performing
the IMTP using maximum effort. After each attempt participants
were allowed 1-2 minutes of rest. Attempts were continued until
participants had two consecutive decreases in performance.
RFD: The GStrength was used to measure RFD within 200ms of
the participants during an IMTP force production assessment. An
explanation was given on how to perform the test, as well as proper
form to reduce the risk of injury. The participants then completed
3 gradual ramping efforts which were performed as quickly as
possible followed by 3 seconds of rest in succession. This was to
increase familiarity with the test and ensure proper technique on
form and the test itself was used. After the practice attempts a
two-minute break was allowed for recovery. The participants then
began performing the IMTP using maximum effort to produce as
much force as quickly as possible. After each attempt participants
were allowed 1-2 minutes of rest. Attempts were continued until
participants had two consecutive decreases in performance.
CMJ: The GFlight was used to measure jump height. An
explanation was given on how to perform the test, as well as proper
form to reduce the risk of injury. The participants completed 1-2
submaximal practice attempts to ensure proper form was used and
to ensure they understood how the test captures their jump height.
After a 2-minute break, the participants performed maximum jumps
with 1-2 minutes of rest between attempts until two consecutive
attempts decreased in performance.
Drop jump: The GFlight was used to measure jump height. An
explanation was given on how to perform the test, as well as proper
form to reduce the risk of injury. A 30cm box was used with a line of
tape on the ground for participants to target while they stepped off
the box as well as landing their jump. The participants completed
1-2 submaximal practice attempts to ensure proper form was
used and to ensure they understood how the test captures their
jump height. After a 2-minute break, the participants performed
maximum jumps with 1-2 minutes of rest between attempts until
two consecutive attempts decreased in performance.
Sprints: The GSprint was used to capture sprint times at both
10 and 20 meters. An explanation was given on how to perform
the test, as well as proper form to reduce the risk of injury. The
participants completed 1-2 submaximal practice attempts with
1 minute of rest in between, followed by a 2-minute rest before
maximal attempts. The participants then completed maximum
effort sprints through the GSprint timing gates at 10 and 20 meters
until their performance decreased in consecutive attempts.
Change of direction: The GSprint was used to capture change
of direction ability of the participants during a 5-10-5-yard agility
test. An explanation was given on how to perform the test, as well
as proper form to reduce the risk of injury. The participants were
allowed 1-2 submaximal practice attempts to become familiar
with the test, which was followed by a 2-minute rest period. The
participants then performed maximum effort attempts with 1-2
minutes of rest between attempts until they had two consecutive
decreases in performance. All data was saved in the Exsurgo
Performance System (EPS) for analysis.
Data preparation
Data was captured using the EPS and devices. Data was exported from EPS to google docs. Data was formatted for ease of use in R studio. This was done by ensuring missing data was left as empty cells (Figure 1). Values from google docs were exported as values only so as to not introduce formula reference errors. Data was imported into RStudio 2022.07.2+576 (Boston, MA) using the import dataset function and mapping na=empty. Data was reviewed multiple times to ensure unaltered data was used.
Figure 1:Gender distribution.
Statistical analysis
Statistical analysis was done using RStudio. A correlation matrix was produced to assess relationships between all variables. Depending on the level of correlation associations and their significances, selected variables were further investigated to better understand which variables and combinations of variables influenced each other. Pearson correlation coefficients were used to assess the relationship between two sets of variables. ANOVA was performed to analyze Age Group with RFD to maximum strength ratios. Age groups were created using birthdate and varied by a difference of two years. A second ANOVA was performed to analyze “high, medium, and low” thresholds. These thresholds were classified using the 5th, 33rd, 66th, 95th of each assessment (Figure 2). If significant variance was found during the ANOVA, Tukey HSD was performed to identify which pairs were significant. All data was compared for normality.
Figure 2:Sport distribution.
Result
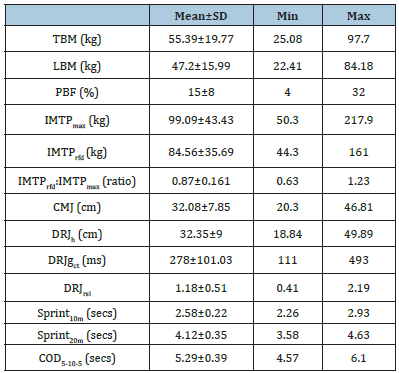
All variables were then analyzed in a correlation matrix to identify associations. These included correlations of Total Body Mass (TBM) (kg), Lean Body Mass (LBM) (kg), Percent Body Fat (PBF) (%), IMTPmax (kg), IMTPrfd (kg), CMJ (cm), DRJh (cm), DRJgct (ms), DRJrsi (ratio), Sprint10m (secs), Sprint20m (secs) and COD5-10- 5 (secs). Additionally, variables were analyzed following initial investigation of variables in Figure 3. Variables of further interest and deemed worthy of additional investigation included the ratio between IMTPrfd:IMTPmax, IMTPrfd:IMTPmax (low threshold), IMTPrfd:IMTPmax (medium threshold) and IMTPrfd:IMTPmax (high threshold). The results of the analysis of these variables are presented in Figure 4 and Table 1.
Figure 3:Age distribution.
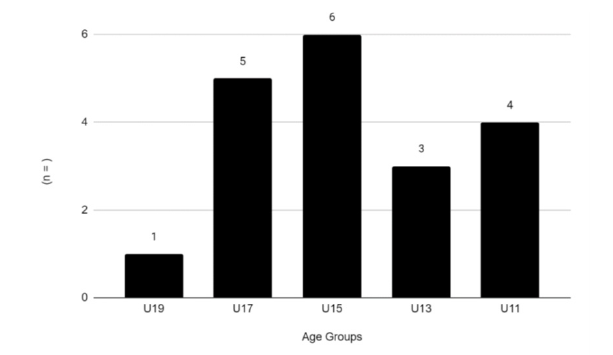
Figure 4:Correlation matrix of all variables. Significance: ***p<0.001, **p<0.01, *p<0.05.
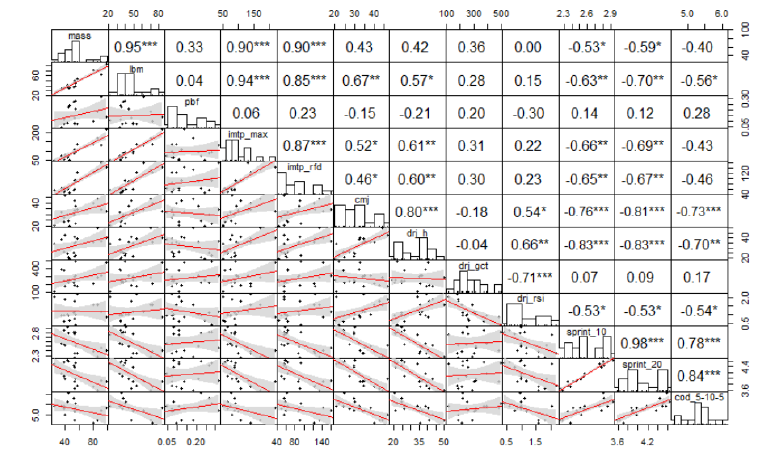
Table 1:Descriptive statistics of all data gathered.
IMTPrfd
There was a moderate positive correlation that was statically significant (p<0.01) found between IMTPrfd and DRJh (r=0.60). IMTPrfd also had a statistically significant (p<0.05) low positive correlation with CMJ (r=0.46). There was a moderate negative correlation that was statistically significant (p<0.01) found between IMTPrfd and Sprint10m (r=-0.65) and between IMTPrfd and Sprint20m (r=-0.67). IMTPrfd also had low negative correlation that was not found to be statistically significant with COD5-10-5 (r=-0.46). IMTPrfd and DRJgct was found to have negligible correlation to low positive correlation (r=0.30) that was not statistically significant.
IMTPrfd:IMTPmax
The initial findings when attempting to correlate the IMTPrfd:IMTPmax ratio to traditional field tests yielded negligible correlation (r<0.30) across all variables (CMJ, DRJh, DRJgct, Sprint10m, Sprint20m, COD5-10-5). Additionally, no variables were statistically significant.
IMTPrfd:IMTPmax (Low)
The low threshold group of IMTPrfd:IMTPmax had a moderate negative relationship with COD5-10-5 (r=-0.62). This was found to not be statistically significant. The low ratio threshold group also had a low negative correlation (r=-0.34) with DRJgct. This was also found to not be statistically significant. The other variables (CMJ, DRJh, Sprint10m and Sprint20m) when compared to the low threshold group yielded negligible correlations (r<0.30) that were not statistically significant.
IMTPrfd:IMTPmax (Medium)
The findings when attempting to correlate the medium threshold group to traditional field tests yielded negligible correlation (r<0.30) across all variables (CMJ, DRJh, DRJgct, Sprint10m, Sprint20m, CO D5-10-5). Additionally, no variables were statistically significant.
IMTPrfd:IMTPmax (High)
The high threshold group of IMTPrfd:IMTPmax had a very high positive correlation with CMJ (r=0.91) while unfortunately having no statistical significance. Additionally, there was a moderate positive correlation with IMTPrfd:IMTPmax and DRJh (r=0.63), again no statistical significance was found. There were high to very high negative correlations found between IMTPrfd:IMTPmax and Sprint10m (r=-0.72), Sprint20m (r=-0.79) and COD5-10-5 (r=-0.92). There was statistical significance for any other variables. When DRJgct was compared to the high threshold group there was a negligible correlation (r<0.30) that was not statistically significant.
IMTPrfd:IMTPmax Ratios
IMTPrfd:IMTPmax were calculated by IMTPrfd and divided by IMTPmax for each subject. The mean ratio found was 0.87±0.161 with a minimum of 0.63 and a maximum of 1.23.
IMTPrfd:IMTPmax Ratios and Age
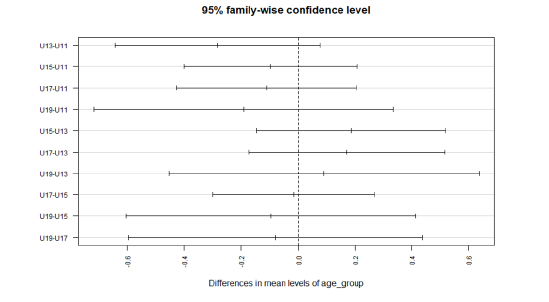
Using the IMTPrfd:IMTPmax ratios previously calculated, ANOVA results of RFD:STR and Age groups showed no significant differences (f=1.584, p=0.233). Tukey’s HSD showed no pairwise variances with 95% confidence interval as shown in Figure 5.
Figure 5:Plot of Tukey’s HSD comparison of means between IMTPrfd:IMTPmax ratios and age groups.
IMTPrfd:IMTPmax Ratio Classifications
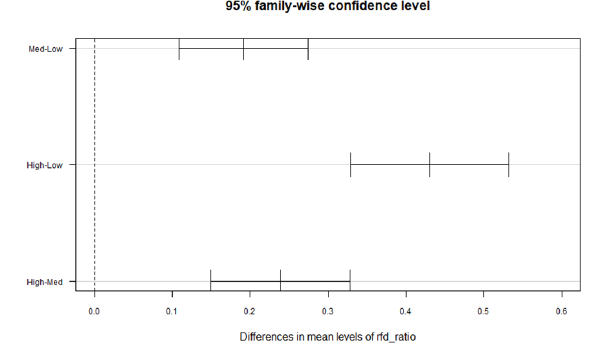
Using the calculated IMTPrfd:IMTPmax Ratios, the values were then categorized by assigning Low to ratios <0.75, Medium to ratios ≥0.75 and <1.0, and High to ratios ≥1.0. These classifications yielded n=5 athletes in the Low classification, n=10 for the medium classification and=4 in the High classification. The ANOVA results of IMTPrfd:IMTPmax to these classifications were found to be significant (f=59.85, p=<0.001). Further analysis using Tukey’s HSD showed results were significant amongst each of the groups Med-Low (p< 0.001), High-Low (p<0.001) and High-Med (p<0.001). The differences in means are further shown by Figure 6 as the values of each comparison of means is outside the 95% confidence interval.
Figure 6:Plot of Tukey’s HSD comparison of means between IMTPrfd:IMTPmax ratios and ratio classifications.
Discussion
The aims of the present study were to determine the relationship between IMTPrfd and dynamic performance assessments in youth athletes as well as determine if thresholds exist between the ratio IMTPrfd and IMTPmax and if those classification ratios correlate to dynamic testing performance. The result from this study indicated that IMTPrfd was statistically significant with a moderate correlation to CMJ, DRJh, Sprint10m and Sprint20m (Table 2). IMTPrfd was also found to have a moderate correlation to COD5-10-5 and a low correlation with DRJgct, however neither were found to be statistically significant (Table 2). The second aim of this study was to determine if IMTPrfd:IMTPmax ratio thresholds correlated to dynamic assessment performance. Interestingly, the High threshold group had varying correlation levels to all dynamic assessment variables except for DRJgct, however none of the correlations were found to be statistically significant. The Low threshold group had varying levels of negative correlation to DRJgct and COD5-10-5 and the medium threshold group had no level of correlation to any dynamic assessments. Again, neither the Low or Medium threshold groups had any statistically significant correlations. The moderate correlations found between IMTPrfd and CMJ, DRJh, Sprint10m and Sprint20m agree with previous studies investigating the relationship between IMTPrfd and variables such as strength, speed, agility, lower body power, and COD. Wang and colleagues19 found RFD between 30-50ms had a moderately negative correlation (r=-0.570 and -0.527) with sprint times between 5 and 40 meters. Additionally, they found RFD between 30-100ms had a statistically significant moderate negative correlation (r=-0.518 to -0.528, p’s<0.05) with probability times [19].
Table 2:Correlation of IMTPrfd, IMTPrfd:IMTPmax ratio, IMTPrfd:IMTPmax ratio (Low), IMTPrfd:IMTPmax ratio (Medium),IMTPrfd:IMTPmax ratio (High) and traditional field assessments of bio motor abilities.

Significance: **p<0.01, *p<0.05.
Another study that also supports the relationships found between IMTPrfd and dynamic performance variables concluded that RFD at 100ms was inversely related to 10-meter sprint times (r =-0.54, p<0.01) and positively correlated to CMJ height (r=0.43, p<0.01) [20]. However, there are studies that have found a lack of or no correlation to IMTPrfd and CMJ height, potentially indicating RFD during the stretch-shortening cycle is not significantly related to dynamic performance [21,22]. Wilson et al. [21] concluded that a jump consisting of concentric only muscle contractions did significantly relate to dynamic performance. Suggesting that isometric RFD tests might not be ideal to understand dynamic performance but RFD during concentric muscular contractions can better determine relationships with dynamic performance. To the knowledge of the researchers, no previous study has investigated the ratio between IMTPrfd:IMTPmax. Furthermore, to the knowledge of the researchers no previous study has investigated thresholds regarding the ratio between IMTPrfd:IMTPmax. While this study may not have found statistically significant correlations, it did find the strongest correlations between IMTPrfd:IMTPmax ratios to dynamic performance in the High threshold group (Table 2). A potential limitation of this study and explanation to why no statistical significance was found was the small sample size. Regardless, the researchers believe that IMTPrfd:IMTPmax ratios are worth further investigation in larger and more diverse sample sizes. The present study was limited to force time variables at 100 and 200ms, whereas previous studies investigated RFD within 100ms [19,20]. Current literature suggests that critical time intervals occur between 50-300ms due to the similar nature in ground contact times as sprinting, jumping and COD [2]. This warrants additional investigation of RFD time intervals that are more specific to ground contact times of the dynamic performance test. IMTPrfd:IMTPmax ratios could be used and better explain performance of specific dynamic performance test if RFD was variable for each test. Despite some limitations this study does seem to suggest a IMTPrfd is correlated to dynamic performance and an important variable for athletes to train to maximize performance. Additionally, this study did find IMTPrfd:IMTPmax ratio does have thresholds and the higher thresholds, while not statistically significant, do correlate to better dynamic performance compared to lower threshold ratios.
Practical application
Many field and court sports require high RFD to perform well in [2]. A quick and accessible assessment method provides the ability to identify an athlete’s deficiencies and the results can further dictate their training plan. This study suggests that IMTPrfd obtained from a commercially available dynamometer can be useful for coaches and practitioners that do not have access to more expensive technology such as force plates. In addition, this study suggests that IMTPrfd and IMTPrfd:IMTPmax ratios have a correlation to dynamic performance and can be used to quickly paint an athlete profile without expending unnecessary time and energy. Future studies should explore more time intervals as well as changes to performance and IMTP variables after specific training has been implemented.
Conclusion
There exists a relationship between Rate of Force Development to max force when compared to dynamic sports performance, however the strength of that relationship is only just being investigated. Assessing athletes via IMTPrfd and evaluating IMTPrfd:IMTPmax ratios may provide additional insight into athlete’s abilities with respect to training programming and body composition modifications to increase dynamic sports performance. Future research should expand the sample size and variety of participants to provide more evidence for this investigation.
References
- Suchomel TJ, Nimphius S, Stone MH (2016) The importance of muscular strength in athletic performance. Sports Med 46(10): 1419-1449.
- Dos Santos T, Thomas C, Comfort P, McMahon J, Jones P (2017) Relationships between isometric force-time characteristics and dynamic performance. Sports 5(3): 68.
- Bompa TO, Buzzichelli C (2019) Periodization: Theory and methodology of training. (6th edn), Human Kinetics, USA, p. 392.
- Kraska JM, Ramsey MW, Haff GG, Fethke N, Sands WA, et al. (2009) Relationship between strength characteristics and unweighted and weighted vertical jump height. International Journal of Sports Physiology and Performance 4(4): 461-473.
- Haff GG, Stone MH (2015) Methods of developing power with special reference to football players. Strength & Conditioning Journal 37(6): 2-16.
- James LP, Roberts LA, Haff GG, Kelly Vincent G, Beckman EM (2017) Validity and reliability of a portable isometric mid-thigh clean pull. Journal of Strength and Conditioning Research 31(5): 1378-1386.
- Dobbin N, Hunwicks R, Jones B, Till K, Highton J (2018) Criterion and construct validity of an isometric midthigh-pull dynamometer for assessing whole-body strength in professional rugby league players. International Journal of Sports Physiology and Performance 13(2): 235-239.
- Grgic J, Scapec B, Mikulic P, Pedisic Z (2022) Test-retest reliability of isometric mid-thigh pull maximum strength assessment: A systematic review. Biol Sport 39(2): 407-414.
- Brady CJ, Harrison AJ, Comyns TM (2020) A review of the reliability of biomechanical variables produced during the isometric mid-thigh pull and isometric squat and the reporting of normative data. Sports Biomechanics 19(1): 1-25.
- McGuigan MR, Winchester JB (2008) The relationship between isometric and dynamic strength in college football players. J Sports Sci Med 7(1): 101-105.
- Beckham G, Mizuguchi S, Carter C, Sato K, Ramsey M, et al. (2013) Relationships of isometric mid-thigh pull variables to weightlifting performance. J Sport Med Phys Fit 53(5): 573-581.
- De Witt JK, English KL, Crowell JB, Kalogera KL, Guilliams ME, et al. (2018) Isometric midthigh pull reliability and relationship to deadlift one repetition maximum. Journal of Strength and Conditioning Research 32(2): 528-533.
- National Strength & Conditioning Association (2012) NSCA’s guide to tests and assessments. In: Miller T (Ed.), Human Kinetics, USA, p. 368.
- Sirirat R, Heskey C, Wilson C, Bitok E, Jones J, et al. (2020) A comparison of body composition measurements between bioelectrical impedance analysis (InBody 570) and air displacement plethysmography (BOD POD®). Current Developments in Nutrition 4(2): 1689-1689.
- Miller RM, Chambers TL, Burns SP, Godard MP (2016) Validating in body® 570 multi-frequency bioelectrical impedance analyzer versus DXA for body fat percentage analysis. Med Sci Sports Exerc 48(5S): 991.
- Jensky Squires NE, Dieli Conwright CM, Rossuello A, Erceg DN, McCauley S (2008) Validity and reliability of body composition analyzers in children and adults. Br J Nutr 100(4): 859-865.
- Ripley N, McMahon J (2022) Validation of a commercially available strain gauge against a series of known loads using a short time approach. ISBS Proceedings Archive 40(1): 591.
- Steinman D, Shirley M, Fuller M, Reyes C (2019) Validity and reliability of countermovement vertical jump measuring devices. International Journal of Exercise Science: Conference Proceedings 8(7): 38.
- Wang R, Hoffman JR, Tanigawa S, Miramonti AA, Monica MBL, et al. (2016) Isometric mid-thigh pulls correlates with strength, sprint and agility performance in collegiate rugby union players. J Strength Cond Res 30(11): 3051-3056.
- West DJ, Owen NJ, Jones MR, Bracken RM, Cook CJ, et al. (2011) Relationships between force-time characteristics of the isometric midthigh pull and dynamic performance in professional rugby league players. Journal of Strength and Conditioning Research 25(11): 3070-3075.
- Wilson Greg J, Lyttle Andrew D, Ostrowski Karl J, Murphy Aron J (1995) Assessing dynamic performance: A comparison of rate of force development tests. Journal of Strength and Conditioning Research 9(3): 176-181.
- Young Warren B, Bilby Glenn E (1993) The effect of voluntary effort to influence speed of contraction on strength, muscular power and hypertrophy development. Journal of Strength and Conditioning Research 7(3): 172-178.
© 2024 Greg Lutton. This is an open access article distributed under the terms of the Creative Commons Attribution License , which permits unrestricted use, distribution, and build upon your work non-commercially.
 a Creative Commons Attribution 4.0 International License. Based on a work at www.crimsonpublishers.com.
Best viewed in


.jpg)


 Editorial Board Registrations
 Submit your Article
 Refer a Friend
 Advertise With Us
.jpg)


.jpg)


.bmp)
.jpg)
.png)
.jpg)


.jpg)


.png)

.png)


.png)


