- Submissions

Full Text
Research & Investigations in Sports Medicine
Analysis of Amateur Runners’ Fluid Loss in Relation to their Invested Energy
Gabor F*, Pongrac A and Maria F
Faculty of health sciences, University of Pecs, Hungary
*Corresponding author: Gabor F, Faculty of health sciences H-7621 Pécs, University of pecs, Vörösmarty Mihály, Hungary
Submission: September 07, 2020;Published: March 17, 2021

ISSN: 2577-1914 Volume7 Issue3
Abstract
Objective: In this analysis, we look for answers as to how the dehydration level of runners’ changes in relation to their invested energy (measured in watts) in an 11.6km flat area as well as while hiking Hungary’s highest hill, Kékes.
Sample and methods: 12 persons were included in the study, all of whom completed the so-called 2018 ‘Kékes peak running race’, a challenge over 11.6km with a 670m rise above sea level. Following this event (two weeks later), they ran another 11.6km on Margaret Island in Budapest where the field is completely flat.
Results: In the experiment, during the Kékes peak run the runners delivered 333 watts of power. At the end of this race, a 2% body weight loss was observed which corresponds to approximately 1.5l fluid loss. The 12 runners accomplished the same distance in case of the second run too, but on a completely flat field. On average, the runners delivered 300 watts of power while completing the 11.6km long race. After finishing the flat field run, the participants’ weight decreased by 0.5% on average, which constitutes a less than 0.5l fluid loss. The results clearly show that a 10% elevation in power results in almost 4 times more loss of fluids. These results were also supported by the Urine Specific Gravity (USG) test as the USG growth was significant (p < 0.05) during the Kékes peak run.
Keywords: Dehydration; Running; Power; Level rise; Fluid substitution
Introduction
In order for us to become capable of delivering maximum performance in sports, it is a basic criterion that we make sure the fluid and electrolyte content of our bodies are in balance during the whole time of the physical activity. On average, 1l of liquid is lost during a 1-hour exercise period in the case of a 70kg sportsperson. The level of sweating depends on external environmental factors, body temperature, the speed of metabolism, and last but not least, on the intensity of the physical movement. In the event of high physical activity, in the case of warm and highly humid weather, it is not surprising to lose up to 2-3l of fluid per hour, through sweating and the vapour content of exhaled air. Currently, the most commonly used parameters in run tracker watches are stride length, distance, and pulse rate. However, from these data, it is impossible to define how much energy one uses during a run despite the measurement of the latter helping to deduce how effectively one runs. A complex method is required to numerically determine our running power, which is not simple to ascertain. Manufacturers of the latest run trackers are producing more and more accurate devices. These are indeed capable of determining running power in real-time, with data that is produced; we can devise our daily training and race preparations more accurately. If we can measure the power and the amount of lost fluids precisely, we can get an exact picture of how much fluid supplementation is needed for a given performance. Nearly 2000 runners decide to complete the Kékes peak run every year, where they take on the task of running 11.6km with a 670m rise above sea level. In addition to the challenge of the gradient, they have to contend with the hot weather since the race takes place in the middle of summer when the temperature can reach as much as 30°C high. In this study, we will search for an answer to how sportsperson’s dehydration levels change in relation to their invested power (measured in watts) in an 11.6km long flat field and also during climbing Kékes, the highest hill of Hungary.
Methods
The study was conducted at the 2018 Kékes peak run and on Margaret Island in Budapest. In both cases, the subjects had to run 11.6km. The two races took place in similar weather conditions. The exclusion criteria were the following: the participant has had any cardiological, locomotory or excretory system condition, the participant is under permanent medical treatment, and if they are under 18 years of age. The selection of the study subjects was randomized, each one of them decided autonomously to participate. All runners were informed about the possible risks and the potential inconveniences of the physical examinations. Complying with the expectations of the Ethics Committee, each subject signed a statement of consent. 12 males participated in the measurements, all of them have successfully completed other running races. Every runner used a Polar Vantage V type run tracker during the experiment. This watch is capable of measuring running power and pulse rate. Runners were not allowed to drink any fluids during the race, and they were also asked not to intake liquids until the post-race measurements were taken so that the data would appropriately show the dehydration changes in their bodies. The runners taking part in the study first completed the 11.6km distance of the Kékes peak run, then after 2 weeks, when the weather conditions (temperature, humidity) were the same as on the day of the previous race, they ran 11.6km again on Margaret Island. The height above sea level on the Margaret Island runway is negligible. The sampling process consisted of two parts. Before and after completing the distance, the runners had to fill out a survey, give a urine sample, measure their body composition, and we recorded the average running power data measured by the run trackers.
In the first phase of the study, all participants were requested to fill out a 29-question survey put together by the research team. The forms were completed anonymously. We inquired about the age, the highest level of education of the runners as well as about their sports habits and fluid intake habits during running. We were also interested in their knowledge of dehydration and whether they had ever experienced symptoms of dehydration during a run. In the next part of the experiment, we collected urine samples from the runners, and with the help of dipsticks, we determined Urine Specific Gravity (USG) and PH value. A CYBOW 11 rapid test was used for the measurements. The urine samples were collected in sterile, lockable top plastic cups. The dipsticks were dipped into the urine, and the surplus was soaked up with clean, hygroscopic paper. Then the dipsticks were placed on a sterile tray, and after 1 minute the results were recorded. 5ml from each urine sample was poured into a lockable test tube and then frozen to -80° C for further research. All runners were required to go through a body composition test [1]. For this, we used a Tanita BC 420 body composition analyser device. During the measurements, we were able to identify the weight, Body Mass Index (BMI) and the fluid content (TBW: Total Body Water) of the runners. Those runners could complete the distance who had undergone these examinations and started the power measurement function of the run tracker watch. We repeatedly conducted the measurements in case of everybody who had completed the distance. The surveys were filled out by runners and we recorded the data from the tracker watches. Post-running measurements were taken from all participants within 3 minutes of reaching the finish.
Results
Table 1:Basic info of study participants before and after the Margaret Island run.
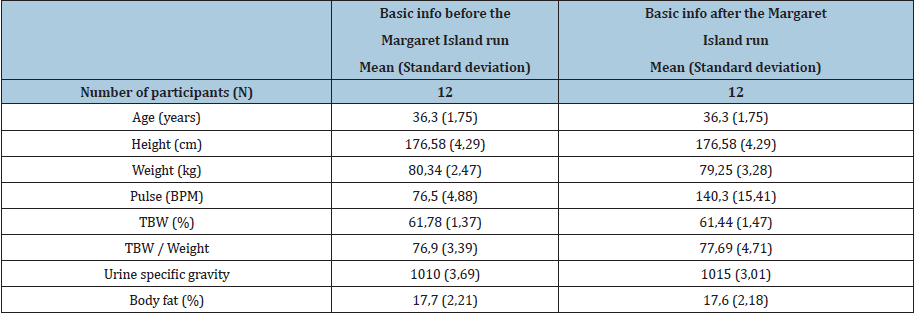
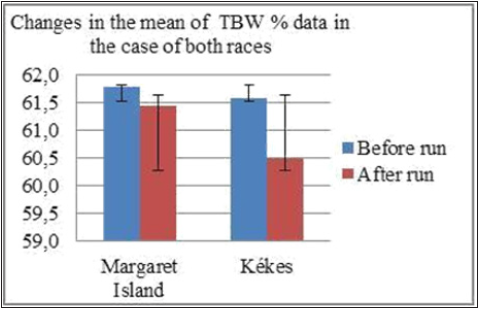
A decrease in body weight could be measured in all study subjects. From the difference between the weight losses occurring during the two races, we have successful ascertained how much more fluid a sportsperson loses if they have to tackle a rise in gradient above sea level because 90% of weight loss is caused by loss of fluid Cheuvront et al. [2]. The Margaret Island run participants completed the race in less than 49.26 mins on average (Standard deviation: 1.70) (Tables 1 & 2). In the Kékes peak run, participants managed to complete the distance in 63.27mins on average (standard deviation: 2.93). The TBW % (Total Body Water) changes of the 12 runners before and after the 11.6km races are illustrated in (Figure 1). The changes of TBW (%) (Total Body Water) average before and after the Margaret Island and Kékes peak run races are shown in (Tables 1 & 2). The runners’ TBW (%) average decreased from 61.78 to 61.44 by the end of the run. The reduction in the body fluid ratio was 0.55%, which suggests a 4dl fluid loss on average (Figure 2). On the other hand, the TBW (%) average showed a decline from 61.57 to 60.48 by the end of the Kékes peak run. The decrease in body fluid ratio was 2.1%, which corresponds with a 1.5l loss of fluid on average. The comparison of the two races’ TBW% data clearly shows how much more dehydrated (p < 0.05) the runners were after the Kékes peak run [3-8]. The changes in the TBW% data during both races are illustrated in (Figure 3). The results of the urine test also provide evidence that the runners’ bodies scarcely became dehydrated during the Margaret Island race. Urine tested before the race showed 1010±5g/l, a normal level of Urine Specific Gravity (USG). The post-race USG was also standard, 1015±5g/l. We re-measured the USG of each runner 1.5 hours following the race, by which time the values had normalized again (1010±5g/l). During the 1.5 hours the study subjects drank 550ml fluid on average.
Table 2: Basic info of study participants before and after the Kékes peak run. (Source: own editing)
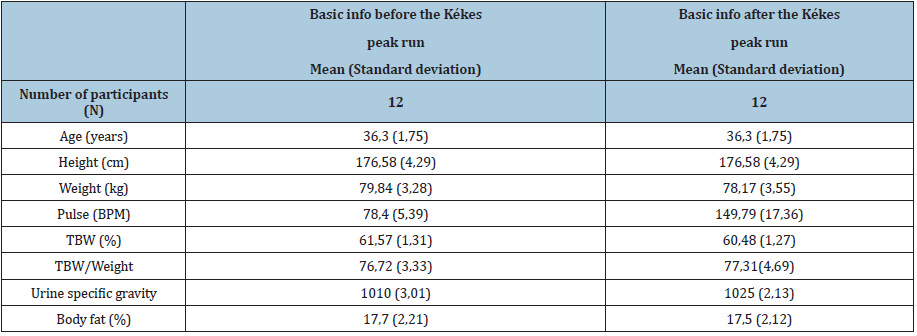
Figure 1: TBW% changes of participants before and after the Margaret Island and Kékes peak races (Source: own editing).

Figure 2: The participants’ changes in TBW % averages before and after the Margaret Island and Kékes peak races (Source: own editing)..
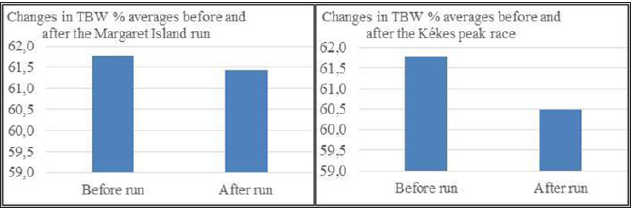
Figure 3: Changes in the mean of the participants’ TBW % data before and after both the Margaret Island and Kékes peak races (Source: own editing).
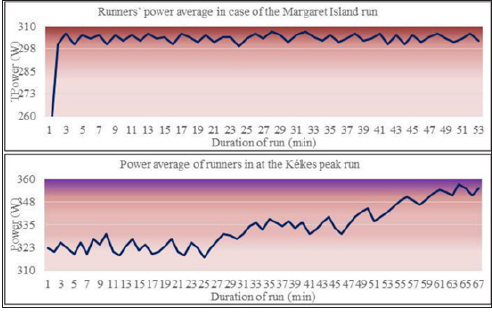
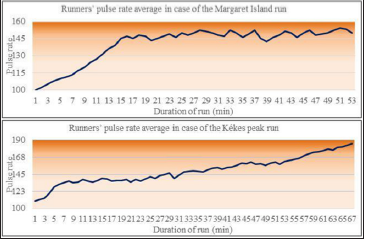
However, runners reached a more serious dehydration level by the end of the Kékes peak run (p<0.05). The pre-race USG was at a normal level, 1010±5g/l. On the other hand, USG after the run was identified as 1025±5g/l, which occurred due to dehydration. We measured the USG level of all participants 1.5 hours after the race when test results turned normal again (1010±5g/l) for everyone. The runners consumed 850ml of liquid on average in the previous 1.5 hours. The increase of USG was significant (p<0.05) at the time of the Kékes peak run (Figure 4). In the case of the Margaret Island race, the 12 runners’ power average reached 302 watts. The 12 runners’ power average reached 333 watts at the Kékes peak run. (Figure 5) depicts the fluctuations in the power data. The graphs display the pulse rate average of the 12 runners clearly indicating that the invested power is in direct proportion to the changes in pulse rates.
Figure 4: Study participants’ Urine Specific Gravity (USG) changes before and after the Margaret Island and the Kékes peak races (Source: own editing).

Figure 5:Runners ’power average in the case of the Margaret Island and the Kékes peak run (Source: own editing).
Discussion and Implications
These results highlight the fact that if we run in a field where we have to tackle a rise above sea level, we exponentially need to take care of fluid supplementation. While, given the situation we go for a comfortable-speed run in a flat field requiring approximately a 300 watts power investment, the loss of fluids can be ignored which amounts to almost 4dl, making this dehydration only mild [9-11]. Of course, we need to mention that in our study the subjects have been running for years, thus their bodies have become accommodated much more favorably to running (Figure 6). Had beginner runners been examined, who have just become familiar with the beauty of this sport, drink consumption would have probably shown completely different results. At the time of the Kékes peak run the participants’ invested power average reached 333 watts, which is a 10% increase in performance despite the runners’ speeds being slower. However, in the case of the Kékes peak run the sportsmen lost 1.5l of fluid which can be considered as moderate dehydration. When such dehydration levels set in, a beginner runner might show serious side effects. It can be calculated easily that a 10% growth in power comes with an almost four times increased need for fluid intake. Not only are beginner and amateur runners unaware of this fact but also those who have been running for years and have climbed mountains while running. This is because power data has only recently become available. With the development of technology, runners are much more able to keep a record of their running performances, from which they can gain a great deal of useful information. Getting familiar with, and accurately analysing these data, plays a significant role in making every minute of our run enjoyable. Based on our findings, we advise every runner to pay attention to even the smallest signs of dehydration, since skipping on refreshment may result in giving up a race. This work was supported by the University of Pecs Faculty of health sciences. The results of the present study do not constitute endorsement by the American College of Sports Medicine. The results of the study are presented clearly, honestly, and without fabrication, falsification, or inappropriate data manipulation.
Figure 6:Runners ’pulse rate average in the case of the Margaret Island and the Kékes peak run (Source: own editing).
References
- Burke LM (2007) Nutrition strategies for the marathon: fuel for training and racing. Sports Medicine 37(4-5): 344-347.
- Cheuvront SN, Robert C, Scott JM, Sawka M (2004) Daily body mass variability and stability in active men undergoing exercise-heat stress. Int J Sport Nutr Exerc Metab 14(5): 532-540.
- Cheuvront SN, Kenefick R, Sawka M (2010) Mechanisms of aerobic performance impairment with heat stress and dehydration. J Appl Physiol 109(6): 1989-1995.
- Jeukendrup AE (2011) Nutrition for endurance sports: marathon, triathlon, and road cycling. Journal of Sports Sciences 29(Sup1): 91-99.
- Noakes TD (1993) Fluid replacement during marathon running. Exerc Sport Sci Rev 21: pp. 297-330.
- Wakefield BJ, Mentes J, Holman E, Culp K (2008) Risk factors and out-comes associated with hospital admission for dehydration. Rehabil Nurs 33(6): 233-241.
- Figler M, Deutsch K, Elbert G, Gáti I, Hock M, et al. (2015) A Sporttáplálkozás alapjai. Pécsi Tudományegyetem Egészségtudományi Kar, Pé
- Gonzalez AJ (2007) Hyperthermia impairs brain, heart, and muscle function in exercising humans. Sports Med 37(4-5): 371-373.
- Kenefick RW, Sawka MN (2007) Heat exhaustion and dehydration as causes of marathon collapse. Sports Med 37(4-5): 378-381.
- Latzka WA, Montain SJ (1999) Water and electrolyte requirements for exercise. Clin Sports Med 18(3): 513-524.
- Mathews SC, Narotsky DL, Bernholt DL (2012) Mortality among marathon runners in the United States, 2000- 2009. The Am J Sports Med 40(7): 1495-1500.
© 2021 Gabor F. This is an open access article distributed under the terms of the Creative Commons Attribution License , which permits unrestricted use, distribution, and build upon your work non-commercially.
 a Creative Commons Attribution 4.0 International License. Based on a work at www.crimsonpublishers.com.
Best viewed in


.jpg)


 Editorial Board Registrations
 Submit your Article
 Refer a Friend
 Advertise With Us
.jpg)


.jpg)


.bmp)
.jpg)
.png)
.jpg)


.jpg)


.png)

.png)


.png)


