- Submissions

Full Text
Research & Investigations in Sports Medicine
Chronic Skeletal Muscle Damage Induced by a Demanding Physical Training is Not a Major PhysioPathological Factor for Overtraining Development in Wistar Rats
Francisco Leite*, Antonio Bovolini, Catarina C Costa and José A Duarte
CIAFEL-Laboratory of Biochemistry and Experimental Morphology, Faculty of Sport, University of Porto, Portugal
*Corresponding author: Francisco Leite, CIAFEL-Laboratory of Biochemistry and Experimental Morphology, Faculty of Sport, University of Porto, Portugal
Submission: January 16, 2020;Published: April 17, 2020

ISSN: 2577-1914 Volume6 Issue2
Abstract
This study aimed to test the assumption that successive muscle damage accumulation due to the training overload is in the origin of the overtraining syndrome (OTS), using the soleus (SOL) and tibialis anterior (TA) muscles of Wistar rats exposed to a demanding exercise training protocol. Animals were randomized distributed to a control group (CG, n=5) or to an exercised training group (EE, n=10), which performed a treadmill running training (-20º; from 25m/min, progressive increase of 1.25m/min per day; 60min) for 6 times/week being sacrificed 1 (EE1, n=5) and 3 weeks (EE3, n=5) after the beginning of the training program. Body weight, food intake, hair appearance, ability to perform work, and animals’ behavior were measured during the protocol. After sacrifice, SOL and TA muscles were collected for histological analysis. Both showed muscle damage signs in EE1 and EE3 through the increase of cell degeneration, tissue necrosis, and inflammatory activity. However, no OTS signs were observed. In parallel to the occurrence of muscle injury, adaptative signs in the exercised muscles were found, such as enhanced collagen content and muscle fibers cross-sectional area. The great amount of chronic muscular damage in SOL and TA was not associated with the OTS in the short (1 week) and medium-term (3 weeks). Further, muscle damage demonstrated different behaviors according to the type of work that each muscle has performed, questioning the use of systemic markers of muscle damage as reliable methods to study the relationship between skeletal muscle damage and OTS.
Keywords: Training overload; Muscle injury; Eccentric exercise; Soleus muscle; Tibialis anterior muscle
Abbreviations: BW: Body Weight; CD: Cellular Degeneration; CG: Control Group; CK: Creatine Kinase; CSA: Cross-Sectional Area; DPX: Dibutyl Xylene Phthalate; EE: Exercised Training Group; EE1: 1-Week Exercised Training Subgroup; EE3: 3-Week Exercised Training Subgroup; EM: Exercise Myopathy; FI: Food Intake; H&E: Hematoxylin-Eosin; IA: Inflammatory Activity; N: Necrosis Extent; NP: Nuclei Position; OTS: OvertraingSyndrome; PE: Physical Exercise; rTAW: Relative Tibialis Anterior Weight; rSW: Relative Soleus Weight; SOL: Soleus; SOLCC: Soleus Collagen Content; SOLCSA: Soleus Cross-Sectional Area; SOLMD: Soleus Muscle Damage; SOLNP: Soleus Nuclei Position; SW: Soleus Weight; TA: Tibialis Anterior; TACC: Tibialis Anterior Collagen Content; TACSA: Tibialis Anterior Cross-Sectional Area; TAMD: Tibialis Anterior Muscle Damage; TANP: Tibialis Anterior Nuclei Position; TAW: Tibialis Anterior Weight; TD: Total Damage; TO: Tissue Organization
Introduction
Strenuous and unusual physical exercise (PE) performances are the origin of ananatomopathological condition named exercise myopathy (EM) [1,2]. The EM is characterized by an amount of acute changes in skeletal muscle tissue with local and systemic repercussions [3]. Specifically, strenuous and unusual PE, particularly when composed by eccentric contractions, induces short-term muscle damage such as striated muscle pattern disorganization or necrosis areas as well as increased inflammatory response. However, between two to three weeks after exercise, it’s possible to observe the return to normal muscle tissue structure. Continuous PE practice confers to skeletal muscle a greater adaptative capacity which causes a smaller muscle damage amplitude after PE practice sessions [4,5]. Indeed, the training seems to provide adaptations in the myofibrillar structure and in other cellular compartments which, consequently, reduce the muscle damage and the consequent tissue inflammatory response [6]. Competitive athletes are confronted daily with the limits of their physical abilities [7]. Currently, these limitations appear in several contexts and are not exclusive of elite athletes [8,9], once they are also commonly observed in young categories and in recreative environments [8,9] specially when the training programs are characterized by high intensity loads and short rest periods [8,9]. Indeed, training programs that combine elevated demands, great amount of eccentric contractions, and reduced rest periods provide to athletes a greater risk of exceeding the limits of their adaptive abilities and, subsequently, evidencing progressively a lesser muscle tolerance to training stimuli [10].
When the adaptive ability limit is exceeded, skeletal muscles becomes intolerant to exercise due to the continuous damage caused by repeated PE stress, originating a long-term muscle injury accumulation [11].It is believed that this successive muscle damage accumulation due to the training overload is the origin of a chronic condition designated by overtraining syndrome (OTS) [11,12]. The OTS is described by a decreased functional performance capacity and intolerance to exercise, accompanied by nervous, endocrine, and immune systems dysfuntion [13,14]. Of note that to support the association between muscle injury and the occurrence of OTS the literature just present indirect markers of muscle damage, such as the serum levels of creatine kinase (CK). However, serum CK response during muscular damage shows a huge interindividual variability, which reducing the sensitivity and specificity of this parameter as indicator of damage, makes the association of OTS and chronic muscle injury less reliable [15]. On the other hand, there are no scientific direct evidences associating the chronic structural muscle damage induced by training overload with the occurrence of OTS. Therefore, the aim of this study was to verify in soleus (SOL) and tibialis anterior (TA) muscles of Wistar rats, the relationship between chronic muscle damage induced by demanding exercise training and the occurrence of the overtraining syndrome. The exercise protocol was designed to promote a high and continued level of muscle damage since it has combined a high-running velocity performed with a negative slope and short rest periods between exercise bouts. Based on the widely belief, we hypothesize that the great amount of accumulated muscle damage in the studied muscles is closely associated with OTS signs, in the short (1 week) and medium term (3 weeks) after the beginning of the training protocol.
Materials and Methods
Animals and experimental design
Fifteen male Wistar rats from Charles River Laboratories (Barcelona, Spain) with 4-weeks old were used in this study. The animals were housed in collective cages (2 per cage) with a temperature and humidity-controlled environment (21-22ºC and 50-60%, respectively) and 12h light/dark inverted cycle. The animals had food and water access ad libitum (standard laboratory diet 4RF21®, Mucedola, Italy). After one week of acclimatization, the animals were randomly distributed into 2 groups: control group (CG, n=5, body weight 161.8±7.05g) and exercise training group (EE group, n=10, body weight 164.7±16.82g). The animals of this group were sacrificed in different subgroups, at short-term, in the end of first week (EE1 subgroup, n=5, body weight 158.8±16.32g) and at medium-term, in the end of third week (EE3 subgroup, n=5, body weight 170.6±16.83g). The exercised rats had one-week adaptation to the treadmill (10 minute/day without slope with a low intensity), and then, both experimental groups were submitted to a treadmill training protocol (Treadmill Control LE 8710, Harvard Apparatus, USA) with a 20º negative slope. The experimental protocol consisted in a progressive increased of intensity running ranging from 25 to 48 meters/minute for 1 hour/day, 6 days per week throughout 1-week and 3-weeks, respectively. The running protocol starts with an intensity of 25 meters/minute which intensity increased 1.25 meters/minute in each training session, reaching at the end of first and third weeks, a maximal intensity of 32.5 meters/minute and 48 meters/minute, respectively. The animals of CG remained limited to their cage space during all the study. Animal’s weight and amount of food consumption were daily assessed before each training session. All procedures were carried out to provide appropriate animal care, minimizing their suffering. Housing and experimental treatment of the animals were in accordance with the guidelines defined by the European Council Directive (2010/63/EU) transposed into Portuguese law (Law number 113/2013, August 7th).
Criteria to assess overtraining
In humans it is possible to identify signs of overtraining not only by the decrease of the sport performance but also earlier by behavioral changes, such as the increase of the irritability, the aggressiveness and the anxiety or the lack of appetite [16]. However, in animals there is no set of validated parameters that allow us to evaluate that kind of behaviour. Thus, in this study, in order to detect and quantify the occurrence of OTS in the exercised groups we used the following parameters:
- Changes in the body weight (BW),
- Evolution of food intake (FI),
- The animals´ behavior,
- Their hair appearance,
- Signs of nose bleed, and
- The animals’ ability to perform and tolerate the imposed running demand.
Namely, it was observed whether the experimental groups showed comparatively to CG, decreases in weight and food intake as well as abnormal behavior, characterized by a passive attitude in the periphery of an open field, without exploratory appetence [17]. Moreover, it was noted if the animals had bristly hairs and signs of nose bleed [18,19]. As a functional criterion, we observed the rats’ ability to perform the physical effort imposed in each training session [20].
Animals sacrifice and samples collection
One day after the end of the experimental protocol, the animals were weighed and anesthetized with Ketamine (90 mg/kg, Merial, France) and Xylazine (10 mg/kg, Bayer, Germany) and euthanized by exsanguination. After animals’ weight assessment, the SOL and TA were harvested, washed in PBS (pH 7.2), weighed in a precision balance (resolution 0.01 mg; Kern 870, Balingen, Germany), and processed immediately for light microscopy. After SOL and TA weights mensuration (SW and TAW, respectively), relative soleus and tibialis anterior weights (rSW and TAW, respectively) were calculated by the respective ratio for BW and expressed as percentage (%).
Histological analysis
After soleus and tibialis anterior excision, the muscles were 24h fixed in 4% paraformaldehyde solution at 4ºC, dehydrated through graded ethanol solutions, cleared in xylene and mounted in paraffin. 5µm thick sections from both muscles were cut by microtome (Leica, RM2125) and used for assessing fibrous tissue, muscle fibers cross-sectional area, muscle fibers’ nuclei position and rates of muscular damage. The sections were analyzed with a light microscope (Axior Imager A1, Carl Zeiss, Germany) and images recorded with a coupled digital camera (Leica DM4000B, Nussloch,Germany).
Total collagen content analysis
To fibrous tissue accumulation assessment, SOL and TA sections were stained with Picrosirius Red according to the method of Sweat & Puchtler [21] by incubation on 0.1% Sirius redpicric acid for 90 minutes. Them, sections were rinsed in 0.5% acetic acid, dehydrated in ethanol and cleared in xylene. The collagen and the remained muscular tissue stains in red light and yellow, respectively. The software Image-Pro Plus 6.0 (Media Cybernetics, Inc) was used to quantify the percentage of area (µm2) covered by the colors corresponding to the respective tissues. For each muscle, 6 photos per animal were analyzed.
Cross-sectional area and muscle fibers nuclei position analysis
SOL and TA sections were stained with hematoxylin-eosin (H&E). The H&E protocol consisted of immersing the sections in Mayer's hematoxylin solution for 5 min, followed by its immersion in 1% eosin solution for 10 minutes, alcoholic dehydration and immersion in xylene for 5 min succeeded by posterior laminar assembly with DPX (dibutyl xylene phthalate; Shandon EZ-Mount, Thermo Electron Corporation, USA). The NIH Image J software (Image Processing and Analysis in Java, USA) was utilized to analyze muscles fibers cross sectional area (CSA) and nuclei position (NP). In both analyses 6 photos/muscle/animal were used. To analyze nuclei position, all the fibers contained in the photos were analyzed. The number of muscle fibers with central nuclei was expressed as a percentage of total fibers analyzed. A total of 5920 muscle fibers from SOL were analyzed, specifically 2488 fibers from CG, 2217 fibers from EE1 subgroup, and 1215 fibers from EE3 subgroup. Meanwhile, a total of 8324 muscle fibers from TA were analyzed, namely 3154 fibers from CG, 3108 fibers from EE1 subgroup, and 2062 fibers from EE3 subgroup.
Muscle damage evaluation
Muscular damage was assessed according to a semi-quantitative procedure [22,23], adapted to the skeletal muscle tissue. Randomly photos from cuts stained with H&E were evaluated in accordance with 4 parameters:
- The inflammatory activity (IA),
- The necrosis extent (N),
- The tissue disorganization (TO) and
- The cellular degeneration (CD).
The level of tissue inflammatory activity (i.e., interstitial and inner leucocytes) was scored as follows: grade 0 = no cellular infiltration; grade 1 = mild leukocyte infiltration (1 to 3 cells per image); grade 2 = moderate infiltration (4 to 6 leukocyte sper visual field); grade 3 = heavy infiltration by leucocytes. The severity of necrosis extent (i.e., necrotic and eosinophilic muscular fibers) was scored as: grade 0 = no necrosis; grade 1 = dispersed necrotic foci; grade 2 = confluent necrotic areas; grade 3 = massive necrosis. The level of tissue disorganization was scored as: score 0 = normal structure; score 1 = less than one-third of the image; score 2 = greater than one-third and less than two-thirds of the image; score 3 = greater than two-thirds of the image. The level of cellular degeneration (i.e., fibers dilatation, sarcoplasm vacuolization and density) was scored as percentage of the affected tissue: score 0 = no change from normal; score 1 = a limited number of muscle fibers (up to 5% of total number); score 2 = groups of affected muscle fibers (5 to 30% of total muscle fibers number); score 3 = diffuse cell damage (more than 30% of total muscle fibers number). After, all the previous parameters were summed to produce a total muscle damage (TD) score. For each muscle/animal, at least 10 microscopic visual field were analyzed using an objective of 40x.
Statistical analysis
The statistical analysis was performed using GraphPad Prism® (version 8.00, Graph Pad Software, San Diego, California, USA). The Kolmogorov-Smirnov test was performed to investigate the data normality in variables with n>50 from SOL and TA cross-sectional area (SOLCSA and TACSA, respectively) and SOL muscle damage (SOLMD), while the Shapiro-Wilk test was performed to investigate the data normality when n<50 from BW, SW, TAW, rSW, rTAW, SOL and TA collagen content (SOLCC and TACC, respectively), SOL and TA nuclei position (SOLNP and TANP, respectively), TA muscle damage (TAMD) and the FI. The one-way ANOVA followed by the Tukey post hoc comparison test was used to analyze data with normal distribution (BW, SW, SOLCC, TACC and FI). The data with abnormal distribution were then analyzed with Kruskal-Wallis followed by the Dunn´s post hoc comparison test (rSW, TAW, rATW, SOLCSA, TACSA, SOLANP, TANP, SOLMD and TAMD). Differences were considered significant at p˂0.001, and the obtained data were expressed as a mean±standard deviation for normal distributed data or as median with percentiles 25 and 75 (P25-P75) for abnormal distributed data.
Result and Discussion
Overtraining outcomes
The results allusive to body weight and food intake evolution are expressed in Figure 1. In both weeks were demonstrated significative differences in BW. The EE1 subgroup (207.0±13.58g) presented a significant BW decrease (p<0.001) when compared to CG (276.4±12.64g). Further, the EE3 subgroup (291.6±29.92g) exhibited a significant BW increase (p<0.0001) in comparison to EE1 subgroup. Regarding to the daily FI, although EE3 subgroup (24.4±3.37g) presented a higher mean comparatively to CG (23.9±2.91g) and EE1 subgroup (21.2±2.51g), no significant differences were detected from the comparison among them. Moreover, no significant differences were observed in the animal behavior and on the state of the hair as well as in the ability to perform the imposed demand. Although the animals showed a BW decrease in the first week, this was recovered throughout the experiment. Thus, from the evaluation criteria analysis, we can observe that the exercised subgroups did not show overtraining signs (Figure 1).
Figure 1: The mean value with standard deviation of body weight and the food intake for the CG (control group) and exercised group at short (EE1, after 1 week of training) and medium-term (EE3, after 3 weeks of training) are depicted in a and b, respectively.
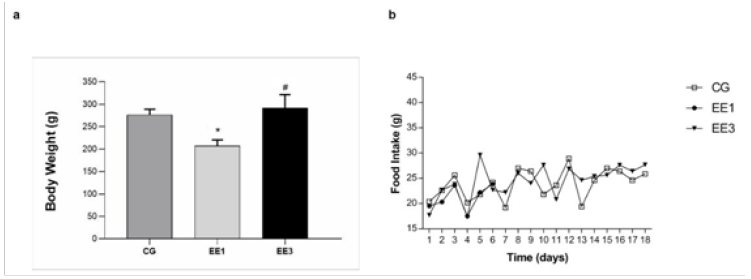
*p<0.001 vs. CG; #p<0.001 vs. EE1.
Muscles outcomes
Table 1: Muscles weights (g).

Control group (CG), 1-week eccentric exercise (EE1) and 3-weeks eccentric exercise (EE3) subgroups. SW: Soleus Weight; rSW: Relative Soleus Weight; TAW: Tibialis Anterior Weight; rTAW:Relative Tibialis Anterior Weight
As we can observe in Table 1, no significant differences were presented by the absolute and relative weight of SOL and TA muscles (Table 1).
Cross-sectional area outcomes
Figure 2: Representative light micrographs of soleus muscles from control group (CG), 1-week eccentric exercise (EE1), and 3-weeks eccentric exercise (EE3), stained with hematoxilin & eosin, are depicted in a. The boxplot graphic presents the median value with 25 and 75 percentiles of muscle fibers cross sectional area for the CG and each exercised subgroup, is are shown in b.
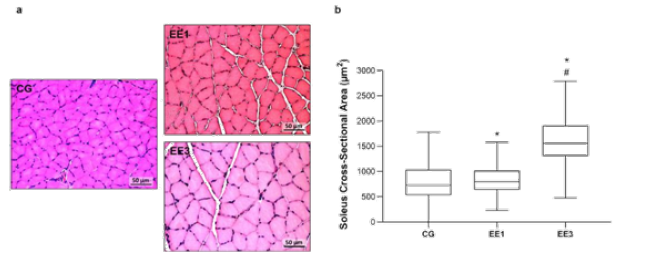
*p<0.001 vs. CG; #p<0.001 vs. EE1.
Soleus CSA results are labelled in Figure 2. The EE3 subgroup presented the largest CSA among all groups. Namely, the EE3 presented a median of 1559.0µm2 (1308.0-1909.9µm2) while the CG and EE1 subgroup showed a median of 732.3µm2 (532.21-1032.7µm2) and 797.7µm2 (637.94-1016.6µm2), respectively. Specifically, the EE3 subgroup presented a pronounced and significant increase in CSA compared to CG (p<0.0001) and EE1 (p<0.0001) subgroup. Further, the EE1 subgroup also demonstrated a significant increase in CSA comparatively to CG (p<0.0001) (Figure 2).
Figure 3: Representative light micrographs of tibialis anterior muscles from control group (CG), 1- week eccentric exercise subgroup (EE1), and 3-weeks eccentric exercise subgroup (EE3), stained with hematoxylin & eosin, are depicted in a. The boxplot graphic presents the median value with 25 and 75 percentiles of of muscle fibers crosssectional area for the CG and each exercised subgroup, is shown in b.
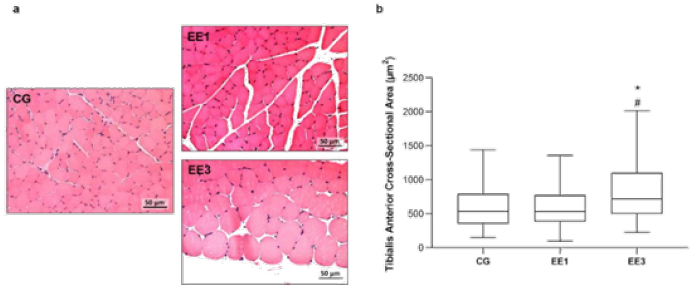
*p<0.001 vs. CG; #p<0.001 vs. EE1.
The results regarding TA CSA are shown in Figure 3. EE3 subgroup exhibited a significantly increase of TA CSA compared to CG and EE1 subgroup (p<0.0001 and p<0.0001, respectively), with a median of 719.5µm2 (498.15-1106.0µm2) in comparison to 537.0µm2 (355.70-792.76µm2) and 533.3µm2 (383.78-774.32µm2) medians from CG and EE1 subgroup, respectively. In contrast, no statistical differences were found in TA CSA between EE1 subgroup and CG (Figure 3).
Muscle fibers nuclei position outcomes
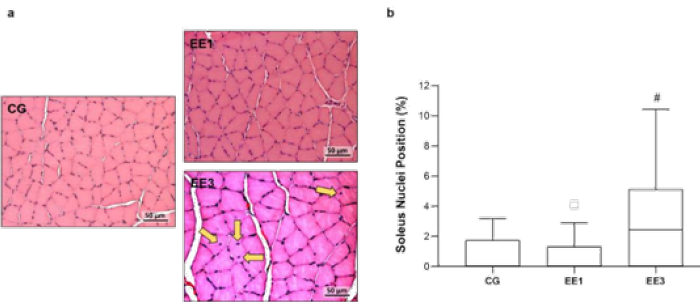
As can be seen in Figure 4, the EE3 subgroup shown a significant increase of muscle fibers with central nuclei position in comparison to EE1 subgroup (p<0.001), with a median of 2.4%(0.00-5.13%) relatively to 0.0% (0.00-1.33%) from EE1 group. However, EE3 and EE1 subgroups did not exhibit statistical differences comparatively to 0.0% (0.00-1.76%) of CG (Figure 4).
Figure 4: Representative light micrographs of soleus muscles from control group (CG), 1-week eccentric exercise subgroup (EE1), and 3-weeks eccentric exercise subgroup (EE3), stained with hematoxylin & eosin, are depicted in a. The central nuclei are indicated by the yellow arrows. The boxplot graphic presents the median value with 25 and 75 percentiles of muscle fibers with central nuclei for the CG and each exercised subgroup. #p<0.001 vs. EE1.
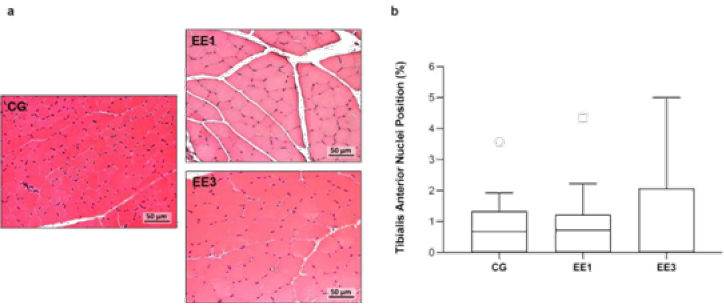
In Figure 5 it is possible to observe the data referring to nuclei position of TA. Although EE3 subgroup presented a median of 0.0% (0.00-2.07%) comparatively to 0.7% (0.00-1.33%) from CG and 0.7% (0.00-1.22%) from EE1 subgroup, no significant differences were detected from the comparison among groups (Figure 5).
Figure 5: Representative light micrographs of tibialis anterior muscles from control group (CG), 1-week eccentric exercise subgroup (EE1), and 3-weeks eccentric exercise subgroup (EE3), stained with hematoxylin & eosin, are depicted in a. The boxplot graphic presented in b shows the median value with 25 and 75 percentiles of muscles fibers with central nuclei for the CG and each exercised subgroup.
Muscular damage outcomes
Through Table 2, it is possible to note that there were significant differences in some muscular damage parameters of the SOL muscle. Namely, the EE1 and EE3 subgroups presented a significant increase (p<0.001) in IA, N, CD and TD comparatively to CG. On the contrary, EE3 subgroup exhibited a significant decrease (p<0.001) of IA, N and TD when compared to EE1 subgroup. No statistical differences were found among groups in TO parameter (Table 2).
Table 2: Muscular damage in soleus muscle. The results are presented as median (P25-P75) of control group (CG), 1-week eccentric exercise(EE1) and 3-weeks eccentric exercise (EE3) subgroups.

* p<0.001 vs. CG; † p<0.001 vs. EE1.
As we noted in Table 3, EE3 subgroup demonstrated significant IA, N and TD increases (p<0.0001) comparatively to CG and EE1 subgroup. Further, EE1 subgroup shown bigger CD and TD scores (p<0.0001 and p<0.001, respectively) than CG. Finally, EE3 subgroup also exhibited a significant CD increase (p<0.0001) in comparison to CG. No statistical differences were found among groups in TO parameter (Table 3).
Table 3: Muscular damage in tibialis anterior muscle. The results are presented as median and percentiles (P25-P75) of control group (CG), 1-weekeccentric exercise (EE1) and 3-weeks eccentric exercise (EE3) subgroups.

* p<0.001 vs. CG; † p<0.001vs. EE1.
Collagen outcomes
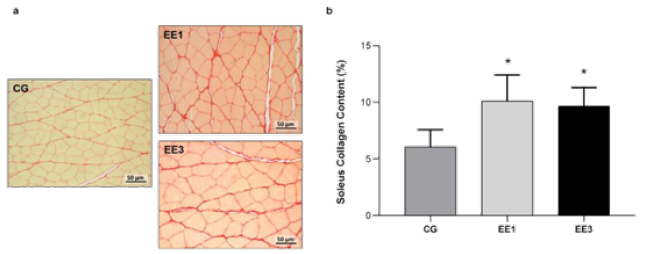
According Figure 6, there were significant CC differences in exercised groups. The EE1 subgroup (10.1±2.30%) and EE3 subgroup (9.7±1.64%) shown a significant increase in SOL collagen content (p<0.0001) comparatively to CG (6.1±1.51%). Although, no significant difference was observed between groups EE1 and EE3 subgroups, it is important to note a trend towards a collagen content decrease in animals with 3-weeks of eccentric exercise (Figure 6).
Figure 6: Representative light micrographs of soleus muscles from control group (CG), 1-week eccentric exercise subgroup (EE1), and 3-weeks eccentric exercise subgroup (EE3), stained with Picrosirius Red, are depicted in a. The mean value with standard deviation of red stained area for the CG and each exercised subgroup, indicative of tissue collagen content, are shown in b.
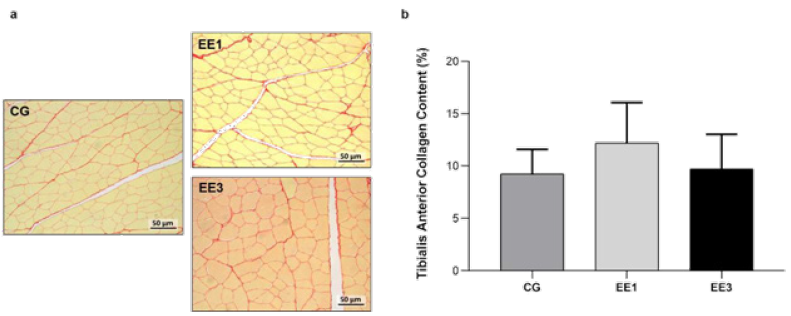
Based on analysis of Figure 7, it is possible to observe no statistical differences in both exercise groups related to collagen area. Although EE1 subgroup (12.2±3.9%) presented an increase in TA collagen content in comparison to CG (9.3±2.35%), this increase is not significant. In turn, despite EE3 subgroup (9.7±3.30%) demonstrated a collagen deposition decrease when compared to the EE1 subgroup, no significant differences were noted (Figure 7).
Figure 7: Representative light micrographs of tibialis anterior muscles from control group (CG), 1-week eccentric exercise subgroup (EE1), and 3-weeks eccentric exercise subgroup (EE3), stained with Picrosirius Red, are depicted in a. The mean value with standard deviation of red stained area for the CG and each exercised subgroup, indicative of tissue collagen content, are shown in b.
The obtained results do not support our working hypothesis since any signal of overtraining was found although the effectiveness of PE protocol to induce early and mid-term structural alterations either in SOL and TA muscles. Even though the training protocol presented all the characteristics to induce an overtraining syndrome, such as a large percentage of eccentric contractions, a high running speed and short periods of rest between exercises, the exercised group showed no signs of OTS. Of note that the adoption of a protocol with negative slope in our study is justified by the greater eccentric work performed during the running, causing a greater mechanical effort due to the distribution of the mechanical stress by a smaller number of muscular fibers and, consequently, having a greater injurious role [24,25]. Indeed, at the end of the first week, a significant decrease in BW was observed, suggesting a training protocol negative impact; however this decrease was not accompanied by any alteration in the other OTS criteria evaluated. This initial weight loss in the exercised group could be explained by increased energy expenditure and proteolysis under persistent workloads [26] since no diet uptake changes were registered.
Furthermore, at the end of the third week, a total BW recovery was reported to similar levels of the control group, along with maintenance of the remaining parameters of OTS at normal levels. Indeed, despite the high mechanical and metabolic demands imposed, the animals were able to maintain motor performance throughout the experiment, showing no sign of nasal bleeding or abnormality in their normal behavior, nor manifesting significant changes in the food intake evolution or in their hair appearance. Although the existence of a negative impact on body weight at the first week, these results support that the imposed training protocol did not induce signs of OTS in these three weeks. Although the training program implemented did not provoke signs of OTS, it was able to induce severe muscle damage in both muscles at the end of the 1st and 3rd week, confirming evidence already presented in literature using similar methodologies [27,28]. However, the studied muscles behavior to exercise-induced muscle damage was different. It must be highlighted that the selection of the evaluated muscles in our experimental design was associated with the type of action they perform during the running protocol. The results showed that SOL muscle presented a greater damage than TA muscle throughout the study, visible by the amount of cell degeneration and tissue necrosis, accompanied by the elevation of inflammatory response. Nevertheless, at the end of the third week, though the muscle damage rates remained high in SOL, there were signs of injury reduction when compared to the first week.
On the other hand, despite a lower lesion score than the SOL muscle, the TA muscle showed worsening signs of muscle damage at the end of the experiment, observable through the levels of cell degeneration and necrosis associated with an intensification of inflammatory process. While the TA muscle showed a continuous increase of muscle damage throughout the study, the SOL muscle expressed at the end of the 3rd week a slight decrease of this damage compared to the 1st week. These differences observed in the muscle damage responses to the training protocol in the studied muscles can be explained by the different types of muscle contraction performed during exercise as well as by the different muscle fibers type composition [29,30]. Effectively, during the running realized in negative slope there is a greater eccentric work in the active muscles comparatively to the horizontal slope [31]. Nevertheless, comparing the two muscles in the negative slope, the SOL performed a higher eccentric work than the TA, which justifies its greater damage [32].
Besides that, the SOL muscle is more trained and prepared for this type of eccentric work than the TA muscle as a result of his daily action, which may explain the differences in the responses of both muscles over time [33]. Additionally, the fact that TA muscle has a predominance of fast-twitch fibers compared to the SOL muscle may explain the progressive worsening of muscle damage signs obtained in this muscle, because these type of fibers appear to be more susceptible to problems in excitation-contraction coupling than slow-twitch fibers, promoting a greater muscle damage degree [30,34].On the other hand, the results demonstrate that, despite the high demand of the training protocol, both muscles presented phenotypic signs of favorable adaptations to training load, which may contribute to explain the absence of OTS signs.
Indeed, the SOL muscle showed signs of tissue repair, namely not only by the healing process, observed by the increase in collagen content, but also trough the regenerative process characterized by an increased number of centralized nuclei in the muscle fibers. The increased collagen content is important to change the mechanical properties of the skeletal muscle, improving the mechanical forces distribution and decreasing the susceptibility to mechanical stress and damage [34]. Further, during the muscle regenerative process following injury, the satellite cells activation with consequent fusion to the existing fibers promotes an increased number of centralized nuclei, which subsequently explains the significant increase in the cross-sectional area that the SOL muscle exhibited throughout the study [35,36]. The increased CSA facilitates the dissipation and distribution of the mechanical stress exerted, improving the tolerance of muscular fibers to mechanic stress overload [37]. In contrast, despite the continuous increase of muscle damage in the TA muscle, it is also possible to observe signs of favourable muscle adaptation, through the increase of the cross-sectional area at the end of the 3rd week compared to the 1st week.
Although our study aims to verify the relationship between chronic muscle damage induced by demanding exercise training and OTS in SOL and TA of Wistar rats, the duration of the protocol as well as the lack of biochemical and functional evaluations may be considered limitations of our study. Indeed, the duration of the protocol was determined in order to observe the evolution of muscle damage and the OTS signs in the short-term (1st week) and medium-term (3rd weeks) after the beginning of the training protocol. Nevertheless, although the absence of OTS signs during this period, the experimental protocol does not guarantee the absence of OTS with a prolonged period of physical training. Additionally, it might be argued that the 2 weeks age difference at the time of sacrifice in the exercise subgroups may bias the results due to the occurrence of sexual maturation in the EE3 subgroup. However, Wistar rats reach sexual maturity only after 8-10 weeks of age [38-40] and therefore both exercised subgroups are sexually immature. Moreover, the use of a single control group with 7-weeks old could be seen as a limiting factor to control of EE1 sub-group. Indeed, it must be reinforced that this control group just controls the EE3 sub-group because the EE1subgroup just intents to show an evolutionary stage, allowing observing the evolution of the parameters evaluated in EE3 subgroup.
Conclusion
It was expected that both muscles did not show tolerance to the continuous increase of the training demand, however despite the occurrence of muscle damage, no OTS signs were observed in the first three weeks. Contrary to what is believed, the results found in this study do not support the concept that the great amount of persistent muscular damage is associated with the overtraining syndrome signs in the short and medium-term. Furthermore, the results support the idea that in the absence of OTS signals, the muscle damage seems to occur simultaneously with the increase of adaptive signals. Finally, our results showed different muscle damage behaviors according to the type of work that each muscle performs, questioning the use of systemic markers of muscle damage as reliable methods to study the relationship between skeletal muscle damage and OTS.
References
- Duarte JA (1993) Cellular injuries of skeletal muscle induced by physical exercise. Faculty of Sport Sciences and Physical Education, University of Porto, Portugal.
- Duarte JA (2001) Exercise myopathy Anatomopathology and pathophysiology. Rev Port Ciên Desp 1(2):73-80.
- de Almeida E (2017) Muscle injury after different methods of strength training. Physiotherapy in motion 19(4).
- LiraVA (2013) Autophagy is required for exercise training induced skeletal muscle adaptation and improvement of physical performance. FASEB J 27(10): 4184-4193.
- Zanchi NE (2010) Experimental chronic low‐frequency resistance training produces skeletal muscle hypertrophy in the absence of muscle damage and metabolic stress markers. Cell Biochem Funct 28(3): 232-238.
- Friden J, Sjöström M,Ekblom B (1983) Myofibrillar damage following intense eccentric exercise in man. Int J Sports Med 4(3):170-176.
- Carfagno DG, Hendrix JC (2014) Overtraining syndrome in the athlete: current clinical practice. In: Carfagno DG & Hendrix JC (Eds.), Curr Sports Med Rep (3rd edn), USA, 13(1): 45-51.
- Walters BK, Read CR, Estes AR (2018) The effects of resistance training, overtraining, and early specialization on youth athlete injury and development. J Sports Med Phys Fitness 8(9): 1339-1348.
- Vieira JLM, Rocha PGM, Ferrarezzi RA (2010) Dependence on physical exercise and the use of ergogenic resources. Acta Scientiarum Health Sciences 32(1): 4475.
- Kentta G, Hassmen P (1998) Overtraining and recovery. A conceptual model. Sports Med 26(1): 1-16.
- Tiidus PM (1998) Radical species in inflammation and overtraining. Can J Physiol Pharmacol 76(5): 533-538.
- Ruzicic RD, Jakovljevic V, Djordjevic D (2016) Oxidative stress in training, overtraining and detraining: from experimental to applied research. Serbian Journal of Experimental and Clinical Research 17(4): 343-348.
- Cardoos N (2015) Overtraining syndrome. Current Sports Medicine Reports 14(3): 157-158.
- Kreher JB (2016) Diagnosis and prevention of overtraining syndrome: an opinion on education strategies. Open Access J Sports Med 7: 115-122.
- Magal M (2010) Relationship between serum creatine kinase activity following exercise-induced muscle damage and muscle fibre composition. J Sports Sci 28(3):257-266.
- Johnson MB, These SM (1992) A review of overtraining syndrome-recognizing the signs and symptoms. J Athl Train 27(4): 352.
- Lezak KR, Missig G, Carlezon WA (2017) Behavioral methods to study anxiety in rodents. Dialogues Clin Neurosci 19(2): 181-191.
- CouncilNR (2008) Recognition and alleviation of distress in laboratory animals. The National Academies Press, Washington DC, USA, p. 136.
- Rivera EAB (2006) Stress in laboratory animals. In: Andrade A, et al. (Eds.), Laboratory Animals: Breeding and Experimentation. Rio de Janeiro: Editora Fiocruz 2002, Brazil, 29: 263-273.
- Hohl R (2009) Development and characterization of an overtraining animal model. Med Sci Sports Exerc 41(5): 1155-1163.
- Sweat F, Puchtler H, Rosenthal SI (1964) Sirius red F3BA as a stain for connective tissue. Arch Pathol 78: 69-72.
- da Silva Teixeira CE (2017) Sedentary behaviour impairs the skeletal muscle repair induced by toxic injury in an animal model. University of Porto, Portugal.
- Dinis Oliveira R (2007) Full survival of paraquat-exposed rats after treatment with sodium salicylate. Free Radic Biol Med 42(7): 1017-1028.
- Douglas J (2017) Eccentric exercise: Physiological characteristics and acute responses. Sports Med 47(4): 663-675.
- Hyldahl RD, Hubal MJ (2014) Lengthening our perspective: morphological, cellular, and molecular responses to eccentric exercise. Muscle Nerve 49(2): 155-170.
- Pereira BC (2016) Excessive eccentric exercise-induced overtraining model leads to endoplasmic reticulum stress in mice skeletal muscles. Life Sci 145: 144-151.
- Pereira B (2015) Excessive eccentric exercise leads to transitory hypothalamic inflammation, which may contribute to the low body weight gain and food intake in over trained mice. Neuroscience 311: 231-242.
- Silva L (2013) Effect of eccentric training on mitochondrial function and oxidative stress in the skeletal muscle of rats. Braz J Med Biol Res 46(1): 14-20.
- GonzalezIzal M, Cadore EL, Izquierdo M (2014) Muscle conduction velocity, surface electromyography variables, and echo intensity during concentric and eccentric fatigue. Muscle Nerve 49(3): 389-397.
- Qaisar R, Bhaskaran S, Van Remmen H (2016) Muscle fiber type diversification during exercise and regeneration. Free Radic Biol Med 98: 56-67.
- Alkahtani S (2019) Effect of acute downhill running on bone markers in responders and non-responders. Osteoporos Int 30(2): 375-381.
- Giandolini M (2017) Effects of the foot strike pattern on muscle activity and neuromuscular fatigue in downhill trail running. Scand J Med Sci Sports 27(8): 809-819.
- Hessel AL, Nishikawa KC (2017) Effects of a titin mutation on negative work during stretch-shortening cycles in skeletal muscles. J Exp Biol 220(22): 4177-4185.
- Takagi R (2016) Regional adaptation of collagen in skeletal muscle to repeated bouts of strenuous eccentric exercise. Pflugers Arch 468(9): 1565-1572.
- Liu F (2013) Automated fiber-type-specific cross-sectional area assessment and myonuclei counting in skeletal muscle. J Appl Physiol 115(11): 1714-1724.
- Song T(2019) Dilated cardiomyopathy-mediated heart failure induces a unique skeletal muscle myopathy with inflammation. Skeletal Muscle 9(1): 4.
- Hedayatpour N, Falla D (2015) Physiological and neural adaptations to eccentric exercise: Mechanisms and considerations for training. Biomed Res Int 2015: 193741.
- Campion SN (2013) Comparative assessment of the timing of sexual maturation in male WistarHan and Sprague-Dawley rats. Reprod Toxicol 38: 16-24.
- Zemunik T (2003) Reproductive ability of pubertal male and female rats. Braz J Med Biol Res 36(7): 871-877.
- Sengupta P (2013) The laboratory rat: relating its age with human's. Int J Prev Med 4(6):624.
© 2020 Francisco Leite. This is an open access article distributed under the terms of the Creative Commons Attribution License , which permits unrestricted use, distribution, and build upon your work non-commercially.
 a Creative Commons Attribution 4.0 International License. Based on a work at www.crimsonpublishers.com.
Best viewed in


.jpg)


 Editorial Board Registrations
 Submit your Article
 Refer a Friend
 Advertise With Us
.jpg)


.jpg)


.bmp)
.jpg)
.png)
.jpg)


.jpg)


.png)

.png)


.png)


