
- About Us
- Information
-

The Author ensures that the research has been conducted responsibly and ethically with adherence to all relevant regulations. read more..
- For Authors
- For Reviewer
- Manuscript Guidelines
- Membership
- Publication Ethics
-
- Journals
- Reprints
- e-Books
- Videos
- Policies
- Contact Us
 COVID-19
- Submissions


Full Text
Research & Development in Material Science
A Photoelectric Sensor Based on a Three-Layered Polyaniline@Graphene@Cadmium Sulfide Composite: Synthesis, Characterization and Study of Physicochemical Properties
Azita Alipour* and Moslem Mansour Lakouraj
Polymer Laboratory, Organic Chemistry Department, Faculty of Chemistry, Iran
*Corresponding author:Azita Alipour, Polymer Laboratory, Organic Chemistry Department, Faculty of Chemistry, P.O. Box 13534-47416, Babolsar, Iran
Submission: January 08, 2024;Published: January 25, 2024

ISSN: 2576-8840 Volume 19 Issue 5
Abstract
This work reports photoelectric sensor application of a composite based on polyaniline (PANi), hydrolysed pectin (HPEc), graphene (GR) and cadmium sulfide (CdS) with examination of electrical, electrochemical and band gap properties. Cadmium sulfide was used for upturn of electrical and optical properties of the composite. The presence of graphene, CdS and PANi cause the synergy effect and the promotion of photoelectric sensor of the composite. Pectin was utilized as a polyelectrolyte for increase of solubility and processability of nanocomposite for better dipsertion of nanoparticles. The GR/CdS@HPEc-PANi and GR@PANi nanocomposites was synthesized via in-situ emulsion polymerization and characterized via FTIR, SEM, XRD, EDX, TEM and TGA analyses. TEM analysis showed a continuous regular network of of copolymer and cadmium sulfide dots on the crystalline layers of graphene. TGA thermal analysis displayed higher thermal stability about 40% for GR/CdS@HPEc-PANi with residual weight of 60g than of GR@PANi nanocomposite with residual weight of 20g. The electrochemical properties showed better electrochemical performance for the GR/CdS@HPEc-PANi relative to the GR@PANi nanocomposite. The band gap calculation obtained a band gap of about 2.7 for the nanocomposite. The photoelectric test showed the photoelectric sensitivity of the GR/CdS@HPEc-PANi nanocomposite toward light irradiation and the electron transfer impedance of the nanocomposite was reduced under light relative to dark conditions. The CV curves of the nanocomposite showed a non-linear behavior which indicate semiconducting nature of the nanocomposite. Also, chronoamperometry test showed the stability of the nanocomposite under different cycles and current.
Keyword: Polyaniline; Pectin; Cadmium Sulfide; Graphene; Photoelectric sensor; Electrochemical properties
Introduction
Photoelectric sensors as detection tools have attracted much attention in the recent years due to high sensitivity, fast responsibility, low cost and simple instrument These techniques have been favored compared to optical and electrochemical methods and attracted considerable attention and promising applications for example in field of photoelectric sensor devices due to combining light irradiation and electrochemical detection.
This sensor includes a photoelectric layer which is deposited on the surface of electrode and its electrical conductivity is reinforced under an applied voltage and the resulting information is stored on a recorder. The photoelectric layer is capable to strengthen the electrical field or electrical charge given to the medium.
In development of photoelectric sensors, the nanostructures based on nanowires, nanorods or nanotubes as photoactive materials are essential in terms of potential applications. This is owing to the increase of electron transfer via the formation of direct conduction path along electrolyte and electrode with higher surface area in this type of the nanostructures [1-11].
Heterogeneous nanostructures such as polymeric nanocomposites are stimulator structures for photoelectric devices compared to pure nanostructures. Good boning orientation is an important key to suitable performance in photoelectric devices. The linkage of conductive polymers with quantum dots causes the improvement of photoelectrochemical performance. Polyaniline can be utilized as a semiconductor nano polymer material because of its conductivity and electrochemical stability [12-14].
Quantum dots (QDs) with a narrow suitable bandgap as photoactive visible light nanomaterials were studied in this field. But QDs due to high recombination rate of photogenerated electronhole under light, shows weak photoelectrochemical activity. Therefore, the improvement of photoelectrochemical responsibility of QDs is a key issue for fabrication of photoelectrochemical sensors based on QDs [15].
Graphene is a new carbon nanomaterial with unique electronic and crystalline features were investigated in various research fields. Owing to unique electrical properties, mechanical strength and its facile processing condition, graphene has shown promising applications in advance of electronical and sensor devices. In addition, graphene is a useful nanomaterial for reinforcement of semicrystalline material features. The formation of hybrid QDs and graphene has been known as a suitable method for improvement of photoelectrochemical activity of QDs since coupling of graphene with QDs can increase charge separation rate of QDs due to high electrical conductivity. Meanwhile, high transparent morphology arising from graphene, arising from single-atom thickness doesn’t reduce light intensity and light intensity is arrived to material surface and upholds efficiency of photoelectrochemical sensors [16].
Pectin polysaccharide with functional groups like COOH and OH was used as surfactant and stabilizer for better dispersion and bonding of components. For example pectin can coordinate CdS QDs and interact with PANi via grafting and hydrogen bonding and interact with graphene via chain hydrophobic interactions [17].
In this study, the photoelectric sensor property of the GR/CdS@ HPEc-PANi has been studied due to high electrochemical and optical performance by the synergy between the graphene, CdS, and PANi. The nanocomposite samples of GR@PANi and GR/CdS@HPEc-PANi nanocomposites were synthesized via emulsion polymerization and characterized via FTIR, XRD, SEM, TEM, EDX, TGA analyses and investigated for band gap, electrochemical and photoelectric sensor properties. In fact, we suppose that by preparation of nanocomposites including CdS in polyaniline composite meanwhile improvement of electrical and mechanical properties its potential application in photoelectric sensors and optical diods is examined.
Experimental
Materials
The materials used in this work, including aniline, Cadmium nitrate (Cd(NO3)2), sodium sulfide (Na2S), sodium dodecyl sulfate (SDS) and other chemicals containing hydrochloric acid (HCl), sodium hydroxide (NaOH), dichloromethane (DCM) were prepared from merk. Pectin was purchased from Exir Co (Austria). Graphene was purchased from Nanomaterial Co (Ltd, Iran). Ammonium persulfate (APS) was bought from Asia Pajohesh Co (Ltd, Iran).
The FTIR analyses were taken by a broker tensor 27 FTIR spectrometer (Germany). The X-ray diffraction (XRD) spectra were acquired by a Philips PW1730 X-ray diffractometer (Netherlands) at a scan rate of 10 ºC/min. The scanning electron microscopy (SEM) and energy dispersive X-ray (EDX) analyses were accomplished by a field emission scanning electron microscopy (FESEM-edax TESCAN MIRA Π, Czech). The thermogravimetric analysis (TGA) was carried out by a DTA/TGA instrument (STA 504, BAHR, Germany) from 25 ºC to 600 ºC. The electrochemical experiments, including cyclic voltammetry (CV) and electrochemical impedance spectroscopy (EIS) were performed by a Biological SP150 electrochemical device. All the experiments were conducted in a three-electrode system with an integrated copper electrode as the working electrode (WE), platinum electrode as the counter electrode and Ag/AgCl as the reference electrode. The electrodes were prepared in DMSO solvent by using the dispersing of the samples in polyvinyl pyrrolidone.
Preparation of GR@PANi nanocomposite
The GR@PANi nanocomposite was synthesized via in-situ emulsion polymerization of aniline and GR in the presence of SDS as surfactant and dopant. Aniline and graphene were dispersed in DCM solvent with SDS, and then with the slowly addition of APS under N2 gas at 50 °C, the polymerization was completed. The graphene was dispersed in HCl solution (1M) to better dispersion. The reaction was continued for 24h under stirring at 50 °C to complete product formation. Finally, the obtained product was collected by simple filtration, washed with distilled water and acetone and dried in a vacuum oven at 45 °C.
Preparation of GR/CdS@HPEc-PANi nanocomposite
The GR/CdS@HPEc-PANi hybrid nanocomposite was produced through in-situ emulsion polymerization of aniline and HP in the presence of GR and CdS nanoparticles using SDS as surfactant and dopant. In a round-bottom three necked flask equipped with magnetic stirrer and inlet and outlet of N2 gas, 0.5g HP was treated with the slowly addition of 0.6g APS in 7mL distilled water under N2 at 50 ºC for 30min then 1g aniline and 3g SDS in 70mL DCM was added into the above mixture. The polymerization reaction proceeded to drop-wise addition of 29mL solution of APS (2.45g) to complete the polymerization. During the polymerization, a dispersion of 0.04g GR and 0.1g CdS nanoparticles in 25mL HCl (1M) was added into the polymerization mixture under sonication and the reaction was lasted for 24h under N2 gas at 50 ºC. Finally, the greenish dark product was separated by filtering and washed with distilled water and acetone and dried in a vacuum oven at 45 °C. The schematic illustration of the synthesized samples is depicted in Scheme 1.
Scheme 1:The schematic representation of the GR/CdS@HP-PA nanocomposite.

Result and Discussion
FTIR analysis
The FTIR of the nanocomposite indicated the characteristic peaks of PANi, HPEc, GR and CdS nanoparticles. In the following spectra, Figure 1A is the FTIR spectrum of the GR@PANi nanocomposite. The characteristic peaks of GR were appeared at 1500-1600cm-1 attributed to stretching vibrations of C=C bands, broad band seen at near ~3500cm-1 belongs to overlapped O-H and N-H stretching vibrations of PANi and HPEc. The peaks at ~1642-1700cm-1, ~1000-1100cm-1, ~3400-3500cm-1 related to C=O, C-O-C and O-H stretching vibrations of the Pectin molecules, and at ~1466cm- 1, ~1555cm-1, ~1238cm-1, and ~1297cm-1 correspond to C=C and C=N, C-H and C-N stretching of benzenoid units and quinoid rings of PANi respectively. In Figure 1B, infrared absorption behavior of the GR/CdS@HPEc-PANi hybrid nanocomposite represents all of the characteristic peaks assigned to HPEc, PANi and GR at the related areas. The peak attributed to the CdS vibrations was detected at ~ 614 and 681cm-1. Scheme 1 shows the schematic representation of the GR@HPEc-PANi and GR/CdS@HPEc-PANi nanocomposites.
Figure 1:The FTIR spectra of a) GR@PANi and GR/CdS@HPEc-PANi nanocomposites.

SEM microscopy
Figure 2 shows the SEM images of the nanocomposite in different scales. The morphology representation and structure of the GR@PANi and CdS/GR@HPEc-PANi nanocomposites in different scales are shown by SEM images in Figure 2 The images show a typical nano spherical structure with layers of graphene in the copolymer that covers CdS nanoparticles. The smooth surface of the as prepared nanolayer arrays in the GR@PANi nanocomposite can be clearly seen. The corresponding cross-sectional images in the insets of the CdS/GR@HPEc-PANi nanocomposite show that the nanolayers are well aligned with copolymer spheres.
Figure 2:The SEM images of the GR@PANi (A-D) and CdS/GR@HPEc-PANi (E-H) nanocomposites in different scales.

XRD analysis
The XRD spectrum showed crystallinity nature of the nanocomposite (Figure 3). As can be observed, the diffraction patterns showed a semicrystalline nature and the peaks at 2ϴ= 25°, 42° and 48° are attributed to (110 and 111) of PANi and (102,110,103,112) of characteristic crystalline plane reflections of CdS NPs. The nanocomposite showed a sharp and strong crystalline peak at 2ϴ=25° that can be attributed to the crystalline structure of GR, CdS and PANi and the synergy effect between components. The nanocomposite also indicated a peak at 2ϴ=18° ascribed to (010) reflection of cryatlline plane of PANi.
Figure 3:The XRD spectra of the GR@PANi and GR/CdS@HPEc-PANi nanocomposites.

EDX analysis
The EDS results (Figure 4 & Table 1) indicates the composition of C, N, O, Cd and S in the samples. The EDX analysis was utilized to confirm the presence of Cd and S elements in the GR/CdS@HPEc- PANi nanocomposite. The spectrum and weight ratios obtained for the existing elements are represented as 44%, 26%, 24%, 1% and 4% for C, O, N, Cd and S respectively. The EDX analysis was utilized to confirm the presence of Cd and S elements in the GR/CdS@HPPA nanocomposite.
Figure 4:The EDX spectrum of the GR/CdS@HPEc-PANi nanocomposite.

Table 1:The elemental ratios obtained by EDX analysis for GR/CdS@HP-PA.

TEM image
In TEM image (Figure 5), the GR/CdS@HPEc-PANi nanocomposite showed a crystalline continuous network of the GR layers with a gray shell of HPEc-PANi copolymer in which CdS nanoparticles can be seen as the inner dark core dots. In the GR/CdS@HPEc-PANi nanocomposite, the deposition of CdS nanoparticles and graphene layers in the matrix of HPEc-PANi copolymer can be seen as a regular network.
Figure 5:The TEM image of the GR/CdS@HPEc-PANi nanocomposite

Thermogravimetric analysis
Thermal stability of the samples was shown in Figure 6. The GR@PANi nanocomposite showed three weight losses from 25 to 100 °C attributed to water and volatile compounds, from about 170 °C to 250 °C assigned to the polymer decomposition and at 400 °C to 600 °C ascribed to degradation of the ring structure units of graphene. The GR/CdS@HPEc-PANi due to higher thermal stability showed two weight losses from 25-200 °C attributed to the water, gases and dopant compounds and from 220 to 600 °C attributed to the decomposition and degradation of polymer structure. As can observed, the GR/CdS@HPEc-PANi nanocomposite due to the presence of CdS and pectin nanoparticles and their affection on the increase of thermal stability showed higher thermal stability relative to the GR@PANi nanocomposite.
Figure 6:The TGA spectra of the GR@PANi and GR/CdS@HPEc-PANi nanocomposites.

Electrical conductivity
The electrical conductivity of GR/CdS@HPEc-PANi was reported in Table 2. The GR nanoparticles via π-π interactions with PA chains facilitate the charge transfers and increase the electrical conductivity. The CdS nanoparticles as electroactive centers via electrostatic interactions with polymer chains and π-π stacking interactions with the GR nanoparticles can enhance charge delocalization and afterwards electron transport in the GR/ CdS@HPEc-PANi nanocomposite [18]. Electrical conductivity was calculated via the below equation:
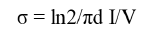
where σ is the conductivity (S cm-1), I is the applied current (mA), V is the voltage drop (mV) and d is the sample thickness (cm).
Table 2:The conductivity results of the samples.

Electrochemical Impedance Spectroscope (EIS)
The electrochemical resistance of the samples was determined via EIS test and the nyquist plots (EIS curves) are presented in Figure 7 as function of ohmic resistance. The diameter of the nyquist plots explains charge-transfer resistance between electrode and electrolyte. As seen from the nyquist plots, the electron-transfer resistance in the GR/CdS@HPEc-PANi nanocomposites was lower extensively than that of than the GR@PANi nanocomposite. This elucidates that the electrochemical process in the GR/CdS@HPEc- PANi nanocomposites can be influenced due to the presence of the GR, CdS nanoparticles and amphiphilic nature of pectin which help to easier transfer than the electrolyte, ions and electrons among electrodes. In fact, the nanoparticles with the increase of contact surface area and efficient electrostatic interactions enhance the electron transfers between the electrodes.
Figure 7:The EIS curves of the nanocomposites.

Photoelectric sensor
Figure 8:The CV (a), EIS (B and C), LSV (D and E) and choron-I-t curves (F) of the GR/CdS@HPEc-PANi nanocomposite.

Figure 4 shows the image of a photoelectric cell. The results are shown as CV, EIS, LSV and Chronon I-t in Figure 8. According to the results, the nanocomposite showed different electrochemical behavior in light and dark conditions which indicating of the light sensitivity of nanocomposite under electrical field and in fact photoelectrical sensitivity of the nanocomposite. The CV curve (Figure 8A) displays electron transfer process of the nanocomposite in which the oxidation/reduction current ratio is equal to 2, in the other word, due to getting away the oxidation and reduction peaks, the electron transfer process is an irreversible or semi reversible chemical reaction. Regarding to the EIS curves (Figure 8B & 8C) the electron transfer resistance of the sample in the vicinity of light was less than dark because the synergy effect between graphene nanosheets, CdS and PANi nanoparticles that leads to the decrease of electron transfer resistance. Moreover, PANi/HPEc by reducing the surface area of the composite and also the reduction of transmission distance of the electrolyte ions to the electrode through interchain, interfacial and electrostatic interactions cause increasing of charge transfers. The current-voltage relationship curves (linear scanning voltammetry) of the nanocomposite at room temperature are shown in Figure 8D & 8E. As can be seen, the current increases non-linearly with increasing applied voltage, therefore the nanocomposite reveals a non-ohmic behavior because V/I is constant. This behavior is indicative semiconductor nature of the nanocomposite and its capability for application in electronic devices. Furthermore, the LSV curves show that the amount of the recorded current in light condition was more compared to dark condition that indicates the photoelectric sensitivity of the nanocomposite. Chronoamperometry curve (Figure 8F) exhibits relative stability of the nanocomposite in repetitive cycles for the reason that the current drop was not noticeable, and the flow was a constant trend.
Band gap
The band gap is one of the physical properties of polymer/ semiconductor composites which is related to electronic structures and optical properties of composites that was obtained according to the following:
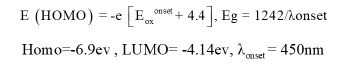
The band gap was obtained from difference of E (homo) and E (lumo), 2.7ev according to the onset voltage of -2.5. The band gap diagram of the nanocomposite was shown in Figure 9.
Figure 9:Band gap diagram of the GR/CdS@HPEc-PANi nanocomposite.

Conclusion
In this study, the photoelectric sensing property of the GR/CdS@ HPEc-PANi has been studied. The nanocomposite samples of GR@ PANi for comparison and GR/CdS@HPEc-PANi nanocomposites were synthesized via chemical copolymerization and characterized via FTIR, XRD, SEM, EDX, TEM, and TGA analyses and investigated for band gap, electrochemical and photoelectric sensor properties. The electrochemical results showed higher electron transfer for the GR/CdS@HPEc-PANi nanocomposite and photoelectric sensor indicated photoelectric performance, non-ohmic behavior and photocurrent stability at different cycles for the GR/CdS@HPEc- PANi nanocomposite. The GR/CdS@HPEc-PANi nanocomposite showed higher thermal stability, higher crystallinity, more homogenous morphology and better electrochemical properties than GR@PANi nanocomposite. The band gap results elucidated a normal band gap of 2.7 for the GR/CdS@HPEc-PANi nanocomposite.
References
- Wang GL, Xu JJ, Chen HY, Fu SZ (2009) Label-free photoelectrochemical immunoassay for α-fetoprotein detection based on TiO2/CdS hybrid. Biosensors and Bioelectronics 25(4): 791-796.
- Tu W, Dong Y, Lei J, Ju H (2010) Low-potential photoelectrochemical biosensing using porphyrin-functionalized TiO2 Analytical Chemistry 82(20): 8711-8716.
- Haddour N, Chauvin J, Gondran C, Cosnier S (2006) Photoelectrochemical immunosensor for label-free detection and quantification of anti-cholera toxin antibody. Journal of the American Chemical Society 128(30): 9693-9698.
- Ikeda A, Nakasu M, Ogasawara S, Nakanishi H, Nakamura M, et al. (2009) Photoelectrochemical sensor with porphyrin-deposited electrodes for determination of nucleotides in water. Organic letters 11(5): 1163-1166.
- Wang P, Dai W, Ge L, Yan M, Ge S, et al. (2013) Visible light photoelectrochemical sensor based on Au nanoparticles and molecularly imprinted poly (o-phenylenediamine)-modified TiO2 nanotubes for specific and sensitive detection chlorpyrifos. Analyst 138(3): 939-945.
- Koval CA, Howard JN (1992) Electron transfer at semiconductor electrode-liquid electrolyte interfaces. Chemical Reviews 92(3): 411-433.
- Wang G, Wang Q, Lu W, Li J (2006) Photoelectrochemical study on charge transfer properties of TiO2-B nanowires with an application as humidity sensors. The Journal of Physical Chemistry B 110(43): 22029-22034.
- Park JH, Kim S, Bard AJ (2006) Novel carbon-doped TiO2 nanotube arrays with high aspect ratios for efficient solar water splitting. Nano Letters 6(1): 24-28.
- He X, Hu C, Feng B, Wan B, Tian Y (2010) Vertically aligned TiO2 nanorod arrays as a steady light sensor. Journal of the Electrochemical Society 157(11): J381.
- Paulose M, Varghese OK, Mor GK, Grimes CA, Ong KG (2005) Unprecedented ultra-high hydrogen gas sensitivity in undoped titania nanotubes. Nanotechnology 17(2): 398.
- Li X, Hu C, Zhao Z, Zhang K, Liu H (2013) Three-dimensional CdS nanostructure for photoelectrochemical sensor. Sensors and Actuators B: Chemical 182: 461-466.
- Wang H, Yi G, Zu X, Qin P, Tan M, Luo H (2016) Photoelectric characteristics of the p–n junction between ZnO nanorods and polyaniline nanowires and their application as a UV photodetector. Materials Letters 162: 83-86.
- Li J, Li H, Xue Y, Fang H, Wang W (2014) Facile electrodeposition of environment-friendly Cu2O/ZnO heterojunction for robust photoelectrochemical biosensing. Sensors and Actuators B: Chemical 191: 619-624.
- Zhang X, Huang X, Yang Y, Wang S, Gong Y, et al. (2013) Investigation on new CuInS2/carbon composite counter electrodes for CdS/CdSe cosensitized solar cells. ACS Applied Materials & Interfaces 5(13): 5954-5960.
- Rawal SB, Do Sung S, Moon SY, Shin YJ, Lee WI (2012) Optimization of CdS layer on ZnO nanorod arrays for efficient CdS/CdSe co-sensitized solar cell. Materials Letters 82: 240-243.
- Wang Y, Ge S, Zhang L, Yu J, Yan M, et al. (2017) Visible photoelectrochemical sensing platform by in situ generated CdS quantum dots decorated branched-TiO2 nanorods equipped with Prussian blue electrochromic display. Biosensors and Bioelectronics 89: 859-865.
- Zhang Q, Yang P, Shen J, Yu J (2019) Graphene-amplified photoelectric response of CdS nanoparticles for Cu2+ Journal of Nanoscience and Nanotechnology 19(12): 7871-7878.
- Méndez PA, López BL (2020) Polyelectrolyte nanoparticles of amphiphilic chitosan/pectin from banana peel as potential carrier system of hydrophobic molecules. Polymers 12(9): 2109.
© 2023 Azita Alipour. This is an open access article distributed under the terms of the Creative Commons Attribution License , which permits unrestricted use, distribution, and build upon your work non-commercially.
Editor In Chief


.jpg)


Signup for Newsletter

Quick Links
 Editorial Board Registrations
 Submit your Article
 Refer a Friend
 Advertise With Us
Our Recent Edition

.jpg)


Top Editors


.jpg)


.bmp)
.jpg)
.png)
.jpg)


.jpg)


.png)

.png)


.png)


Financial Support

Sponsors

Latest e-Books

Latest Video

 a Creative Commons Attribution 4.0 International License. Based on a work at www.crimsonpublishers.com.
Best viewed in
a Creative Commons Attribution 4.0 International License. Based on a work at www.crimsonpublishers.com.
Best viewed in