- Submissions

Full Text
Research & Development in Material Science
Quantitative Determination of Uranium with UV-Visible Spectroscopy in Nitrated Media at High Concentration
Raja Azadar Hussain*
UV-vis Spectroscopy Labs, Quaid-i-Azam University Islamabad, Pakistan
*Corresponding author:Raja Azadar Hussain, UV-vis Spectroscopy Labs, Quaid-i-Azam University Islamabad, 45320, Pakistan
Submission: June 12, 2023;Published: June 28, 2023

ISSN: 2576-8840 Volume 19 Issue 1
Abstract
This article presents a new method for uranyl ion determination in nitric acid media via UV-vis spectroscopy. Method reported in this article does not require the determination of nitrate ion concentrations (requirement for all previously reported methods with UV-vis spectroscopy) for the estimation of uranyl ions. Results of UV-vis spectroscopy have been verified by Fluorimetry, titrimetry and ICP-OES.
Keywords:Uranyl ion; UV-vis spectroscopy; Quantitative analysis
Introduction
Due to energy crises in the world, safe use of uranium for betterment of human kind is mandatory. Correct quantitative analysis with minimum error, least analysis time, simple procedure and low cost is a requirement to achieve the task. Purification of uranium is carried out by solvent extraction of uranyl nitrate from aqueous media to tributyl phosphate/n-hexane [1]. After this step uranyl nitrate is extracted back to the aqueous media for impurity determination in quality assessment samples. Main cause of higher errors in UV-vis spectroscopic determination of uranyl nitrate in nitrated media is the unknown concentrations of nitrates in the analyte. It has been reported that different known concentrations of nitrate ions in the analyte effect the absorption pattern of uranyl nitrate [2]. Attempts have been made previously to determine uranyl ions and nitrate ions simultaneously with 5% error in uranyl ions and 15% error in nitrate ions concentrations [1,3,4]. In another effort using partial least square refinement Lascola et al. [5] have determined uranyl ions with 5% error and nitrate ions with 10% error. Extensive work has been done on the speciation of uranyl ion aqueous solutions [6-10]. It has been formerly reported that uranyl ion provides twenty-four bands between 179nm and 500nm in perchlorate media. These twenty-four bands were grouped into seven major peaks at 414nm, 318nm, 282nm, 271nm, 204nm, 181nm and 164nm containing 1-12 bands, 13-19 bands, band 20, band 21, band 22, band 23 and band 24 respectively [4,11,12]. UV-vis spectroscopic determination of uranyl ions in different nonaqueous solvents and ammonium nitrate have also been reported by Kaplan et al. [12,13].
It was heretofore thought that UV-vis spectroscopy may be inferior to other techniques because in it, changes is chemical environment can produce similar effects which are produced by changes in the uranyl ion concentrations [14]. To avoid this problem stock solution was generally freed from nitrate ion concentration by precipitating the uranyl nitrate with sodium hydroxide and then solution was prepared with perchloric acid [14]. However, speciation and spectroscopy of uranyl ion has been extensively studied in a doctoral thesis by Nicholas Alexander Smith of Lake Superior State University with all the necessary analytical details [14]. Details of molecular structures, electronic spectra and reactivities of U(IV) and U(VI) have been put forward in his PhD thesis by Koichiro Mizuoka of Tokyo Institute of Technology [15].
Mostly, in practical scenario uranyl nitrate extraction labs are working independently from analytical labs and it is impossible to control the matrix of analyte for UV-vis spectroscopic determination of uranium via uranyl nitrate. Therefore, it is need of the time to have a unified process for UV-vis spectroscopic determination of uranium which should be independent of collaboration between two different groups or labs. Keeping in view all above mentioned details we have stated a simple method of matrix match between analyte (in the sample cuvette) and blank (blank cuvette) in this article. This method has less than 1% error for quantitative determination of uranyl nitrate in nitrated media. We have also compared the calibration curves of 1g/L, 2g/L, 4g/L, 8g/L, 16g/L, 32g/L and 64g/L of commercially available uranyl nitrate hexahydrate for seven prominent peaks between 350nm and 500nm for method I and method II. In method I, UV-vis spectra of uranyl nitrate hexahydrate solutions have been recorded with doubly distilled water as blank for epsilon measurements and for method II, 2 mL of each standard solution was first dried separately in a beaker and then redissolved in 5% nitric acid and 5% nitric acid was also used as a blank. With method II operator is exactly sure about the concentration of nitrates in the samples and blank. Use of 5% nitric acid solution is mandatory because simple aqueous solution of dried uranyl nitrate hexahydrate does not provide readable peaks. Results obtained with UV-vis spectroscopy have been verified with ICP-OES, fluorimetry and titrimetry.
Materials and Instruments
Uranyl nitrate hexahydrate was purchased from BDH Chemical Ltd pool England and was used as such without any further purification. Nitric acid and phosphoric acid of analytical grade were purchased from Sigma Aldrich and used as they were. Doubly distilled water was prepared in the lab with Heinrich John. Muller Ritterbude distiller. Mass measurements were carried out on Sortorius BP 2215 which measures in a range of 0.1mg and 220g. Volume measurements were carried out with Sortorius biohit micropipettes with ranges 20-200μL and 100-1000μL. UVvis data was recorded on UV-1800 Shimadzu spectrophotometer Japan equipped with UV Probe 2.62 software. All the solutions were prepared in Iwaki Pyrex glassware and UV measurements were recorded in quartz cuvettes of 1cm path length. Fluorometic measurements were carried out on Jarrell Ash Fluorometer of Fisher Scientific Co. and ICP-OES data were recorded on Varian Liberty AX Sequential ICP-OES.
Method
1g/L, 2g/L, 4g/L, 8g/L, 16g/L, 32g/L and 64g/L uranyl nitrate hexahydrate stock standard solutions were prepared by dissolving 0.1g, 0.2g, 0.4g, 0.8g, 1.6g, 3.2g and 6.4g uranyl nitrate hexahydrate respectively in separate 100mL volumetric flasks using doubly distilled water as solvent. Epsilon values from these standards were determined using two different methods. In first method, 2ml uranyl nitrate hexahydrate solution of each standard was placed separately in the sample cuvette and doubly distilled water was used as a blank. In the second method, 2ml of each standards solution was dried to orange brown color and then redissolved in 0.1mL nitric aicd and volume was made up to 2mL. Same dilution of concentrated nitric acid was used as a blank.
For unknown samples which have color intensities (observed with naked eye) of more than 64g/L standard solution; 0.1mL aliquot was taken in a 25mL beaker and completely dried on a hot plate to orange red color. For unknown samples with color intensities (observed with naked eye) of less than 64g/L standard solution; 2mL aliquot was taken in a 25mL beaker and completely dried on a hot plate to orange red color. After cooling, for both type of samples; 0.1mL of concentrated nitric acid was added and then the volume was made up to 2mL. A blank solution was prepared containing 0.1mL of concentrated nitric acid in 2mL of aqueous solution.
Figure 1:Plot of absorbance vs. wavelength of different uranyl ion concentrations at different scan rates showing negligible effect of scan rate on absorbance behavior of 1-64g/L uranyl nitrate hexahydrate
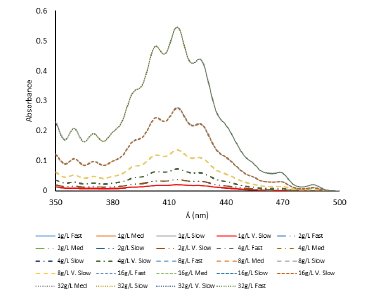
To see the effect of scan rate on the experimental results, all uranyl nitrate hexahydrate solutions were monitored at different scan rates with negligible effect (Figure 1). After this finding all the UV-vis spectroscopic measurements were carried out at fast scan rate and sampling interval of 1nm with single scan mode and slit width of 1nm.
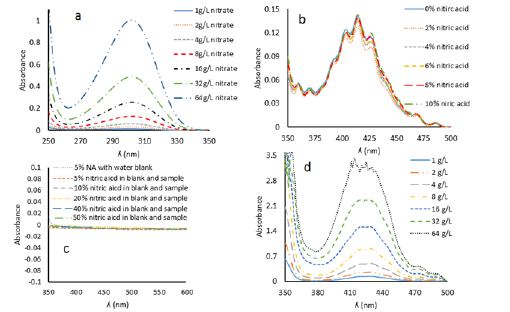
Nitrate ions absorb in the region between 262nm to 348nm (Figure 2a) and it has been reported that they interfere the absorption of uranyl nitrate hexahydrate (Figure 2b); [14]. Therefore, instrument was checked by the addition of same amounts of nitrate in the sample and blank cuvettes (Figure 2c). The readings for absorption were exactly at zero and in case where nitrate ions were not nullified via addition in blank its effect was quite evident by increase in the absorption. This means that instrument can nullify the nitrate ions concentration up to 50% if we add exactly the same amount of acid in the blank cuvette between 350nm and 500nm.
Figure 2:a) Plot of absorbance vs. ʎ (nm) of different nitrate concentrations using water as blank. b) Plot of absorbance vs. ʎ (nm) of 8g/L uranyl nitrate hexahydrate with increasing concentrations of nitric acid in the sample cuvette. c) Plot of increasing nitrate concentrations in sample and blank cells. d) Plot of absorbance vs. ʎ (nm) of dried uranyl nitrate hexahydrate solutions redissolved in distilled water.
Results and Discussions
Our findings show that uranyl nitrate hexahydrate provides seven clearly detectable peaks in a region between 350nm and 500nm by UV-probe 2.62 software at 359nm, 369nm, 403nm, 414nm, 426nm, 468nm and 486nm (Figure 1). These peaks between 350nm and 500nm are attributed to ligand to metal charge transfer from 2p orbital of axial oxygen atom to 5f orbital of central uranium atom in uranyl nitrate with vibronic structure [15]. If crystal structure of uranyl nitrate hexahydrate is observed it reveals that central linear uranyl ion with an angle very close to 180ᴼ [16] is surrounded by six oxygen atoms in equatorial plane. Four oxygen atoms are from two bidentate nitrate groups and two are from two water molecules in inner coordination sphere (Figure 3); [17]. These transitions are spin allowed but forbidden because of same parity (gerade to gerade). Region below 350nm was not resolvable because of intense absorption due to dipole allowed transitions between equatorial ligands and central uranium [18].
Nitrate concentration should be exactly known for the practical use of UV-vis spectroscopy in uranium estimation [14]. In practical situations, uranium processing involves the solutions of unknown matrices and it is not possible to know the exact concentration/ amount of nitric acid solutions which have been used for extraction. It is need of the time for analytical persons to have a method for exact matrix match of the analyte and standards.
For this purpose, UV-vis spectra of different concentrations (1g/L, 2g/L, 4g/L, 8g/L, 16g/L, 32g/L and 64g/L) of uranyl nitrate hexahydrate was first recorded using doubly distilled water as blank (Figure 4a). This provided clear and beautiful spectra synchronized with the literature reported spectra of uranyl nitrate hexahydrate [18]. Epsilon values of all these spectra were calculated for comparison with second experimental results (next paragraph, Figure 4b).
Secondly, 2ml of standard solutions (1g/L, 2g/L, 4g/L, 8g/L, 16g/L, 32g/L and 64g/L) were completely dried in separate beakers and then redissolved in doubly distilled water. Now the compositions of solutions were exactly known i.e. these solutions do not contain any nitrate from the nitric acid. But when the spectra were recorded in UV-vis spectroscopy they were flat and unclear (Figure 2d). This means that thermal treatment of uranyl nitrate solutions for drying, changes their chemical composition. The spectra which were obtained in Figure 2d were more plausibly for the solutions of orange red colored UO3. nH2O in traces of aqueous uranyl nitrate. More precisely it may be the mixture of UO3. nH2O and uranyl nitrate stoichiometries. It has been previously reported that UO3. nH2O are soluble in aqueous uranyl nitrate solutions [15]. To resolve this problem, 2mL of uranyl nitrate hexahydrate solutions were taken in separate beakers from each stock standard solution and dried. After drying, 0.1mL of concentrated nitric acid was added in each beaker containing the standard solutions and this addition was also made in blank and then the volume was made up to 2mL. Now, spectra were clear and epsilon values were calculated from these spectra (Figure 4c). Comparison with un-dried uranyl nitrate samples (previous paragraph, method I) showed that epsilon of spectral group which were dried (method II) are different from undried samples at 1/1000 to 1/10,000 of a decimal point (Figure 4d). This comparison has been given in Table 1.
Figure 3:Inner coordination sphere of uranyl nitrate hexahydrate [17]..
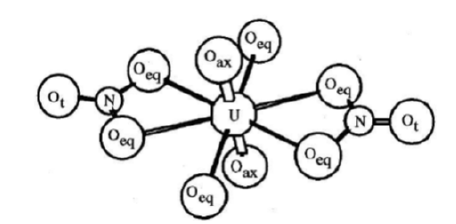
Figure 4:a) Plot of Absorbance vs. ʎ (nm) of different concentrations of uranyl nitrate hexahydrate of undried samples (method I). b) Plot of absorbance vs. concentration of all the ʎmax values of undried samples (method I). c) Plot of absorbance vs. ʎ (nm) of different concentrations of uranyl nitrate hexahydrate of dried samples (method II). d) Plot of absorbance vs. concentration of all the ʎmax values of dried samples (method II).
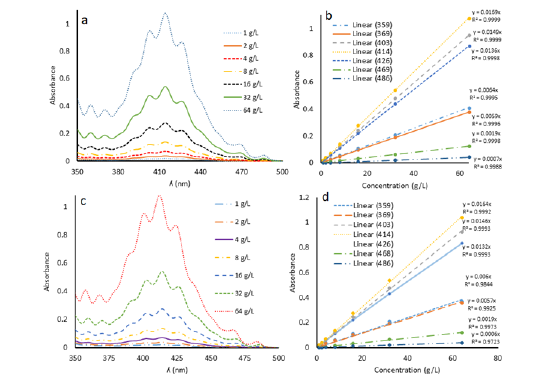
Table 1:Absorbance of all uranyl nitrate hexa hydrate solutions at ʎmax of seven peaks and corresponding epsilon calculations for method I and method II.
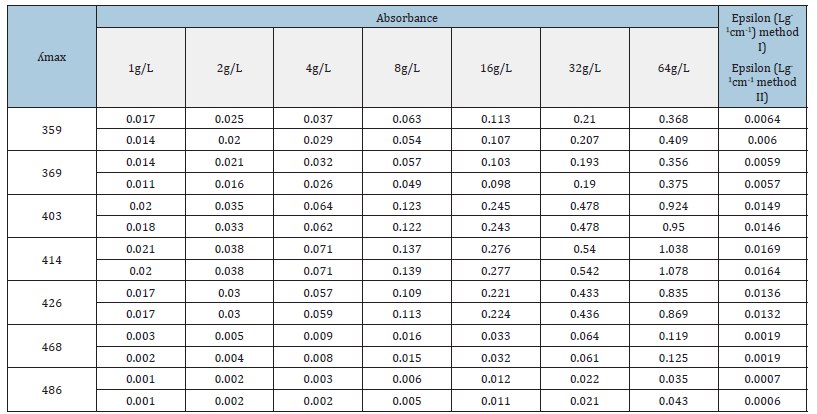
It is evident from Table 1 that precision of absorbance values of all the concentrations is very good for peaks at 403nm, 414nm, 426nm and 468nm when we compare method II and method I. Although the peaks at 359nm and 369nm are well identified by UVprobe 2.62 software and instrument had the ability to nullify the effect of nitrate ion concentration when similar quantities of nitric acid were added in sample and blank cuvettes (Figure 2c) but the values of absorbance are not precise when we compare the results of method II and method I samples. This may be because of two reason; firstly, thermal effect during drying are not controllable at these wavelengths and secondly because of the minor concentrations of nitrate ions which are not detectable directly by the instrument but they are effecting the wavelengths (359nm and 369nm) which are close to the nitrate absorption region (262nm to 348nm, Figure 3a).
Table 2:Concentrations of unknown samples U-I and U-II.

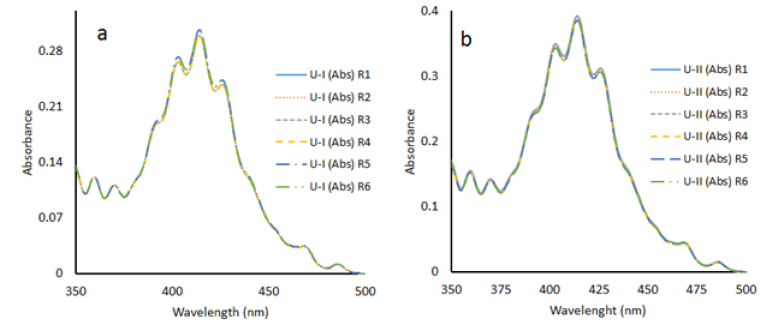
We also determined the concentrations of two unknown samples with method II and results of UV-vis spectroscopy were verified with fluorimetry, titrimetry and ICP-OES (Table 2). Six replicates of both unknown solutions U-I and U-II were monitored with UV-vis spectroscopy and our results show good control on the spectral intensities for all the six concentrations of both the samples (Figure 5). Comparison of the results of UV-vis spectroscopy for all the seven peaks and peaks at 403nm, 414nm and 426nm only is also given in Table 2 and shows a deviation of 1.71% for U-I and 2.61% for U-II. If we compare the results of UV-vis spectroscopy with other techniques it reveals us that considering three peaks for the calculation of the results is better than considering all the peaks for calculation of concentrations i.e. results of UV-vis spectroscopy calculated with the epsilon values of peaks at 403nm, 414nm, and 426nm together are in agreement with the results of other techniques.
Figure 5:a) Plot of absorbance vs. ʎ (nm) of six replicates (R1 to R6) of unknown solution U-I. b) Plot of absorbance vs. ʎ (nm) of six replicates (R1 to R6) of unknown solution U-II.
Conclusion
Instead of determining the uranyl ion concentration and nitrate ion concentrations simultaneously, a method of matrix match between the analyte and blank has been successfully developed for high concentration samples (150g/L to 250g/L uranium) with less than 1% error. Epsilon values of different concentrations of uranyl nitrate hexahydrate in aqueous media have been successfully compared with epsilon values of samples containing 5% nitric acid solution in the sample and blank with a difference of 1/1000 to 1/10,000 of a decimal point. Results of considering the epsilon values of all the seven peaks (359nm, 369nm, 403nm, 414nm, 426nm, 469nm and 486nm) in concentration determination have been compared with considering three peaks (403nm, 414nm and 426nm) for concentration determination and both these results show a difference of 1.71% and 2.61% for 177.2g/L uranium sample and 212.5g/L uranium sample respectively.
References
- Weigel F, Analytical Chemistry of Uranium. 92U238.03. Published v. i.e. Academy of Sciences of the USSR by Ryabchikov DI and Senyarin MM (Edr.), from Russ. trans. v. N Kaner (1963) Series: Analytical Chemistry of Elements. Israel Program for Scientific Translations, Jerusalem 1963. Angewandte Chemie 77(14): 631-632.
- Klygin AE, Zavrazhnova DM, Kolyada NS (1970) Uranyl and lanthanum ion complexing with arsenazo III in the perchloric acid solutions. Zhurnal Neorganicheskoj Khimii 15(3): 739-744.
- Bostick D (1978) Simultaneous analysis of uranium and nitrate. Oak Ridge National Lab., Tennessee, USA.
- Warburton J, Weck P, Smith N, Czerwinski K (2010) Second place-use of uv-visible spectroscopy to determine solution chemistry under used nuclear fuel reprocessing conditions. JNMM-Journal of the Institute of Nuclear Materials Management 39(1): 28.
- Lascola R (2002) On line spectrophotometric measurement of uranium and nitrate in H canyon. Savannah River Site, USA.
- Silva R, Nitsche H (1995) Actinide environmental chemistry. Radiochimica Acta 70(s1): 377-396.
- Meinrath G, Kato Y, Yoshida Z (1993) Spectroscopic study of the uranyl hydrolysis species (UO2)2 (OH)22+. J Radioanal Nucl Chem 174(2): 299-314.
- Palmer DA, Nguyen-Trung C (1995) Aqueous uranyl complexes. 3. Potentiometric measurements of the hydrolysis of uranyl (VI) ion at 25 C. J Sol Chem 24(12): 1281-1291.
- Moll H, Geipel G, Reich T, Bernhard G, Fanghänel T (2003) Uranyl (VI) complexes with alpha-substituted carboxylic acids in aqueous solution. Radiochimica Acta 91(1): 11-20.
- Glorius M, Moll H, Bernhard G (2007) Complexation of uranium (VI) with aromatic acids in aqueous solution–a comparison of hydroxamic acids and benzoic acid. Radiochimica Acta 95(3): 151-157.
- Bell J, Biggers R (1968) Absorption spectrum of the uranyl ion in perchlorate media III. Resolution of the ultraviolet band structure; some conclusions concerning the excited state of UO22+. J Mol Spectr 25(3): 312-329.
- Zanonato P, Di Bernardo P, Bismondo A, Liu G, Chen X, et al. (2004) Hydrolysis of uranium (VI) at variable temperatures (10-85 C). J Am Chem Soc 126(17): 5515-5522.
- Kaplan L, Hildebrandt R, Ader M (2010) The trinitratouranyl ion in organic solvents. J Inorg Nucl Chem 2(3): 153-163.
- Smith NA (2010) Speciation and spectroscopy of the uranyl and tetravalent plutonium nitrate systems: Fundamental studies and applications to used fuel reprocessing.
- Mizuoka K (2006) Studies on molecular structures, electronic spectra, and reactivities of uranyl (V) and-(VI) complexes. Tokyo Institute of Technology, Japan.
- Denning R, Morrison I (1991) The electronic structure of actinyl ions: the excited-state absorption spectrum of Cs2UO2Cl4, Chem Phys Lett 180(1-2): 101-104.
- Thompson HA, Brown GE, Parks GA (1997) XAFS spectroscopic study of uranyl coordination in solids and aqueous solution. American Mineralogist 82(5-6): 483-496.
- Colletti LM, Copping R, Garduno K, Lujan EJ, Mauser AK, et al. (2017) The application of visible absorption spectroscopy to the analysis of uranium in aqueous solutions. Talanta 175: 390-405.
© 2023 Raja Azadar Hussain. This is an open access article distributed under the terms of the Creative Commons Attribution License , which permits unrestricted use, distribution, and build upon your work non-commercially.
 a Creative Commons Attribution 4.0 International License. Based on a work at www.crimsonpublishers.com.
Best viewed in


.jpg)


 Editorial Board Registrations
 Submit your Article
 Refer a Friend
 Advertise With Us
.jpg)


.jpg)


.bmp)
.jpg)
.png)
.jpg)


.jpg)


.png)

.png)


.png)


