
- About Us
- Information
-

The Author ensures that the research has been conducted responsibly and ethically with adherence to all relevant regulations. read more..
- For Authors
- For Reviewer
- Manuscript Guidelines
- Membership
- Publication Ethics
-
- Journals
- Reprints
- e-Books
- Videos
- Policies
- Contact Us
 COVID-19
- Submissions


Full Text
Research & Development in Material Science
Optical and Electrical Properties of Fe2-xSmxO3 Compounds (x = 0, 1, 2) at Room Temperature
Asam Ajmi1, Ibrahim Durayazi Alruwaili2, Saleh M Altarifi3, Abdulrahman Mallah2, Mohamed Houcine Dhaou3 and Abdallah Ben Rhaiem1*
1Laborartory LaSCOM faculty of science of Sfax, University of Sfax, Tunisia
2 Department of Chemistry College of science, Qassim University Buraydah, Saudi Arabia
3Department of Physics College of science, Qassim University Buraydah, Saudi Arabia
*Corresponding author:Abdallah Ben Rhaiem, Laboratory LaSCOM, Faculty of sciences of Sfax, University of Sfax, Tunisia
Submission: February 13, 2023;Published: April 13, 2023

ISSN: 2576-8840 Volume 18 Issue 3
Abstract
In this paper, we are interested in the synthesis of Fe2O3, Sm2O3 and FeSmO3 by sol-gel method based on the Pechini’s route. Structural, vibrational, electrical and optical properties have been investigated. X-ray powder diffraction analysis indicated that these compounds are well crystallized in the hexagonal, monoclinic and orthorhombic system with R-3c, C21/m and Pnma space group, respectively. Vibrational study by means of FTIR spectroscopy confirms the existence of the functional group for each compound. The optical properties of compounds prepared were measured by means of the UV-vis absorption spectrometry at room temperature in the spectral range (200-800) nm in order to deduce the absorption coefficient α and optical band gap Eg. Besides, the electrical conductivity of these materials was analyzed by means of the impedance spectroscopy technique. Nyquist plots analysis revealed the presence of only contribution for these compounds associated with grain. In order to explain the impedance results an equivalent circuit has been proposed.
Keywords:X-ray powder diffraction; FTIR spectroscopy; UV-vis absorption; Equivalent circuit
Introduction
Due to their great potential for addressing some fundamental scientific issues about low dimensionality and applications, metal oxides nanostructures have attracted extensive interest over the past decade [1]. Among the most important metal oxides for industrial materials it exists iron oxides and samarium oxide. They exhibit various attractive physical and chemical properties due to differences in the valence state of their ions and/or crystal structure [2]. Ferric oxide (Fe2O3) has four polymorphs is used as a raw material for magnetic materials and cathodes for lithium ion-batteries is used as a magnetic storage material due to its ferromagnetic properties [3]. While the oxides of rare earths such as samarium has many important applications, including high-efficiency phosphors and catalysts. They show good catalytic properties in several reactions, including the synthesis of ammonia and oxidative coupling of methane [4,5].
The objective of the present work is to synthesize in the first step the compounds Fe2O3, Sm2O3 and FeSmO3. Then, our samples were characterized by X-ray powder diffraction. FTIR spectroscopy is used to study the vibrational modes and finally the electric and optical properties were studied.
Experimental Details
Preparation
The oxide Fe2O3, Sm2O3 and FeSmO3were prepared by sol-gel method based on the Pechini’s route using stoichiometric amounts of Samarium (III) nitrate hexahydrate Sm2sub>(NO3)3.6H2O, Iron (III) nitrate nonahydrate Fe2(NO3)3.9H2O and Ammonium hydroxide NH3.H2O. Firstly, stoichiometric amounts of metal nitrates were dissolved completely in distilled water to obtain a mixed solution. Subsequently, a controlled amount of citric acid were incorporated and dissolved with stirring. The molar ratio was fixed as 1:1 of nitrates to citric acid and pH of the solution was adjusted by adding an amount of ammonia solution. Then the solution heated under stirring to 373K followed by the addition of ethylene glycol as a polymerization agent. Heating, continued until obtaining a gel. The obtained wet gel was dried to obtain a foamy dry, which was grounded in a mortar, followed by heating at 773K for 24h in air, and then heating at 973K for 24h, after grinding, and then samples were heating at 1173K for 24h. In order to obtain the desired crystalline phase, the samples grinding and heating at 1473K during a sufficiently long annealing period 48h. Then, all the results found in the present investigation presented for samples sintered at 1473K. The details of synthesis process of the sample represented in Figure 1.
Figure 1:Schematic of the Pechini method of making metal/organic gels. (The evolution of ‘sol– gel’ chemistry as a technique for materials synthesis) A. E. Danks, S. R. Hall b and Z. Schnepp.

Material characterization/
To ensure the homogeneity and phase purity of synthesized compounds a high precession Xray Powder Diffraction (XRD) was carried out. The measurements were checked by Panalytical X’Pert Prompd operating with copper anticathode radiation CuKα (λ= 1.5060Å) at room temperature in the angular range 20°<2θ<90°. Therefore, in order to study the optical properties of Fe2O3, Sm2O3 and FeSmO3 compounds, the UV-Vis spectra were obtained by a UV-VIS spectrophotometer (Shimadzu UV-3101PC)using a source emitting wavelength radiations varying between 200 and 800nm on a pellet of each compound.
The dielectric measurements, which are performed in a wide range of frequency, are deduced from the admittance spectroscopy using an Agilent 4294A analyzer and Janis VPF800 cryostat. Before that, a thin Al layer with a disc shape is deposited on both sides of each sample.
Results and Discussion
Structural analysis
Crystalline parameters: The structural refinement of the compounds of Fe2O3, Sm2O3 and FeSmO3 has been refined using the Rietveld method via the Full Prof software [6]. For the simulation of the peak shapes, we used the pseudo-Voigt function, and the lattice parameters were determined by the Rietveld program, investigated as starting values.
Figures 2a-2c shows X-ray diffractions patterns recorded at room temperature, including the observed, the calculated profile and as well as the difference profile of Fe2O3, Sm2O3 and FeSmO3 respectively. All the reflection peaks corresponding to 2θ values are crystallized in the hexagonal system with R-3c space group for Fe2O3 compound, in the monoclinic system with C21/mspace group for Sm2O3, and orthorhombic system with Pnma, space group with FeSmO3 compound.
Figure 2:Refined XRPD patterns of Fe2O3 (a), Sm2O3 (b) and FeSmO3 (c) compounds: The dotted line indicates experimental data and calculated data are represented by black continuous lines. The lowest curve in blue shows the difference between experimental and calculated patterns. The vertical bars in green indicate the Bragg positions..

The obtained reliability factors and lattice parameters of the three compounds given in Table 1 are in good agreement with the published results
Table 1:Crystallographic parameters of Fe2O3, Sm2O3 and FeSmO3 compounds refined from Rietveld analysis of XRPD data.

Crystallite size/
The average crystallite size of our samples can be estimated from the X-ray diffraction spectrum based on the width at half height of the main diffraction peaks.
For this we have adopted the following Debye Scherrer formula (equation 1) [7].
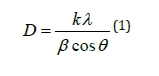
Where
D: the average size of the crystallites (nm).
K: Scherrer’s constant: For the full widths of the lines this
factor equal to 1 while for the widths at mid-height this factor
equal to 0.94.
λ: the X-ray wavelength
β: the FWHM of the diffraction peak
θ: represents the angle of the most intense peaks
The values of crystallite size were found to be 102nm, 58nm and 56nm for SmFeO3, Fe2O3 and Sm2O3 respectively.
Structural description: The bibliographic study shows that in the structure of the Fe2O3 compound the iron and oxygen atoms are placed in the (0, 0, z) and (x, 0, 1/4) respectively, where z=0.35 and x=0.31 (24,25). Oxygen atoms occupy a Hexagonal Close- Packed (HCP) arrangement with 2/3 of the octahedral positions being occupied by the iron atoms. Along z axis, one empty and two filled octahedrons sharing common face alternate. Due to a mutual repulsion between the neighboring cation layers, cations are shifted from the centers of octahedrons towards the vacant positions (Figure 3); [8,9].
Figure 3:Representation of the structure of Fe2O3

In the Sm2O3 structure the Sm(1) and Sm(2) atoms are effectively seven-coordinate with the SmO?7 group derived from an octahedron by adding the seventh oxygen atoms along a three- fold axis [10]; (Figure 4). As is illustrated in Figure 4 this has the effect of displacing the Sm towards one of the octahedral faces. The Sm-O bond distances of the six closest oxygen anions are in the range 2.29-2.55Å for Sm(1) and 2.28-2.48Å for Sm(2) with the longer oxygen; O(3) form Sm(1) at 2.708(10) and Sm(2)-O(5) at 2.755(6) Å. The Sm(3) atom is best described as a distorted octahedron since the “seventh” atom is over 3.11Å away, and the displacement towards the corresponding face is significantly less. The average of the six short Sm-O distances for each of the crystallographic unique Sm atoms falls in a narrow range (2.37-2.40Å). The Bondvalence sums for these are 2.86, 3.17 and 2.97, respectively with the contribution of the seventh atom decreasing from a maximum of 6.6% in Sm(2) to 2% in Sm(3)[11,12].
Figure 4:Representation of the structure of Sm2O3.

In these perovskite-like compounds there are four formula units in the unit cell or one in the asymmetric unit. The iron and gadolinium ions have been omitted to give an unobstructed view of the distorted octahedra. In a single ‘level’ of octahedra, the octahedra are tilted toward or away from each other in planes containing neighboring edges. Octahedra in neighboring levels have faces tilted toward or away from each other [13] (Figure 5).
Figure 5:Representation of the structure of SmFeO3

Infrared absorption spectroscopy analysis
In order to extend our knowledge of the physico-chemical properties of these materials, we report the infrared spectra of the Sm2O3., Fe2O3 and SmFeO3 compounds and assign the observed bands. The infrared spectra of the title compound, recorded at room temperature, are shown in Figure 6a-6c. The FTIR spectra of the compounds Sm2O3. and Fe2O3 each show an intrinsic stretching vibration band of Se-O at 438cm-1 and Fe-O at 532cm-1 respectively. On the other hand, the infrared spectrum of SmFeO3 compound exhibits two intrinsic stretching vibration bands of Se-O at 425cm-1 and of Fe-O at 528cm-1 [14-17].
Figure 6:Infrared spectrum of Fe2O3 (a), Sm2O3 (b) and FeSmO3 (c) compounds.

Optical properties
Figure 7a-c:Optical absorption and reflectance spectra of Fe2O3, Sm2O3 and FeSmO3 compounds measured at room temperature respectively

UV-visible study: Optical properties are one of the most important factors to evaluate the light efficiency. To determine the band gap energy of investigated compounds, absorbance spectra of prepared samples were performed in the wavelength range (200-800) nm at room temperature as shown in Figure 7a-7c. The obtained spectra exhibit the nethermost energy absorption peaks at 236nm, 235nm and 213nm, for Fe2O3, Sm2O3 and FeSmO3 compounds, respectively. These bands with maximum energies can be assigned to the absorption of the highest energetic level in the conduction band.
To determine the band gap energy, the reflectance spectrum was converted with the Kubelka- Munk equation given by the following form (equation 2) [18]:
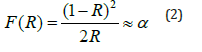
Where
F(R): the Kubelka-Munk function
R: the diffuse reflectance
The relation between band gap energy Eg and coefficient absorption a near the band edge was estimated based on the Tauc plot method, expressed as (equation 3) [19]:
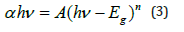
Where
α: the absorption coefficient
hν: the incident photon energy
A: constant characteristic of the material
Eg: the optical band
n: the empirical exponent, which characterizes the type of
optical transition during the absorption process.
Thus, the value of (n) is equals of 1/2 and 2, corresponding to the allowed direct and indirect transition [20]. The dependence of (αhν)2 versus the photon energy (hν) for each compound is shown in Figure 8a-8c. The energy band gaps Eg can be determined from the intercepts of these plots on the energy axis, since Eg=hν when (αhν)2=0.
Figure 8a-c:Plot of (ahυ)2 versus (hυ) of Fe2O3, Sm2O3 and FeSmO3 compounds

For these compounds, the average band gap energy is about 2.85eV for Fe2O3, 4.84eV for Sm2O3 and 4.27 for FeSmO3. These compounds can be classified as semiconductors with large gap.
Extinction coefficient: The extinction coefficient represents the amount of attenuation loss when the electromagnetic wave propagates through a medium. It is related to the absorption coefficient and the wavelength using equation 4 [21].

In fact, Figure 9a-9c shows the variation of the extinction index as a function of wavelength for the compounds studied. The extinction coefficient behavior of the Fe2O3 and FeSmO3 samples tends to increase with the wavelength increase while for Sm2O3 it decreases with increasing wavelength. Moreover, the fall and rise in the extinction coefficient are due to the variation of the absorbance. In fact, low values of k indicate the region of transparency of each compound [22]. However, the compound Sm2O3 transmit almost most of the incident radiation due to their total transparency in the visible area. In fact, when the crystals exhibit awide transmission range in the visible domain, it can be used for non-linear optical applications and anti-reflective layers of solar thermal devices [23].
Figure 9a-c:Dispersion curves of extinction coefficient k for the Fe2O3, Sm2O3 and FeSmO3 compounds as a function of wavelength.

Electric properties
Equivalent circuit: The impedance spectroscopy is one of the most adequate techniques to investigate the electrical conductivity and analyze the charge transport processes in the grain; grain boundary and electrode effect in materials for both wide frequency and temperature ranges [24].
In this work, the Nyquist plots (-Z” vs Z’) of Sm2O3, Fe2O3 and SmFeO3 compounds recorded at room temperature in well-defined range of frequency is illustrates in Figure 10a-10c. From the shape of these plots, this compounds formed by a single semi-circular arc associated the contribution of the grain. The depressed semicircles have their centers on a line below the real axis, which indicates departure from the ideal Debye behavior [25].
Figure 10a-c:Nyquist diagrams of Fe2O3, Sm2O3 and FeSmO3 compounds.

Based in the Z-View-software, these spectra were modeled by an equivalent circuit which is collected of a parallel combination of resistance Rg (bulk resistance) and a constant phase element (capacity of the fractal interface CPE).
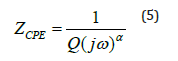
The impedance of the capacity of the fractal interface CPE is given by the following equation (5):
The fitted values obtained by the equivalent circuit are used to simulate the experimental curve of real and imaginary part of impedance spectroscopy based on the fallowing equations 6 & 7.
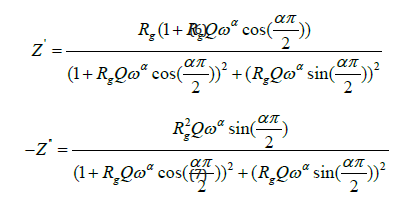
Where
ω: the angular frequency
Q: the capacitance value of the CPE element
α: the fractal exponent.
The great conformity of the calculated lines (simulated curve) with experimental data observed in Figure 11a-11c indicates that the chosen equivalent circuit is well described the behavior of these materials. The fitting parameters obtained by the equivalent circuit are listed in Table 2. It is remarkable that the mixed compound SmFeO3 is less resistive than the other two compounds.
Figure 11a-c:Real and imaginary parts of impedance as a function of frequency for the samples Fe2O3, Sm2O3 and FeSmO3.

Table 2:Fitting parameters obtained by the equivalent circuit.

Based on the parameters values extracted from the equivalent circuit using Z-view software, the direct conductivities for the different relaxations are determined at each temperature from equation 8:
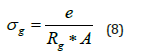
Where A: the electrolyte-electrode contact area e: the thickness of the pellet Rg: the bulk resistance value
The real part of impedance decreases with the rise of frequency. This plot shows that conduction increases with the rise of frequency. The imaginary impedance is characterized by the appearance of the maximum value Z”max at a certain frequency ωmax, to introduce the relaxation time τ from the condition (ωmaxτ=1).
From Table 2, we notice that the values of α are very close to 1 which indicates that CPE behaves like a capacitance or the interactions between the dipoles are small. In addition, the values of grain resistance (R) of sample Sm2O3 is greater than that of two other compounds.
AC conductivity study: AC conductivity measurements have been widely used to investigate the nature of defect centers in the disordered systems. Which are supposed to be responsible for this type of conduction. The high-frequency dependence of the AC conductivity is often observed experimentally in most polar semiconductor oxides, and then can be explained in terms of thermally activated hopping of charge carriers between localized sites over the potential barrier.
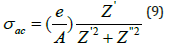
The value of ac conductivity (σac) of the material is evaluated by an empirical formula (equation 9):
As shown in these spectra (Figure 12a-12c), there are two dominant regions, the first at low frequency where AC conductivity is remains almost constant, the second at higher frequency; the area in which we are in front of a dispersion phenomenon characterized by ωs. This dispersion can be related to the behavior of the space charges that is anticipate, since that their effect disappears with increasing frequencies and temperature [26].
Figure 12a-c:Frequency dependence of AC conductivity for the samples Fe2O3, Sm2O3 and FeSmO3.

This is not always the case as shown by the proposed spectra where there are curves for which the rise is not reached showing the existence of space charges even at high frequencies. Those spectra were fitted (solid line) through the expression proposed by Jonsher (equation 10) [27].
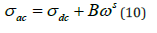
Where
σdc: the dc conductivity (a value of conductivity at low frequency)
Bωs: the ac conductivity which consists of all dispersion
phenomena
B: the temperature dependent variable
S: the exponent who describes the degree of interaction of
charge carriers with their environment, charges, and impurities.
The value of s varies from 0 to 1 and for ideal Debye-type behavior
s=1.
The fitting parameters for the three compounds are collated in Table 3.
Table 3:Fitting parameters obtained by the equivalent circuit.

Figure 12a-12c show that the conductivity is higher for the mixed compound SmFeO3 compared to the other two compounds. Indeed, the presence of two types of trivalent cations (Sm and Fe) in the SmFeO3 compound increases the disorder in this material and therefore the conductivity.
Dielectric study
Figure 13a-c:dielectric constant ε’ as a function of frequency for Fe2O3, Sm2O3 and FeSmO3 compounds..

The frequency dependence of real (ε′) parts of the dielectric constant of Fe2O3, Sm2O3 are shown in Figure 13a-13c. Based on these figures, it can be noted that the presence of a single low frequency relaxation which corresponds to the space charge for the two compounds Fe2O3 and SmFeO3. On the other hand, the Sm2O3 compound exhibits two peaks (Figure 13(b)), one at low frequency corresponds to the space charge relaxation and the other at high frequency caused by dipole relaxation. At low frequencies, ε′ shows a dispersive behavior. Besides, the increasing value of ε′ with increasing temperature may be attributed to the increase in space charge polarization process [28]. On the other hand, at high frequencies, it approaches a limiting constant value ε′∞ (ω), which can be interpreted as a result of a rapid polarization processes with no ionic motion contribution, because the frequency is too high and the ions can only oscillate without reaching the sample-electrode interface. We can see that dielectric constant ε› of Fe2O3, Sm2O3 and FeSmO3 have different values at a maximum of ε’, which is equal 170, 127, 348, respectively. It can be concluded that the mixed compound has a great permittivity compared to the two other compounds.
Figure 14a-14c exhibits the frequency dependence of the imaginary dielectric constant ε» at room temperature for the three compounds. The dielectric loss spectrum, denoting the imaginary part ε′′(ω) of the complex permittivity, reveals the occurring dipolar molecular dynamic processes, with distinct origin processes appearing at diverse characteristic frequency ranges. At low frequency, the dielectric loss is predominantly Joule losses accompanied with charge conduction. The loss spectrum displayed bump-like features, corresponding to distinct reorientational processes.
Figure 14a-c:Variation of dielectric constant ε′′ versus frequency for Fe2O3, Sm2O3 and FeSmO3 compounds..

Conclusion
In this work, the Fe2O3, Sm2O3 and FeSmO3 were successfully synthesized by sol-gel method based on the Pechini’s route. X-ray diffraction analysis recorded at room temperature for the three compounds revealed that: Fe2O3 crystallized in the hexagonal system with R-3C space group, the values of the lattice parameters were determined(a=5.034Å, b=5.034Å and c=13.742Å), the Sm2O3 crystallized in the monoclinic system withC21/m space group, the values of the lattice parameters were determined (a=14.180Å, b=3.627Å and c=8.855Å) and the FeSmO3 crystallized in the orthorhombic system with Pnm a space group, the values of the lattice parameters were determined (a=5.596Å, b=7.707Å and c=5.399Å). The vibrational study by FTIR spectroscopy confirms the presence of intrinsic stretching vibration Fe-O in the compound Fe2O3, Se-O in the compound Sm2O3 and Fe-O and Sm-O in the mixte compound. The variation of ac conductivity as a function of frequency is interpreted using the universal Jonscher’s law. Optical properties of the title compounds are investigated using a UV-Vis spectroscopy to determine some of important parameters such as the band gap energy. Tauc’s model was used to determine the energy of optical gap of the prepared compounds. The analysis of the absorbance data revealed the existence of a direct transition for the three samples. The band gap values were Eg=2.85eV, Eg=4.84eV and Eg=4.27eV for Fe2O3, Sm2O3 and FeSmO3 respectively. The compound Sm2O3 transmit almost most of the incident radiation due to their total transparency in the visible area, so it can be used for non-linear optical applications and anti-reflective layers of solar thermal devices.
Furthermore, analysis of the real and imaginary parts leads us the presence of only semi- cercle associated to grain. The presence of two types of trivalent cations (Sm and Fe) in the SmFeO3 compound increases the disorder in this material and therefore the conductivity. The dielectric constant ε’ of Fe2O3, Sm2O3 and FeSmO3 have different values at a maximum of έ, which is equal 170, 127, 348, respectively. It can be concluded that the mixed compound has a great permittivity compared to the two other compounds. These studies show that the substitution between Fe and Sm gives a material (FeSmO3) characterized by more important dielectric and optical properties.
Acknowledgement
We are highly obliged that our university: University of Sfax provided all the facilities and infrastructure. This support and the infrastructure help us to complete the research article.
References
- Xia Y, Yang P, Sun Y, Wu Y, Mayers B, et al. (2003) One-dimensional nanostructures: synthesis, characterization, and applications. Avanced Physics Research 15(5): 353-389.
- Cornell RM, Schwertmann U (2003) The iron oxides, (2nd edn), Wiley-VCH GmbH & Co. KGaA, Weinheim (Eds.), The iron oxides: structure, properties, reactions, occurrences, and uses.
- Danno T, Nakatsuka D, Kusano Y, Asaoka H, Nakanishi H, et al. (2003) Crystal structure of β-Fe2O3 and topo tactic phase transformation to α-Fe2O3. Crystal Growth Design 13(2): 770-774.
- Kadowakim Y, Aika K (1996) Promoter effect of Sm2O3 on Ru/Al2O3 in ammonia synthesis. J Catal 161(1): 178-185.
- Livage J, Henry M, Sanchez C (1988) Prog, Sol-gel chemistry of transition metal oxides. Solid State Chem 18: 259.
- Pal B, Sharon M (2000) Preparation of iron oxide thin film by metal organic deposition from Fe (III)-acetylacetonate: a study of photocatalytic properties. Thin Solid Films 379(1-2): 83-88.
- Grandhe BK, Ramaprabhu S, Buddhudu S, Sivaiah K, Bandi VR (2012) Synthesis and characterization of novel K2La2− xEuxTi3O10 phosphor for blue chip white LEDs. Optics Communications 285: 1194.
- Blake RL, Hessevic RE, Zoltai T, Finger LW (1966) Refinement of the hematite structure. Am Mineral 51: 123-129.
- Finger LW, Hasen RM (1980) Crystal structure and isothermal compression of Fe2O3, Cr2O3, and V2O3 to 50 kbars. J Appl Phys 51(10): 5362.
- Sadykov VA, Isupova LA, Tsybulya SV, Cherepanova SV, Litvak GS, et al. (1996) Effect of mechanical activation on the real structure and reactivity of iron (III) oxide with corundum-type structure. J of Solid-State Chemistry 123(2): 191-202.
- Kennedy BJ, Avdeev M (2011) Solid State Sciences 13: 1701.
- Ghosh P, Kundu S, Arik K, Ramanujachary KV, Samuel L, et al. (2010) Synthesis and characterization of different shaped Sm2O3 J Phys D: Appl Phys 43: 405401.
- Geller S, Wood EA (1956) The crystal structure and ferrimagnetism of yttrium-iron garnet, Y3Fe2 (FeO4). Acta Cryst 3(9): 563.
- Jun-Gill K, Bong-Ki M, Youngku S (2015) Synthesis and characterization of Sm(OH)3 and Sm2O3 nanoroll sticks. J Mater Sci 50: 1958-1964.
- Pal B, Sharon M (2000) Preparation of iron oxide thin film by metal organic deposition from Fe (III)-acetylacetonate: a study of photocatalytic properties. Thin Solid Films 379(1-2): 83-88.
- Xu YY, Zhao D, Zhang XJ, Jin WT, Kashkarov P, et al. (2009) Synthesis and characterization of single-crystalline α-Fe2O3 nano leaves. Physica E 41(5): 806-811.
- Darezereshki E (2011) Mater Lett 65: 642.
- Hill R, Jonscher AK (1979) DC and AC conductivity in hopping electronic systems. Journal of Non-Crystalline Solids 32(1-3): 53-69.
- Miladi L, Oueslati A, Guidara K (2016) Phase transition, conduction mechanism and modulus study of KMgPO4 RSC Advances 6: 83280-83287.
- Nadine T, Nathalie B, Olivier J, Piekara-Sady L, Auban-Senzier P, et al. (2009) A single-component molecular metal based on a thiazole dithiolate gold complex. J Am Chem Soc 131(46): 16961-16967.
- Namikawa H (1975) Dielectric properties of transition metal oxide glasses. J Non-Cryst Solids 18: 173.
- Hema M, Selvasekerpandian S, Sakunthala A, Arunkuma D, Nithya H (2008) Structural, vibrational and electrical characterization of PVA-NH4Br polymer electrolyte system. Physica B 403(17): 2740-2747.
- Yakuphanoglu F, Arslan M, Kucukislamoglu M, Zengin M (2005) Charge transfer complex studies between some non-steroidal anti-inflammatory drugs and π-electron acceptors. Sol Energy 79: 96.
- Biswas P, Kumar V, Agarwal G, Ntwaeaborwa OM, Swart HC (2016) NaSrVO4: Sm3+−An n-UV convertible phosphor to fill the quantum efficiency gap for LED applications. Ceram Int 42(2): 2317-2323.
- Ajmi A, Karoui K, Abdallah ben Rhaiem (2019) Optical and dielectric properties of NaCoPO4 in the three phases α, β and γ. 9: 14772-14781.
- Abdullah AQ (2013) Optical and structural investigation of synthesized PVA/PbS nanocomposites. Chem and Mater Res 3: 10.
- Mahfoudh N, Karoui K, Ben Rhaiem A (2021) Optical studies and dielectric response of [DMA]2MCl4 (M= Zn and Co) and [DMA]2 ZnBr4. RSC Advances 11: 24526-24535.
- Kchaou H, Karoui K, Khirouni K, Ben Rhaiem A (2017) Optical and dielectric relaxation of transition metal-based organic-inorganic hybrid materials. Journal of Alloys and Compounds 728: 936-943.
© 2023 Abdallah Ben Rhaiem. This is an open access article distributed under the terms of the Creative Commons Attribution License , which permits unrestricted use, distribution, and build upon your work non-commercially.
Editor In Chief


.jpg)


Signup for Newsletter

Quick Links
 Editorial Board Registrations
 Submit your Article
 Refer a Friend
 Advertise With Us
Our Recent Edition

.jpg)


Top Editors


.jpg)


.bmp)
.jpg)
.png)
.jpg)


.jpg)


.png)

.png)


.png)


Financial Support

Sponsors

Latest e-Books

Latest Video

 a Creative Commons Attribution 4.0 International License. Based on a work at www.crimsonpublishers.com.
Best viewed in
a Creative Commons Attribution 4.0 International License. Based on a work at www.crimsonpublishers.com.
Best viewed in