
- About Us
- Information
-

The Author ensures that the research has been conducted responsibly and ethically with adherence to all relevant regulations. read more..
- For Authors
- For Reviewer
- Manuscript Guidelines
- Membership
- Publication Ethics
-
- Journals
- Reprints
- e-Books
- Videos
- Policies
- Contact Us
 COVID-19
- Submissions


Full Text
Research & Development in Material Science
Influence on the Microstructure and the Microhardness Resulting from the Addition Of 5% Cu in the Al-10% Sn Solid Transient Alloy under Pressure
Diego Ferreira, Franklin Lacerda, Rivaldo Lins and Claudio Siqueira*
Department of mechanical engineering, Federal University of Paraiba, Brazil
*Corresponding author: Claudio Siqueira, Department of mechanical engineering, Federal University of Paraiba - UFPB, 58051-085, João Pessoa, PB, Brazil
Submission: December 21, 2022;Published: January 10, 2023

ISSN: 2576-8840 Volume 18 Issue 3
Abstract
Al-Sn alloys are widely used in automotive parts, such as bearings and internal parts of combustion engines. Therefore, the addition of third elements to Al-Sn alloys is an alternative for possible improvements in their properties, so Copper is pointed out as an element that can contribute so much to the mechanical properties of the alloy. In this work, we sought to evaluate the effects of the thermal parameters of solidification and the addition of Cu on the microstructural morphology and microhardness of Al-10% Sn alloys. To carry out the present study, solidification experiments were carried out under pressure (100MPa) in a transient heat extraction regime. The addition of copper caused an alteration in the thermal parameters and consequently a microstructural change; The microstructural spacings of the studied alloys increased as the solidification front advanced towards the center of the ingot along with the decrease in the values of the thermal parameters (V L, T R). The microhardness of the Al-10Sn alloy remained constant (28.5HV), with the addition of 5%Cu there was an increase in the microhardness values.
Keywords: Microhardness; Thermal parameters; Al-Sn-Cu alloys; parameters of solidification
Introduction
Due to the combination of mechanical strength, good adaptability and important surface characteristics, Al-Sn alloys have been used in the manufacture of bearings for a long time. Sn has excellent tribological properties, which can reduce wear and ensure excellent final properties to finished products [1]. Knowing the great potential for alloys of the Al-Sn system, the addition of alloying elements in the Al-Sn system, Copper, Silicon, Nickel, among others, are seen as reinforcements in the mechanical and tropological properties. Therefore, the combination of third elements in alloys of the Al-Sn system provides.
Currently, the literature shows that Al-Sn-Cu alloys have great potential for tribological applications due to the strengthening of the aluminum rich matrix. In view of the addition of Cu that have good mechanical strength and ductility, they are seen as a third interesting element to be added to the Al-Sn system to increase the tensile strength and fatigue resistance of the material and reduce the probability of failure.
Therefore, the objective of this study is to evaluate and promote the understanding of the effects of transient thermal extraction under solidification under pressure and the addition of Cu to Al-10% Sn alloy on the morphology and microhardness of the microstructure, aiming to evaluate the effects of the thermal parameters of solidification. and the addition of Cu on the microstructural morphology and microhardness of an Al-10% Sn alloy solidified under pressure.
Experimental Procedure
The Al-10% Sn and Al-10% Sn-5%Cu alloys were prepared in a muffle furnace, the castings were carried out in a cylindrical mold with an external diameter of 70mm and an internal diameter of 38mm and with a height of 110mm. The mold was preheated to 220 °C, for the castings a pressure of 100Mpa was used for 10s. The thermal mapping during the solidification of the alloy was done through thermocouples positioned at 3 different points on the lower base positioned at distances from the inner wall of the mold towards the center (2mm; 8mm; 14mm) and in different directions. The thermocouples used were of the “K” type with 1.6mm in diameter and positioned at different heights (30mm; 40mm; 50mm). These thermocouples were connected to a data logger, which was connected to a computer, in which the thermal profiles were obtained in real time. In Figure 1, there is a schematic representation of solidification under pressure and the equipment.
Figure 1:Schematic representation of the experimental solidification of compression casting (1) hydraulic press; (2) Pulse; (3) cylindrical mold; (4) thermocouples; (5) Temperature recorder; (6) computer and data acquisition software; (7) manometer; (8) hydraulic pressure control.

With the data obtained from the cooling curve, it is possible to plot experimental graphs of the position as a function of time, P=f(t), which are obtained based on the intersection of the Liquidus temperature (TL) with the curve of cooling of each thermocouple, which has predefined positions from the Metal/Mold interface. The Liquidus velocity is given through the derivative of the function P=f(t). Cooling rates were obtained experimentally by directly reading the quotient of temperatures immediately before and after reaching TL with their respective times.
The resulting ingot (100mm in length) was sectioned in the form of discs with thicknesses of 10mm each, totaling 10 discs per ingot, however, for the structural characterizations, the first two and the last two discs were discarded, aiming at the measurement and characterization. interdendritic spacings along the ingot from the mold metal (radial) interface. In Figure 2, there is a schematic representation of the methodology adopted to remove samples for microstructure analysis.
Figure 2:Sectioned ingot.

All parts were polished with diamond paste and etched with a 1% (v/v) HF solution for 20 seconds for Al-10% Sn-5%Cu alloy and for Al-10%Sn alloy a solution of 0.5% (v/v) NaOH for 50 seconds. For microstructural analysis, measurements were performed from the metal/mold interface every 1mm to the central region of the discs. To measure the microhardness, indentations were performed in the same positions in the microstructural analysis, always from the Metal/Mold interface to the center of the part with an interval of 1mm between the indentations. In this test, a load of 0.200kgf was used for the Al-10%Sn alloy and 1.0kgf for the Al-10%Sn-5%Cu alloy, all with a duration time equivalent to 10 seconds.
Results and Discussions
In Figure 3, there is a shorter passage time of the Liquidus isotherm and, as a consequence, a higher cooling speed when compared to Al-10%Sn-5%Cu alloys, the addition of copper delays the solidification front due to the rejection of solute, thus causing a delay in solidification.
Figure 3:Al-10% Sn (a), Al-10% Sn-5%Cu (b) Al-10% Sn-alloy cooling curves.

Figure 4:(a) evolution of the solidification front represented by the advance of the liquidus isotherm; (b) Velocity of the liquidus isotherm (VL); (c) cooling rate as a function of position for the ternary alloy Al-10% Sn and Al-10% Sn- 5%Cu.

Figure 4(a) of the Al-10% Sn, Al-10% Sn-5%Cu alloys respectively, presents the experimental result of the passage of the Liquidus isotherm for each composition. The analyzed alloys presented different profiles, it is observed that with the addition of 5%Cu, the liquidus isotherm passage time increased when compared to the corresponding binary alloy, a fact that, according to the literature, occurs a rejection of the solute, thus hindering the advance of the Liquidus isotherm [2]. There is an increase in the passage time due to the presence of the Cu due to the total rejection of the solute, with the addition of Cu, the solute formed intermetallics, Al2Cu, this fact made the solidification front slower.
Figures 4(b) of the Al-10% Sn, Al-10% Sn-5%Cu alloys show the VLcurves, with the addition of the third element, a decrease in the velocity of the passage of the Liquidus isotherm was observed , where what has already been seen with the passage time of the Liquidus isotherm, the longer the time for the solidification front to pass along the liquidus isotherm, the lower its speed, with the rejection of the solute in the alloys, the solidification front suffered a delay , thus taking more time to advance to the center of the ingot, consequently, a lower speed when compared to Al-10% Sn alloy. The cooling rates for each analyzed composition can be seen in Figures 4(c) for the Al-10% Sn, Al-10% Sn-5%Cu alloys, respectively. The cooling rate presents much higher values in the initial moments and an exponentially lower value along the solidification towards the center of the ingot due to the growth in the amount of solid material formed, thus creating a thermal resistance and making the extraction of heat difficult, he noted. it was also observed that with the addition of the solute there was a decrease in the rates when compared to the Al-10% Sn alloy.
Figure 5:(a), (b) and (c) Solidification microstructures of the Al-10%Sn alloy at different positions from the metal/mold interface towards the center of the ingot.

Figures 5 & 6 show the morphologies of the microstructures of the Al-10% Sn, Al-10% Sn-5%Cu alloys. It was observed for the Al-10% Sn alloy a cellular morphology resulting from the instability of the solidification front caused by high values of cooling rates and velocities, which facilitate the formation of constitutional supercooling [3]. For the Al-10% Sn-5%Cu alloy, it mostly obtained a dendritic morphology resulting from several factors, including the low values of cooling rates and velocity and the addition of solute, which increased the instability of the front of solidification and with that the cellular interface (Al-10% Sn) becomes dendritic with the addition of 5%Cu, therefore, with the addition of alloying elements, there is a greater rejection of solute, which accommodates in the spaces between vacancies in the matrix rich in Al thus creating a barrier and hindering microstructural growth.
Figure 6:(a), (b) and (c) - Solidification microstructures of Al-10% Sn-5%Cu alloy in different positions from the metal/mold interface towards the center of the ingot.

Figures 5(a), (b) & (c) shows the solidification microstructure of the Al-10% Sn alloy in radial positions of the metal/mold interface towards the center of the ingot, an increase and a change in its morphology can be observed. with the advance of the solidification front towards the center of the ingot despite having the same cellular structure, in regions close to the metal/mold interface more elongated structures are observed and in regions closer to the center of the ingot more circular cells due to the difference of the values of the cooling rates, where a difference of the order of 102 was obtained when comparing values close to the metal/mold interface and the center of the ingot. Figures 6(a), (b) & (c) shows the solidification microstructure of Al-10% Sn-5%Cu alloys respectively in radial positions of the metal/mold interface towards the center of the ingot, it was observed that they presented structures dendritic.
Figures 7 show the growth of microstructural spacings of Al-10% Sn, Al-10% Sn-5%Cu alloys. All compositions showed a tendency to increase spacing with distance from the metal/mold interface, however, in the binary alloy, Al-10% Sn, there was a decrease up to a distance of 6mm from the contact interface, which is explained by high cooling rates at the beginning of solidification, which from the 8mm position of the metal/mold interface there was a decrease of about 50% in the cooling rates when compared to initial values, which caused a tendency of growth of cell spacings, this Reversal in cell growth was noted in radial solidification studies carried out [4], who also noticed a reversal at points where cooling rates were very high, so the way in which heat transfer occurs in solidification has direct influence on the microstructure of the alloys.
In Figure 7, it is noted that the alloy with the addition of 5%Cu showed lower values of dendritic spacing, the formation of intermetallics, Al2Cu, present in the interdendritic spaces and in a diluted manner in the Al matrix.
Figure 7:Evolution of dendritic spacing (λ2) for Al-10% Sn-5%Cu alloy and cell spacing (λc) for Al-10% Sn alloy as a function of the Metal/Mold interface.

Figures 8 (a) & (b) shows the morphologies of the microstructures through the Scanning Electron Microscope (SEM) of the Al-10% Sn, Al-10% Sn-5% Cu alloys, respectively, in all alloys. it was found that the grains grew in a matrix rich in α-Al, darker region, and pockets of Sn particles, whitish region.
Figure 8:SEM image of Al-10% Sn (a), Al-10%Sn- 5%Cu (b) alloy.

In the Al-10% Sn alloy, Figure 8 (a), the tin pockets are found in the contours of the grains distributed in the whole piece in a very uniform way; For the alloy with 5%Cu, Figure 8(b), the formation of a second phase, Al2Cu, was observed , which similarly to [5], corresponds to the gray phases, which were located between the pockets of Sn and the α-Al matrix. With the addition of the solute in the alloys, 5%Cu, it was observed that the Sn pockets were agglomerated in the interdendritic boundaries, due to the rejection of the intermetallic Al2Cu distributed in the grain boundaries, a region which was previously occupied by the Sn pockets, doing so. that the Sn pockets were agglomerated. According to the literature, alloys with concentrations between 4% and 6% of copper act as an alloy hardener [6].
Figure 9 presents results obtained in Vickers microhardness tests for Al-10% Sn, Al-10% Sn-5%Cu alloys; It was noted that it obtained values with constant trends on average of 28.5HV, due to a uniform distribution of tin throughout the solidification front and high Sn ductility. It was observed that the addition of 5%Cu, the microhardness values and the microhardness values practically doubled in relation to the Al-10% Sn alloy, Cu acts as an alloy hardener, according to the literature, the hardness of pure aluminum can vary from 5-45HV while Hard aluminum hardness can reach up to 140HV [7]. Therefore, it is observed that the microhardness is directly linked between the alloying elements and solidification microstructure.
Figure 9:Vickers microhardness as a function of the Metal/Mold Interface of Al-10% Sn alloys; Al-10% Sn- 5%Cu.

From the experimental results of the spacings (C, 2), it is observed that the spacings increase as the solidification front advances towards the center of the ingot, that is, towards positions further away from the heat extraction surface. (metal/ mold interface). Figure 10 presents a comparison of the Liquidus isotherm velocities as a function of the microstructural spacings of the three studied alloys Al-10% Sn, Al-10% Sn-5%Cu. Note that the higher the solidification velocity values, the smaller the microstructural spacings, that is, the faster the solidification, the less time it will take to form the microstructure, which will cause a smaller microstructural spacing; It is also observed that the alloys with the addition of 5%Cu obtained lower values of velocities and, as a consequence, lower values of microstructural spacing. For the alloys, microstructural growth functions were obtained as a function of velocity of the type (C,2) = AVLB , where A and B are constants; For the Al-10%Sn alloy, C = 28.0VL-0.10 was obtained, while for the alloy with the addition of 5%Cu 2 =19.0VL-0.25.
Figure 10:Correlation of the microstructural spacing of Al-10% Sn, Al-10% Sn-5%Cu alloys as a function of the liquidus isotherm velocity.

Figure 11:(a), (b) Correlation of cell spacing, ʎC, as a function of the Al-10% Sn alloy cooling rate, (c) Correlation of microstructural spacing of Al-10% Sn, Al-10% Sn-5%Cu alloys as a function of cooling rate.

Table 1:Comparison between the microstructural growth equations as a function of the experimental cooling rate and proposed in the literature.

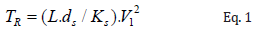
Figures 11(a), (b) & (c) shows the cooling rate (TR) as a function of the microstructure of the Al-10% Sn, Al-10% Sn-5%Cu alloys; Note that the curves tend to decrease, ie, smaller values of spacing with higher values of cooling rates, the cooling rate has a direct influence on the morphology and formation of microstructures. According to [8], the values of the exponents of the functions plotted together with the experimental data must follow the equation below. Different exponents from what is proposed in the literature were used, however very close, as can be seen in Table 1.
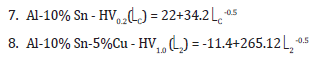
Figures 12 shows the results obtained for the correlation between the microstructure values and the Vickers microhardness for the Al-10% Sn, Al-10% Sn-5%Cu alloys. We can correlate microhardness with cell spacings through the Hall–Petch equation, where with smaller spacings we have greater hardness. It is observed that experimental laws of power and Hall-Petch types allow to verify higher values of microhardness for smaller secondary dendritic spacings [9].
Figure 12:Vickers microhardness as a function of the inverse of secondary dendritic spacing of Al-10% Sn- 5%Cu alloy and Cell spacing of Al-10% Sn alloy.

It is observed that with the increase of the microstructure favors the decrease of the microhardness due to the increase of the α-Al region, it is also noted that the binary alloy obtained a lower relationship between the microstructure as a function of the microhardness when compared with the ternary alloys, which was already expected, since with the addition of Cu in the alloy, an increase in microhardness had already been observed due to the appearance of the intermetallic Al2Cu present in the interdendritic space due to the rejection of the solute during the solidification process [10,11]. The following microhardness functions were obtained as a function of microstructural growth, Al-10% Sn HV0.2(C) = 22+34.2 C-0.5 and Al-10% Sn-5%Cu HV1.0 (2) = -11.4 + 265.122-0.5.
Conclusion
From the results obtained, it can be concluded that:
1. With the addition of Cu in the alloy there was a change in cell
morphology to dendritic; generally speaking, the microstructural
spacing, (C,2), increases as we move away from the metal/mold
interface towards the center of the ingot.
2. The microhardness values practically doubled with the addition
of 5%Cu in relation to the values of the Al-10% Sn alloy.
3. Addition of 5% Cu in the Al-S10%n alloy caused the cooling rates
and velocity of the liquidus isotherm to decrease because of the
constitutional supercooling, thus proving that the addition of Cu
caused the values of the thermal parameters to decrease.
4. The experimental equations obtained for λ2 in the ternary
alloys as a function of P, VL and TR allow us to conclude that
the microstructural spacings increase with the advance of
solidification towards the center of the ingot, that is, for positions
of the liquidus isotherm further away from the interface metal/
mold, where the values of VL and TR are smaller.
5. Equations of the type (C,2) = AXB were obtained for the growth
microstructural as a function of the Liquidus isotherm velocity
and for the cooling rate.
6. The functions of the microhardness correlations with the
microstructural spacings, (C,2), were obtained through the Hall–
Petch equation.
Conflicts of Interest
The authors declare that they have no conflicts of interest
Acknowledgement
The authors acknowledge the Graduate Program in Mechanical Engineering of the Federal University of Paraíba - PPGEM, CAPES (Coordination of Superior Level Staff Improvement) and CNPQ - National Council for Scientific and Technological Development.
References
- Kotadia HR, Doernberg E, Patel JB, Fan Z, Schmid-Fetzer R (2009) Solidification of Al-Sn-Cu based immiscible alloys under intense shearing. Metallurgical and Materials Transactions A 40: 2202-2211.
- Garcia A (2001) Solidifications: Fundamentals and applications. Publisher of Unicamp, Campinas, SP, Brazil.
- Thiago AC, Emmanuelle SF, Marcelino D, Crystopher B, Noé C, et al. (2015) Monotectic Al-Bi-Sn alloys directionally solidified: Effects of Bi content, growth rate and cooling rate on the microstructural evolution and hardness. Journal of Alloys and Compounds 653: 243-254.
- Felipe B, Crystopher B, Ivaldo LF, Guillaume R, Henri NT, et al. (2015) Cooling thermal parameters, microstructure, segregation, and hardness in directionally solidified Al-Sn-(Si;Cu) alloys. Materials and Design 72(5): 31-42.
- Campos AA (2017) Thermal solidification parameters, microstructure and tensile properties of Al-Sn-Cu ternary alloy. Dissertation (Master's) - Mechanical Engineering Course, State University of Campinas, Campinas, Brazil.
- Silva BL, Rodrigo VR, Amauri G, José ES (2017) Dendritic growth, eutectic features and their effects on hardness of a ternary Sn-Zn-Cu solder alloy. Acta Metallurgical Sinical (English Letters) 30(6): 528-540.
- Coutinho TA (1980) Metallography of non-ferrous metals. Edgard Blucher Ltd, São Paulo, Brazil.
- Garcia A (2007) Solidification: Fundamentals and applications. (2nd edn), Unicamp Publisher, Campinas, Brazil, p.
- Araújo ECC (2015) Horizontal directional solidification of an Al-Cu-Si alloy: Interrelation between thermal parameters, microstructure and microhardness. Dissertation (Master) - Industrial Engineering Course, Technology Center, Federal University of Pará, Belém, Brazil.
- Santos RG (1985) Solidification under radial heat flow conditions. Free Teaching Thesis, Unicamp, Campinas, Brazil.
- Siqueira CA (2002) Influences of solidification thermal parameters on columnar/equiaxial transition. Thesis (Doctorate) - Mechanical Engineering Course, State University of Campinas, Campinas, Brazil.
© 2023 Claudio Siqueira. This is an open access article distributed under the terms of the Creative Commons Attribution License , which permits unrestricted use, distribution, and build upon your work non-commercially.
Editor In Chief


.jpg)


Signup for Newsletter

Quick Links
 Editorial Board Registrations
 Submit your Article
 Refer a Friend
 Advertise With Us
Our Recent Edition

.jpg)


Top Editors


.jpg)


.bmp)
.jpg)
.png)
.jpg)


.jpg)


.png)

.png)


.png)


Financial Support

Sponsors

Latest e-Books

Latest Video

 a Creative Commons Attribution 4.0 International License. Based on a work at www.crimsonpublishers.com.
Best viewed in
a Creative Commons Attribution 4.0 International License. Based on a work at www.crimsonpublishers.com.
Best viewed in