
- About Us
- Information
-

The Author ensures that the research has been conducted responsibly and ethically with adherence to all relevant regulations. read more..
- For Authors
- For Reviewer
- Manuscript Guidelines
- Membership
- Publication Ethics
-
- Journals
- Reprints
- e-Books
- Videos
- Policies
- Contact Us
 COVID-19
- Submissions


Full Text
Research & Development in Material Science
Mechanical Characterization of a Twill Weave Carbon Fabric for Macro-scale Forming Simulation
Halil Yildirim1 and Fahrettin Ozturk1,2*
1Department of Mechanical Engineering, Ankara Yildirim Beyazit University, Turkey
2Turkish Aerospace Industries Inc., Ankara, Turkey
*Corresponding author:Fahrettin Ozturk, Department of Mechanical Engineering, Ankara Yildirim Beyazit University, Turkey
Submission: October 21, 2022;Published: November 04, 2022

ISSN: 2576-8840 Volume 18 Issue 1
Abstract
In recent years, woven fabric reinforced composites have been widely used in the aircraft and automotive industry due to their high specific strength and stiffness, superior damage tolerance, and high drapability. In the production of 3D shaped complex parts from woven fabric reinforced composites, the draping behavior of the fabric is of great importance. Finite element analysis is one of the most effective methods to predict the draping behavior of fabric reinforcement before the production. Achieving successful results in the finite element analysis of the draping process requires a comprehensive material characterization of the woven fabric reinforcement. Three major deformation mechanisms: tensile, in-plane shear, and bending are very effective on the macro-scale draping behavior of woven fabrics. Therefore, the parameters of macroscopic material models developed for most fabric draping simulations are usually obtained by tensile, shear and bending characterization tests. In this study, tensile and shear characterization tests of a twill-woven carbon fabric was carried out. In addition, each experimental test was validated with finite element simulations. Results reveal that the picture-frame test result was close to the numerical results; the exact match of the results was not achieved. The bias extension test results were in good agreement up to the shear angle value at which the fiber slippage occurs.
Keywords:Polyphenylene sulfide; Thermoplastic composite; Woven carbon fiber fabric; Thermoforming; Simulation; Defects
Introduction
Resin transfer molding (RTM) and thermostamping (TS)/thermoforming (TF), which are based on the forming process, are widely used in the production of woven fabric reinforced composite parts. Although, models at different scales such as micro, meso, and macro are used for numerical simulations of such processes, the macro scale modeling approach is very popular due to its computational efficiency. It is extremely important to measure the properties of the material reliably to obtain a good estimate from numerical simulations of such processes. The deformation of woven fabric reinforcements at macro scale includes three major deformation mechanisms: uniaxial tension, in-plane shear, and out-of-plane bending. The overall deformation of the woven fabric during the forming process is a combination of all those deformation modes. Depending on the process or the type of fabric, one deformation mode can be more pronounced than the others. Most deformation modes have a nonlinear behavior since they are interconnected to the change of the inner structure. These mechanisms need to be characterized in detail to obtain a reasonable estimate using finite element analysis. For this purpose, researchers [1] use two methods, experimental or numerical. The difficulty of the most test methods for woven fabric reinforcements is that, there are no standards available due to engineering fabrics are a relatively new topic and still at early stages of development. There are standards for the textile industry, but they are generally not suitable for technical fabrics with high deformability. It is inevitable for researchers to develop their own “test” equipment and procedures. However, efforts are currently being made to improve this inconsistency by collaborating with institutions with experience in engineering fabrics [2].
Many methods have been developed by researchers to characterize the mechanical behavior of fabrics. However, some methods have attracted more attention due to some advantages. For example, bias extension and picture frame tests are the two most popular methods used for in-plane shear characterization of woven fabrics. There have been many studies on in-plane shear characterization tests in the literature. Lebrun et al. [3] characterized in-plane shear behavior of a polypropylene/glass fabric using the bias-extension and the picture-frame testing methods. Taha et al. [4] investigated Egyptian plain-woven jute fiber fabrics of various areal densities - using both test methods. Büyükbayraktar [5] investigated shear properties of fabrics with different weave types using the bias extension test method.
In this study, the uniaxial tensile test, bias extension test, and picture frame test were applied to determine a (1/3) twill carbon fabric’s tensile and in-plane shear behavior. The raw data obtained were converted into stress strain curves using the normalization methods in the literature. Furthermore, finite element analyzes are performed to validate the experimental results. For the uniaxial test, the experimental and the numerical results were matched almost exactly. Although an exact match could not be obtained for the in-plane shear results, the experimental and numerical results were close to each other.
Characterization Tests
Properties of the fabric that were used in this study are given in Table 1.
Table 1: Properties of woven fabric.

Uniaxial tensile test
The uniaxial tensile properties of the carbon fabric in warp and weft directions were determined by the tensile strip test. The samples were prepared in both 0º and 90º orientations with a size of 75mm × 140mm. To achieve the form of a strip having 25mm width, extra yarns in the test direction were removed from the two opposite sides (Figure 1). The size of the clamps and the test length were set to 25mm × 50mm and 75mm, respectively. The sample was placed between the clamps with a pre-tension of 10 N. The tests were carried out using a load cell of 5kN at a speed of 1mm/min.
Figure 1:Uniaxial tensile test; (a) dimensions and sample orientation, and (b) sample during the test.

The Finite Element (FE) model and the applied boundary conditions are displayed in Figure 2. The clamps used in the experiment were not considered in the FE model. The fabric was modeled with fully integrated shell elements with a size of 5mm × 5mm. Fibers were defined on the material card at 0º / 90º degrees to the loading direction. All nodes on the bottom edge were constrained in all directions. All nodes on the top edge were only allowed to move in the y-direction.
Figure 2:The FE model and boundary conditions for uniaxial tensile test.

Bias extension test
The shear behavior of the carbon fabric was measured by a bias extension test in accordance with the parameters suggested by Pierce [6]; (Figure 3). Five samples were prepared in one diagonal direction (45º orientation). The samples were cut into a rectangular shape with a length of 200mm and a width of 50mm. The samples with a test length of 100mm were placed between clamps without any pre-tension. Bias extension tests were carried out at a 20mm/ min speed on a device with a 0.5kN load cell.
Figure 3:Bias extension test.

The FE model of the bias extension test was developed as shown in Figure 4. Since the clamps used in the experiment were not considered in the FE model, the FE model of the bias extension test consists of only rectangular fabric. The fabric was modeled with fully integrated shell elements with a size of 2.5mm × 2.5mm. Fibers were defined on the material card at 45º / -45º to the loading direction. All nodes on the bottom edge were constrained in all directions. All nodes on the top edge were only allowed to move in the y-direction. The average force-elongation curve obtained by testing five samples was converted into a normalized stress-shear angle curve and used as an input on the material card.
Figure 4:The FE model and boundary conditions for the bias extension test.

Picture frame test
In this study, shear frame measurements were conducted using the apparatus designed by Uren [7]. The frame and pure shear zone dimensions were 130mm × 130mm and 80mm × 80mm, respectively (Figure 5). The tension, which occurs on yarns during the shear deformation, is an important factor that can affect the test results [8], Thus to minimize the effect of yarn tension, the samples were fixed to the frame with no pre-tension and an extra 1 mm margin from each side, followed by removing the yarns in the edge (arm) parts of the sample to eliminate the potential force contribution from shearing of the yarns. Subsequently, the frame was placed on the tensile tester, and shear frame tests were performed with a load cell of 0.5kN and a test speed of 20mm/min. Five trials were realized in one diagonal direction (45º).
Figure 5:Shear frame test; (a) dimensions and sample orientation, (b) sample fixed to the frame, and (c) shear frame placed on the tensile tester.

The FE model of the picture frame test was constructed as shown in Figure 6. The red area in the middle represents the 80mm × 80mm woven fabric. Shell elements of 0.45mm thickness were used in the red zone defined by two fiber families. The green and blue regions in the model were composed of unidirectional yarns since free yarns in the sample arms were removed in the picture frame experiment. Red and green areas defined by a single fiber family consist of shell elements of 0.225mm thickness, which is half the thickness of the fabric. The gray, yellow, brown, and purple areas on the outermost parts represent the plates where, the fabric is clamped through pins. This region representing the frame positioned around the fabric consists of rigid shell elements. The stiff bar elements were used for the connections of rigid plates. Displacement and rotation of the lower connection point were constrained in all directions. The right and left hinges can move in x and y directions and rotate only in the z-directions. The upper hinge to which the movement was given can only move in the y-direction and can only rotate in the z-direction.
Figure 6:Finite element model of picture frame test.

Results and Discussion
Uniaxial tensile test results
Eight samples were tested, four in the weft direction and four in the warp direction. When Figure 7 & 8 were examined, it was seen that there were no significant differences between the samples in the region up to the apex. However, there was some difference between the maximum force values reached in the load-extension curves of different samples. These deviations were mostly pronounced for samples tested in the weft direction. In addition, after reaching the maximum load, a slight decrease in load was observed in all tests. This decrease was attributed to the initiation of fiber breakage after a certain load in the literature [6]. In the tests applied in this study, it was seen that the fabric started to slide between the jaws when the maximum load was reached. Fiber slippage may be one of the reasons for the drop after maximum load. In most applications of the thermoforming process, the tensile force in the direction of the fibers remains well below the maximum load. In this study, since the data obtained by tensile characterization will be used in the thermo-stamping simulation, the region after the peak point is not important.
Figure 7:Load-extension curves obtained from uniaxial tensile test warp (0°) raw data.

Figure 8:Load-extension curves obtained from uniaxial tensile test weft (90°) raw data.

Considering the averages of the curves, as seen in Figure 9, it can be seen that the average load-extension behaviors of the warp and weft directions are quite compatible with each other. Therefore, it can be assumed that the fabric is balanced.
Figure 9:Average load-extension curves obtained from uniaxial tensile test raw data.

The load-extension data obtained from the tests were converted into stress-strain curves using:
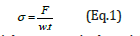
Where σ is the axial stress, F is the axial force, w and t are the strip width and fabric thickness, respectively. The stress-strain curves obtained using the average load-extension data of the warp and weft directions are shown in Figure 10. The input curve to be defined in the material card in the simulation is the curve obtained by the average of the stress-strain data of the warp and weft directions and shown with the red dashed line as seen in the Figure 10. Since the region of the stress-strain curve up to the strain value of 0.015 was considered sufficient for this study, the region after the peak point was not included.
Figure 10:Average stress-strain curves obtained from the raw data of the uniaxial tensile test.

The simulation has exact match with the experiment as displayed in Figure 11
Figure 11:Comparison of numerical results of the uniaxial tensile test with experimental results.

Bias extension test results
The bias extension test was applied for five samples. The load extension curves obtained from the tests are as seen in Figure 12.
Figure 12:Load-extension curves obtained from bias extension test raw data

The average load-extension curve obtained by testing five samples was converted into a normalized stress-shear angle curve using Eq. 2.
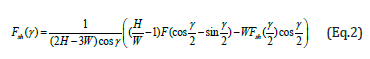
Where H,W,F,Fsh,γ, and 2/γ are the original height of the specimen, original width of the specimen, clamping force, shear force, shear angle of the zone C, and shear angle of the zone B, respectively.
Since the equation was in implicit form, a solution was achieved using MATLAB. When the normalized stress-shear angle and stress without normalization-shear angle curves were compared, it can be seen that there is a significant deviation between the two curves (Figure 13).
Figure 13:Comparison of normalized and non-normalized stress curves for bias extension test.

When the normalized shear stress-shear angle curve was examined, it revealed that the shear stiffness does not change much as in the picture frame test result. The shear angle formed in the pure shear zone requires the locking phenomenon to be observed in such a fabric, and the slope of the curve should increase significantly after the locking angle. This situation can be attributed to the phenomenon called fiber slippage. During the experiments, when the shear angle value in the pure shear zone reached approximately 28º, it was observed that the fibers began to slide at the edges of the samples. Therefore, it can be concluded that the bias extension test was unreliable above the shear angle of 28º in this study.
Figure 14 shows the shear angle contour map of the deformed test specimen. The three shear angle zones mentioned in the previous sections on bias testing are visible on the contour map obtained from the simulation. Zone C, the pure shear zone where both ends of the yarns are free, corresponds to the blue-colored zone. Zone B, which is the region where one end of the yarns is fixed, the other end is free, and where shear deformation is half of the pure shear region, corresponds to the green-colored region. Zone A, where both ends of the yarns are fixed, and there is no shear deformation, corresponds to the red-colored zone.
Figure 14:Shear angle contour map of bias extension test.

In Figure 15, shear angle-shear load curves obtained by experiment and simulation were compared. The formation of yarn slippage during the bias test causes lower force values than the ideal situation. In this case, it can be concluded that in the perfect case, only the energy consumed for shear deformation of the sample is greater than the total deformation energy in the case of fiber slippage in the sample.
Figure 15:Comparison of numerical results of bias extension test with experimental results.

Picture frame test results
The picture frame test was performed with six samples. In the tests carried out with the first five samples, a margin of 1 mm was left on the sides. Sample-6 was tested with no margins. While testing Sample-6, it was observed that the yarns stretched after a certain elongation. During the test, the load-elongation curve of Sample-6 does not comply with the expected form, as seen in Figure 16. Therefore, the results obtained with Sample-6 were not taken into account in determining the shear response of the fabric. When the results of the remaining five samples were examined, it is seen that the curves of Sample-1, Sample-3, and Sample-4 were in good agreement with each other, but the curves of Sample-2 and Sample-5 show some deviation. Therefore, the results of Sample-2 and Sample-5 were not taken into account in determining the average shear response of the fabric.
Figure 16:Load-extension curves obtained from picture frame test raw data.

It is necessary to obtain the stress-strain curve by using the load-extension data obtained from the tests. The relationship between the shear strain and crosshead displacement (dPF) is given as follows [9]:
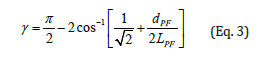
Where dPF represents the side length of the picture frame. To compare the shear stiffness data obtained using different picture frames or specimen sizes properly; the results were normalized, such that the normalized shear force according to the energy method is given by [9]:
Eq. (18) is useful for determining an analytical formula using the Lindemann law [8,9]
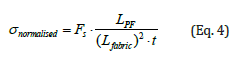
Where Lfabric and t are the side length of the fabric and thickness of the fabric, respectively. Fs is the shear force acting on the specimen.
Where θPF is the frame angle.
The averages load-extension curves of the three samples were converted to the normalized shear strain-shear angle curve as shown in Figure 17 by applying the aforementioned normalization procedure.
Figure 17:Normalized shear stress curve obtained from picture test average raw data.

The nonlinear shear stress-shear angle curve was converted into a bilinear form to determine the shear-locking angle, as seen in Figure 18. The 1st line intersects the 2nd line at approximately 1.05 rad. This corresponds to 60º.
Figure 18:Determination of shear locking angle.

Figure 19 shows that the curves obtained as a result of the simulation and experiment were in good agreement. Despite intensive work on the simulation to eliminate this deviation, a perfect fit could not be obtained. It is thought that the inability to achieve an exact match is due to the uncertainties inherent in the material.
Figure 19:Comparison of numerical results of picture frame test with experimental results.

Conclusion
In this study, fabric characterization tests were carried out to determine the mechanical properties of the fabric that should be defined in the simulation of the thermo-stamping process. The load-extension data obtained from the tests were converted into stress-strain curves by applying the normalization procedure. Numerical analyzes were performed to validate the material model. Conclusions were drawn as follows:
When the uniaxial tension test results were compared, it was seen that the experiment and numerical results matched exactly. The bias extension test result was in good agreement with the numerical result up to the shear angle value at which the fiber slippage occurs. Although the picture frame test result was close to the numerical results, the exact match of the results could not be achieved.
When the bias extension and picture frame tests applied for fabric shear characterization were compared, it was seen that the bias extension test was easier to apply; however, it did not give reliable results in the advanced stages of deformation due to fiber slippage occurring after a certain shear deformation.
The application of the picture frame test was easier than the bias extension test since it required special apparatus. However, the picture frame test results were highly affected by the tow tension during deformation. To solve the tow tension problem, special apparatus should be used, or samples should be clamped into picture frame apparatus with sufficient margin.
References
- Zhang W (2019) Fundamentals of thermoforming processes of Carbon Fiber Reinforced Plastic (CFRP) parts (Doctoral dissertation, Northwestern University).
- Creech G (2006) Mesoscopic finite element modelling of non-crimp fabrics for drape and failure analyses (Doctoral dissertation, Cranfield University).
- Lebrun G, Bureau MN, Denault J (2003) Evaluation of bias-extension and picture-frame test methods for the measurement of intraply shear properties of PP/glass commingled fabrics. Composite Structures 61(4): 341-352.
- Taha I, Abdin Y, Ebeid S (2013) Comparison of picture frame and Bias-Extension tests for the characterization of shear behaviour in natural fibre woven fabrics. Fibers and Polymers 14(2): 338-344.
- Büyükbayraktar RB (2021) An investigation on shear properties of woven fabrics by bias-extension test. The Journal of the Textile Institute 112(3): 505-513.
- Pierce RS (2014) Improving the process modelling capability for manufacturing large composite structures used on passenger aircraft (Doctoral dissertation, Monash University).
- Uren N, Oner E, Okur A (2017) A novel approach for precise determination of in plane shear behavior of woven fabrics. Textile Research Journal 87(11): 1335-1348.
- Launay J, Hivet G, Duong AV, Boisse P (2008) Experimental analysis of the influence of tensions on in plane shear behaviour of woven composite reinforcements. Composites Science and Technology 68(2): 506-515.
- Sirtautas J (2017) Coupled fabric deformation and infusion process simulation (Doctoral dissertation, University of Stuttgart).
© 2022 Fahrettin Ozturk. This is an open access article distributed under the terms of the Creative Commons Attribution License , which permits unrestricted use, distribution, and build upon your work non-commercially.
Editor In Chief


.jpg)


Signup for Newsletter

Quick Links
 Editorial Board Registrations
 Submit your Article
 Refer a Friend
 Advertise With Us
Our Recent Edition

.jpg)


Top Editors


.jpg)


.bmp)
.jpg)
.png)
.jpg)


.jpg)


.png)

.png)


.png)


Financial Support

Sponsors

Latest e-Books

Latest Video

 a Creative Commons Attribution 4.0 International License. Based on a work at www.crimsonpublishers.com.
Best viewed in
a Creative Commons Attribution 4.0 International License. Based on a work at www.crimsonpublishers.com.
Best viewed in