
- About Us
- Information
-

The Author ensures that the research has been conducted responsibly and ethically with adherence to all relevant regulations. read more..
- For Authors
- For Reviewer
- Manuscript Guidelines
- Membership
- Publication Ethics
-
- Journals
- Reprints
- e-Books
- Videos
- Policies
- Contact Us
 COVID-19
- Submissions


Full Text
Research & Development in Material Science
Effect of Cold Air Jet Cooling on Weld Quality in Friction Stir Welding of AA2024-T351
Marvene Xavier Fernandes1, Jamal Sheikh-Ahmad1, Fahrettin Ozturk2,3*, and Firas Jarrar1
1Department of Mechanical Engineering, Khalifa University of Science and Technology, United Arab Emirates
2Turkish Aerospace Industries, Inc., Ankara, Turkey
3Department of Mechanical Engineering Ankara Yildirim Beyazit University, Ankara, Turkey
*Corresponding author: Fahrettin Ozturk, Department of Mechanical Engineering Ankara Yildirim Beyazit University, Ankara, Turkey
Submission: January 11, 2022;Published: January 24, 2022

ISSN: 2576-8840 Volume 16 Issue 3
Abstract
In this study, AA2024 sheet is Friction Stir Welded (FSW) at different rotational speeds from 800 to 1200rpm and different welding speeds from 50 to 200mm/min. A comparative study on weld quality is conducted between air cooling by natural cooling and cold air jet cooling. Thermal histories are recorded at specific locations from the weld line and the maximum temperature is estimated. Macrostructure, microstructure, and mechanical properties of the weld are also studied. Microstructure analysis indicates that significant grain refinement occurred in the weld nugget. However, the results showed that cold air jet cooling has no significant effect on the weld quality or grain refinement.
Keywords: Friction stir welding; Stir welding; Air cooling; Cold air jet cooling; Natural cooling of stir welding
Introduction
Friction stir welding (FSW) is a solid-state joining process that was invented at The Welding Institute (TWI) of the UK in 1991. Initially, it was applied only to aluminum alloys, but it is now applicable to various types of metal alloys such as titanium, steel, etc. [1]. Applications for the FSW of AA2024 and its tempered variations have been successfully manufactured worldwide contributing to industries including aerospace, automotive, shipbuilding, and many more. The introduction of submerged welding, such as underwater, and cryogenic treatments is of ongoing research for grain size refinement and higher tensile strength properties. Wang et al. [2] conducted a study on the FSW of two AA2024-T4 plates of 5mm thickness at 750rpm and 150mm/min. The results have shown that the advancing side (AS) yielded 15-20 °C peak temperatures than those of the Retreating Side (RS). As distance from the weld line increases, the peak temperatures did not have significant difference relative to each other. Liu et al. [3] conducted an experimental study on the FSW of two AA2219 plates of 7mm thickness at constant 800rpm, 100mm/min and 2.5° tilt angle. A comparison for tensile test properties between normal joint and underwater joint was made. Normal joint had a tensile strength of 324MPa having a joint efficiency of 75% (base metal tensile strength was 432 MPa) while the underwater joint had 341MPa tensile strength with a joint efficiency of 79%. However, underwater joint elongation reached up to 7.6% which is lower than that of the normal joint. There is an improvement in the tensile strength, but deterioration of its plasticity for underwater joints. Current studies show that the effect of grain size reduction mainly comes from the recrystallization at certain temperature ranges and suitable welding parameters. Mechanical properties, such as tensile strength, of the Weld Nugget (WN) reflect on the grain size behavior and the heat input imposed. In addition, the effect of submerged welding lead to higher tensile strength and more brittleness at the welded joint as well as slight reduction in hardness at the WN. Therefore, in this study, the effect of cold air jet cooling on temperature, microstructure, and tensile strength were analyzed in relation to welding parameters and weld quality.
Materials and Methods
The FSW in butt joint configuration was performed on AA2024-T351 plates using a conventional milling machine. The chemical composition of this aluminum alloys is listed in Table 1; [4]. The size of the plates was 100 x 60 x 2.5mm and they were welded along the 100mm side. The welding parameters were the rotation speed and the welding speed, and they were varied in three levels as shown in Table 2. To investigate the effect of cooling on the weld quality, Vortec Dual Nozzle cold air gun (Model No. 632) was used to cool the weld line region during welding. The temperature of the air jet was maintained at -1.5 to -2 °C with a constant pressure of 0.5MPa from the air line. The nozzles of the air gun were directed just behind the moving tool at a constant distance of about 20mm. Figure 1 shows the experimental setup and Figure 2 shows the friction stir welding tool used in the study. The commercially available the FSW tool was made from H13 steel and has a shoulder diameter of 15mm with a circular groove and a threaded pin that is 6mm at the base, 4mm at the tip, and has a pin length of 2.3mm. The thread pitch is around 0.5mm.
Figure 1: Experimental setup.

Figure 2: The FSW H13 steel tool with dimensions (all units in mm).

Table 1: Chemical composition of AA2024-T351 [wt%] [4].

Temperature measurement during the welding process was performed on the top surface of the plates using small gage K-type thermocouples. 1mm diameter and 1.5mm deep holes were drilled at specific locations from the weld line and thermocouple beeds were placed in the holes. A high conductivity thermal paste was used to the fill the holes before the insertion of the thermocouple beads. The first hole was 10mm from the weld line on each side, and the remainig holes were spaced at 5mm increments from the first hole. The sampling rate for data acquisition was 2s-1.
After welding, samples were cut perpendicular to the weld line for metallographic preparation. The specimens were initially polished with 800, 1000, and 1500 grit SiC sand papers, followed by 3μm Alumina powder, and then with colloidal Silica. The samples were then dipped in Keller solution consisting of HF (1ml), HCl (1.5ml), HNO3 (2.5ml), distilled H2O (95ml) at room temperature for 10 seconds. Next, they were observed under a light microscope with a trade mark of Huvitz at high magnification. Line intercept method was used to determine the grain size in the different regions of the welding zone.
Tensile specimens were cut using the CNC wire electrical discharging machine (EDM) (Excetek V500G). The specimens were cut directly above the thermocouple hole locations since the weld quality has better stability towards the end of the welding process. Subsize tensile test specimens were prepared according to ASTM E8/E8M - 09 [5] with a gage length of 32mm and a total length of 100mm. All specimens were cut and prepared such that the welded zone is in the middle of the gage length and that the gage length was orthogonal to the weld line. Room temperature tensile tests were performed on a universal testing machine (MTS Alliance RF/150) at a crosshead speed of 1mm/min.
Results and Discussion
Weld quality
The cross section of the weld line was inspected under microscope for identification of welding defects. Figure 3 shows representative cross sections of the weld regions for welding at 1200rpm and different welding speeds and cooling methods. It can be seen that sound welds are generally obtained at high rotation speed and low welding speed, which are the conditions for high process temperatures and improved material flow ability. As the welding speed is increased, the process temperatures are reduced, and the material flow becomes more difficult. This results in the formation of voids. The extent of void formation increases with increasing welding speed and is further aggravated by cold air jet cooling. Table 3 shows the classification of weld quality based on defects present in the weld nugget. It can be seen that sound welds were obtained only for a narrow range of welding conditions. For most the welding conditions used, the weld nugget had defects varying from small voids to large tunnels or surface cracks.
Figure 3: Macrostructure of the welded joints showing the FSW zones including the weld nugget (WN), thermomechanically affected zone (TMAZ), heat affected zone (HAZ), and the base metal (BM) for different welding conditions. Air cooled welds as shown in (a-c) and jet-cooled welds are shown in (d-f).

Table 2: Test matrix for the FSW experiments.

Table 3: Classification of weld quality for different welding speeds and rotational speeds.

Process temperatures
Figure 4 shows temperature histories as recorded by belowsurface mounted thermocouples for welding condition 1200rpm and 50mm/min. Both air cooled (a) and cold air jet cooled (b) histories are shown. In these figures, the dashed lines represent temperature readings on the advancing side. It can be seen that both air cooled and cold air jet cooled histories show the same characteristic behavior. The temperature at each measurement location rises abrubtly as the welding tool passes by this location and then drops drastically due to thermal conduction. The peak temperatures are higher as the thermocouple location gets closer to the weld line. To avoid destroying thermocouples, the closest distance from the weld line was kept at 10mm. To estimate the temperature of the material at the weld line, i.e., the center of the weld nugget, the peak temperatures from these histories are graphed against distance from the weld line and their distribution was fitted to a mathematical function as shown in Figure 5. It was found that the peak temperature distribution on both sides of the weld line could be accurately fitted using 4-parameter Gauss function as described in [6]. Once the data is fitted to the Gauss function, the same function is used to determine the maximum temperature at the weld line, at x = 0mm.
Figure 4: Temperature history for air cooled (a) and jet cooled (b) welding at 1200rpm and 50mm/min.

Figure 5: Estimating the peak temperature at the weld line using 4-parameter Gauss function a) air cooled, (b) jet cooled.

Figure 6 shows the effect of process parameters on the estimated maximum weld line temperature (main effect plots). Each point in this plot represents the average of three experiments conducted at the given rotational speed or welding speed. For example, the data point for 800rpm in (a) represents the average of the three tests (800-50), (800-100), and (800-200). Similarly, the data point for 50mm/min in (b) represents the average for (800-50), (1000-50), and (1200-50). The length of the error bars represents the range of data. In both sets of curves, it can be seen that the estimated maximum temperature in the weld zone has been reduced by cold air jet cooling. Furthermore, the welding temperature did not vary significantly with rotation speed and decreased slightly with the increase in wleding speed. This is in agreement with the findings in the literature [6,7]. Furthermore, the temperature ranges for both sets of curves lie within the ranges obtained in the study conducted by [2,7,8].
Microstructure
Grain sizes were measured at the Base Metal (BM) regions on both sides, transition regions (HAZ & TMAZ), and at the center (WN). The grain size of the base metal and TMAZ was 38μm and 18μm, respectively. Grain size reduction occurred from outside to the center of the sample. This is due to the dynamic recrystallization driven by plastic deformation. Furthermore, the transition zone values are roughly half of the outside base values. A transition from TMAZ to WN can be seen under high magnification in Figure 7, which represents the changes in the grain size patterns as the grains become smaller at the WN. The figure clearly shows that grain refinement occurred in both TMAZ and WN. The greatest grain refinement occurred in the WN when average grain size decreased from 38μm (base metal) to approximately 3.5μm for air cooled welds and from 36μm to 3.0μm for cold air jet cooled welds. Figure 8 shows the microstructure at the center of the weld nugget for air cooled (a) and cold air jet cooled (b) welds. Average grain size measurements from these figures and similar figures for other welding conditions are shown in Figure 9(a) & 9(b) relative to rotational and welding speeds, respectively. The data points represent data means and the error bars represent the range of data. In Figure 9(a), an increase in rotational speed lead to a slight increase in the grain size. There is also an apparent further reduction in grain size due to cold air jet cooling.
Figure 6: Estimated Tmax at the weld line vs. (a) rotational speed and (b) wleding speed.

Figure 7: Micrograph showing the transition from TMAZ to WN for 1200-50-A-R3. Magnification bar length is 200μm.

Figure 8: Microstructure of the base metal, TMAZ and WN.

Since the FSW is a thermomechanical process, the evolution of microstructure depends on thermomechanical variables such as strain, strain rate, and temperature. A parameter which lumps the effects of strain rate and temperature in one is the Zener-Hollomon parameter, Z=𝜀̇ exp(𝑄/𝑅𝑇), where Q is activation energy and R is the universal gas constant. It was found in previous studies that a correlation exists between recrystallized grain size and the Zener- Hollomon parameter, Z in the FSW of AZ31Mg alloy [11] and Al-Mg alloy [6],

where a and b are constants. To obtain the necessary parameter values of Z in this research, an activation energy of 140kJ/mol was used for aluminum alloys [9]. A simple relationship proposed by [10] assumes a torsion type deformation that estimates the rate of deformation in the WN.
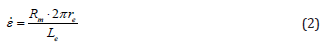
This equation calculates 𝜀̇ where Rm is the average material flow rate, re is the radius of the Stir Zone (SZ), and Le is its depth. As a first approximation, [10] assumed that Rm is equivalent to half of the pin rotational speed in rad/s. The other two parameters, re and Le, correspond to the radius of the pin at half-length and the pin length, respectively [6]. Figure 10 shows the relationship between ln(Z) and average grain size in the WN for air cooled and cold air jet cooled welding conditions. It can be seen that the grain size did not vary significantly with ln(Z) for air cooled welding but increases slightly with increasing ln(Z) for cold air jet cooled welds. These results are not consistent with the findings in [6,10], where a monotonic decrease in grain size was associated with the increase in ln(Z). This behavior was associated with incomplete dyanmic recrystallization [11]; Figure 10.
Figure 9: Grain size at the stir zone vs. (a) rotational speed and (b) wleding speed.

Figure 10: Relationship between the Zener-Hollomon parameter and average grain size in the weld nugget.

Tensile strength
Main effect plots between both speeds (rotational speed and welding speed) and average tensile strength values for both air cooled and jet cooled samples are illustrated in Figure 11. The error bars represent the range of data. The results show that cooling method has no significant influence on the tensile strength. Furthermore, extremely low tensile strength values were obtained for most of the tests due to the presence of defects in the weld as shown in Figure 3. In Figure 11a, the effect of increasing rotational speed leads to an overall decrease in average tensile strength. In Figure 11b, increasing welding speed leads to an overall decrease in average tensile strength. The weld efficiency, which is defined as the ratio of the tensile strength of the welded sample over the tensile strength of the base metal is shown in Tables 4 & 5 for air cooled and cold aire jet cooled welding, respectively. The highest weld efficiency of 88.6% was obtained for air cooled welding at 1200rpm and 50mm/min. The highest weld quality for cold air ject cooling was 82.9% obtained at 800rpm and 100mm/min.
Figure 11: Average tensile strength vs. (a) rotational speed and (b) wleding speed.

Table 4: Assessment matrix for weld quality by joint efficiency (air cooled).

Table 5: Assessment matrix for weld quality by joint efficiency (jet cooled).

Conclusion
Similar AA2024-T351 alloys were welded by the FSW under air cooling and jet cooling conditions. Some of the welding conditions had sound welds while others were of poor quality due to weld defects and experimental errors. Following results were obtained.
a) The estimated Tmax values in the weld zone have been reduced by cold air jet cooling. No significant differences were observed between AC and JC methods; however, both follow a similar trend relative to welding speed.
b) There was grain size refinement in the Weld Nugget (WN) for both AC and JC welds. However, the differences between the two were insignificant. Temperature and strain rate showed a correlation with grain size. It has been shown that grain size was independent of Z and estimated Tmax possibly due to incomplete dynamic recrystallization; however, grain size slightly increased with strain rate.
c) Average tensile strength increased as welding speed decreased and slightly decreased as rotational speed increased. The effect of jet cooling on average tensile strength was insignificant
References
- Mishra RS, Ma ZY (2005) Friction stir welding and processing. Materials Science and Engineering: R: Reports 50(1-2): 1-78.
- Wang L, Davies C, Wimpory R, Xie L, Nikbin K (2010) Measurement and simulation of temperature and residual stress distributions from friction stir welding AA2024 Al alloy. Materials at High Temperatures 27(3): 167-178.
- Liu HJ, Zhang HJ, Huang YX, Yu L (2010) Mechanical properties of underwater friction stir welded 2219 aluminum alloy. Transactions of Nonferrous Materials Society of China 20(8): 1387-1391.
- Dilmec M, Halkaci HS, Ozturk F, Livatyali H, Yigit O (2013) Effects of sheet thickness and anistropy on forming limit curves of AA2024-T4. The International Journal of Advanced Manufacturing Technology 67: 2689-2700.
- ASTM International. Standard Test Methods for Tension Testing of Metallic Materials, E8/E8M-09.
- Sheikh-Ahmad J, Ozturk F, Jarrar F, Evis Z (2015) Thermal history and microstructure during friction stir welding of Al-Mg alloy. International Journal of Advanced Manufacturing Technology, pp. 1-11.
- Xu W, Liu J, Luan G, Dong C (2009) Temperature evolution, microstructure and mechanical properties of friction stir welded thick 2219-O aluminum alloy joints. Materials and Design 30(6): 1886-1893.
- Khodir SA, Shibayanagi T, Naka M (2006) Microstructure and mechanical properties of friction stir welded AA2024-T3 aluminum alloy. Materials Transactions 47(1): 185-193.
- Cerri E, Leo P (2013) Influence of high temperature thermal treatment on grain stability and mechanical properties of medium strength aluminium alloy friction stir welds. Journal of Materials Processing Technology 213(1): 75-83.
- Chang C, Lee C, Huang J (2004) Relationship between grain size and Zener-Holloman parameter during friction stir processing in AZ31 Mg alloys. Scripta Materialia 51(6): 509-514.
- Yuan Li, Peijun Hou, Zhenggang Wu, Zhili Feng, Yang Ren, et al. (2021) Dynamic recrystallization of a wrought magnesium alloy: Grain size and texture maps and their application for mechanical behavior predictions. Materials & Design 202: 109562.
© 2022 Fahrettin Ozturk. This is an open access article distributed under the terms of the Creative Commons Attribution License , which permits unrestricted use, distribution, and build upon your work non-commercially.
Editor In Chief


.jpg)


Signup for Newsletter

Quick Links
 Editorial Board Registrations
 Submit your Article
 Refer a Friend
 Advertise With Us
Our Recent Edition

.jpg)


Top Editors


.jpg)


.bmp)
.jpg)
.png)
.jpg)


.jpg)


.png)

.png)


.png)


Financial Support

Sponsors

Latest e-Books

Latest Video

 a Creative Commons Attribution 4.0 International License. Based on a work at www.crimsonpublishers.com.
Best viewed in
a Creative Commons Attribution 4.0 International License. Based on a work at www.crimsonpublishers.com.
Best viewed in