
- About Us
- Information
-

The Author ensures that the research has been conducted responsibly and ethically with adherence to all relevant regulations. read more..
- For Authors
- For Reviewer
- Manuscript Guidelines
- Membership
- Publication Ethics
-
- Journals
- Reprints
- e-Books
- Videos
- Policies
- Contact Us
 COVID-19
- Submissions


Full Text
Research & Development in Material Science
Fractal Properties of Etched Microcrystalline Silicon Surfaces
Stanislav Jurečka1* and Martin Kopáni2
1Institute of Aurel Stodola, Faculty of Electrical Engineering and Information Technology, University of Žilina, Slovakia
2Institute of Medical Physics, Biophysics, Informatics and Telemedicine, Faculty of Medicine, Comenius University, Slovakia
*Corresponding author: Stanislav Jurečka, Institute of Aurel Stodola, Faculty of Electrical Engineering and Information Technology, University of Žilina, Slovakia
Submission: December 21, 2021;Published: January 21, 2022

ISSN: 2576-8840 Volume 16 Issue 3
Summary
Properties of the microcrystalline silicon surfaces etched by the hydrofluoric acid were analysed by different fractal methods. The surface microstructure of prepared samples was experimentally studied by the electron microscope. Obtained images were represented by the random height function and used in the determination of fractal characteristics useful in surface texture analysis (fractal dimension and succolarity). Obtained results were used in study of the influence of etching steps on the properties of formed surface microstructure.
Introduction
Real microcrystalline silicon is a mixture of small crystalline grains (also known as crystallites) and amorphous phase silicon. It is distinct from monocrystalline and amorphous silicon. Microcrystalline (more general polycrystalline) silicon is being used in large-area electronics and as a raw material by the solar photovoltaic industry (multicrystalline solar cells are the most common type of solar cells in the photovoltaic market). Solar cells prepared from this material are attractive for production cost and suitable solar cell efficiencies. Properties of formed solar cells are determined by the properties of device microstructure. The importance of the microstructure properties can be illustrated by the following example showing enormous complexity of the problem. For the intrinsic hydrogenated microcrystalline Si layers in solar cells, promising solar cell efficiencies were obtained at the transition from microcrystalline to amorphous growth [1]. This transition occurs in a very narrow range of silane-to- hydrogen ratio in the process gas and depends on the surface morphology of the substrate. Near the transition from crystalline to amorphous growth the defect density of the intrinsic material decreases rapidly. An accompanying effect is the increase in the concentration of the silicon-hydrogen bonds [2-6]. Exact control of the microstructure during the deposition is therefore a crucial requirement.
In this work we analyse properties of the microcrystalline silicon surfaces etched by the hydrofluoric acid. The surface microstructure of prepared structures was experimentally determined by the Electron Microscope (EM). Obtained EM images were represented by the random height function h(x,y) providing information about the height position of atom above the reference plane h at surface position (x,y). We studied properties of the h(x,y) functions by the fractal geometry methods. Fractal characteristics used in texture analysis (fractal dimension, lacunarity and succolarity) explore different aspects of the EM images in a complementary way. Two images could present the same fractal dimension but different succolarity and similar other combinations. The fractal dimension is a measure that characterizes how much an object occupies the space. It does not change with scale, translation, or rotation. Lacunarity measures the size and frequency of gaps on the image. Succolarity indicates the capacity of a flow to cross the texture. On fractal textures it can be defined as evaluation of the degree of filaments that allow percolations. In this paper we present results of the multifractal singularity, generalized fractal dimension and fractal succolarity analysis important for evaluation of microstructure properties development during the technological treatment steps.
Theory
In our approach the computation of multifractal singularity spectra f(α) and generalized fractal dimension Dq is based on multifractal detrended fluctuation methods [7-9]. The computation of fractal succolarity is based on implementation of box counting idea [10]. The method relates to relevant differentiating images with some directional information associated with it. Determined succolarity could be used as a new feature in pattern recognition processes for the identification of natural textures and provides complementary information not discriminated by other fractal geometry concepts - fractal dimension or lacunarity [11]. In evaluation of the relation among direction and percolation the pressure of a virtual fluid is considered. The input of the boxcounting method is binary image.
To describe the box-counting method for the succolarity analysis let us consider the image on Figure 1a as an example. Each image pixel can be considered as empty (blue) or filled with impenetrable mass (white). Let us simulate the percolation capacity of a fluid through the image. On the image of Figure 1b, the original image was flooded horizontally in left to right direction. Other directions can be also applied to generate different overflowing images.
Succolarity σ can be estimated by covering given image with boxes of various sizes. We have two ways to divide the image of Figure 1b into equal sized boxes. With a dividing factor, d=9 we obtain boxes of 1x1 pixels and by d=3 we obtain boxes of 3x3 pixels. After creating covering boxes, the occupation percentage O is measured in each box size. For selection of box size equal to 1 pixel and direction left to right (Figure 1b) each box corresponds to a pixel. The occupation percentage could 0 (pixel without fluid) or 100% (pixel with fluid). We can see that 12 boxes have 100% of occupation (white) and 69 boxes have 0% occupation. Beside the occupation percentage the pressure P is computed. For each boxsize the pressure is computed as centroid of selected box. Figure 1b presents 7 occupied boxes on the first column and 5 boxes on the second column. Pressures for pixels in the first column are P=0.5 and in the second column P=1.5. Fractal succolarity σ is then computed by equation:
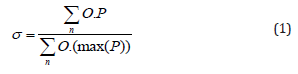
Figure 1: Implementation of the box-counting method: a) original image, b) image obtained after the first step of succolarity computation: left to right.

where we sum over all boxes n. In previous example the numerator is 7×0.5+5×1.5=11 and the denominator is 9×(0.5+1.5 +2.5+3.5+4.5+5.5+6.5+7.5+8.5) = 364.5. Fractal succolarity for the box size 1×1 and left to right computation is then σ=11/364.5 ≈ 0.0302.
Results And Discussion
Microcrystalline silicon samples were etched in hydrofluoric acid for 1, 2.5, 5 and 10 seconds. Surface microstructure of prepared samples was examined by electron microscope (Figure 2) and properties of observed surfaces were analysed by fractal and statistical methods.
Figure 2: The electron microscopy scans of microcrystalline Si samples etched by the HF acid: a) reference sample, b) etching time 2.5min., c) etching time 5.0min., d) etching time 10min.

The shape of multifractal singularity spectra f(α) and generalized fractal dimension Dq shown in Figure 3 & Figure 4 indicate multifractal properties of formed surfaces (humped shape of f(α) function and nonlinear decreasing ‘S’ shape behaviour of Dq function). The width of the f(α) spectra increases with etching time and show emphasized fractality of formed surfaces, especially after 10 minutes of etching. Identical trend of the surface fractality after the 5 minutes of etching is observed on the Dq curves presented on Figure 4.
Figure 3: Multifractal singularity spectra f(α) of etched μc-Si structures.

Figure 4: Generalized fractal dimension Dq of etched μc-Si structures.

Distribution of values represented at the EM images of etched surfaces by the 8-bit grayscale model were described by histograms shown on Figure 5. With the prolongation of etching time small heights of the surface features are generally formed and beside wide fraction of relative high features very intensive and narrow distribution of small heights is significant for structure formed by surface etching for 10 seconds (see curve ‘10’ at Figure 5). Etching of microcrystalline Si samples produces lower surface features with narrower distribution of observed shapes. Increased fractality of etched surfaces show that formed shapes possess selfsimilarity and scaling property not revealed by classical Euclidean geometry. These multifractal properties are often observed for structures formed by technological operations of surface treatment of semiconductor systems.
Figure 5: Histograms of the h(x,y) values.

Average fractal succolarity curves σAVG computed by the boxcounting method described above are shown in Figure 6.
Increasing of etching time systematically increases the intensity of forming surface percolations (see fractal succolarity behavior for etching time below 5 minutes on Figure 6. With further prolongation of etching time the fractal succolarity values decrease (see the succolarity curve for 10 minutes of etching on Figure 6). This is directly connected to drastic suppression of surface percolations which is important for the quality of surface structure for the photovoltaic applications.
Figure 6: The values of average fractal succolarity σAVG = 105*σ.

Conclusion
The properties of surface microstructure of etched microcrystalline silicon are substantially influenced by the technological treatment operations. Produced etched surfaces show multifractal properties connected with the distributions of surface features, self-similarity and scaling properties not described by the Euclidean approach. The development of the multifractal singularity spectra, generalized fractal dimension and fractal succolarity with the prolongation of etching time show systematic changes in the distribution of surface features with the etching conditions and can be used for optimization of technological treatment of formed samples for required applications.
References
- Vetterl O, Finger F, Carius R, Hapke P, Houben L, et al. (2000) Sol Energy Mater Sol Cells 62(2000):
- Baia Neto AL, Lambertz, Carius R, Finger F (2002) J Non-Cryst Solids 299-302: 274.
- Gordijn A, Rath JK, Schropp REI (2006) Prog Photovoltaics 14: 305.
- Yan B, Yue G, Yang J, Guha S, Williamson DL, et al. (2004) Appl Phys Lett 85(11):
- Yan B, Yue G, Owens JM, Yang J, Guha S (2006) Proc 4th World Conf on Photovoltaic Energy Conversion.
- Klein S, Mai Y, Finger F, Donker MN, Carius R (2005) 15th Int Photovoltaic Science and Engineering Conf (PVSEC - 15), 49-52: 73.
- Jurecka S, Matsumoto T, Imamura K, Kobayashi H (2017) Multifractal analysis and optical properties of nanostructured silicon Applied Surface Science 395: 150-156.
- Kantelhardt JW, Zschiegner SA, Koscielny-Bunde E, Havlin S, Bunde A, et al. (2002) Multifractal detrended fluctuation analysis of nonstationary timeseries. Physica A 316: 87-114.
- Ihlen EAF, Vereijken B (2010) Interaction dominant dynamics in human cognition: beyond 1/f J Exp Psychol Gen 139: 436-463.
- Block A, von Bloh W, Schellnhuber HJ (1990) Efficient box-counting determination of generalized fractal dimensions. Physical Review A 42: 1869-1874.
- Mandelbrot BB (1977) Fractal geometry of nature. Freeman, New York, USA.
© 2022 Stanislav Jurečka. This is an open access article distributed under the terms of the Creative Commons Attribution License , which permits unrestricted use, distribution, and build upon your work non-commercially.
Editor In Chief


.jpg)


Signup for Newsletter

Quick Links
 Editorial Board Registrations
 Submit your Article
 Refer a Friend
 Advertise With Us
Our Recent Edition

.jpg)


Top Editors


.jpg)


.bmp)
.jpg)
.png)
.jpg)


.jpg)


.png)

.png)


.png)


Financial Support

Sponsors

Latest e-Books

Latest Video

 a Creative Commons Attribution 4.0 International License. Based on a work at www.crimsonpublishers.com.
Best viewed in
a Creative Commons Attribution 4.0 International License. Based on a work at www.crimsonpublishers.com.
Best viewed in