
- About Us
- Information
-

The Author ensures that the research has been conducted responsibly and ethically with adherence to all relevant regulations. read more..
- For Authors
- For Reviewer
- Manuscript Guidelines
- Membership
- Publication Ethics
-
- Journals
- Reprints
- e-Books
- Videos
- Policies
- Contact Us
 COVID-19
- Submissions


Full Text
Research & Development in Material Science
Inadequacies of Electrical Insulation Materials for Future, High-Frequency, “Smart Grid,” Solid-State Power Transformers
Terry A Ring1*, Bjorn C Vaagensmith2 and Jesse L Reeves2,3
1Chemical Engineering, University of Utah, USA
2Idaho National Laboratory, 1955 N. Fremont Ave., Idaho Falls, ID 83415, USA
3Present Address: Northrup Grumman, 5770 S. Missile Way, Roy, UT 84067, Utah, USA
*Corresponding author: Terry A Ring, Chemical Engineering, University of Utah, 50 S. Central Campus Drive-MEB 3290, Salt Lake City, UT 84112, USA
Submission: November 11, 2021;Published: November 18, 2021

ISSN: 2576-8840 Volume 16 Issue 1
Abstract
Future flexible smart-grid power transformers convert DC and wind turbine power to power grid standards using high-frequency transformers to be operated in the 10 to 100kHz range. Fits of AC conductivity and dielectric permittivity as a function of temperature and frequency have been developed for the electrical insulation materials SiO2, Al2O3, Poly Imide. The Debye dipole relaxation equation provides quality fits of the frequency dependence for SiO2 and Al2O3 data of both the real and imaginary parts of the dielectric permittivity data that satisfy Kramers-Konig relations linking the real and imaginary parts mathematically. Poly Imide data has been fit with a modified Debye dipole relaxation equation. The temperature dependence of fit coefficients has been determined and used to generalize the fit to be temperature dependent as well as frequency dependent. AC conductivity as a function of temperature and frequency calculated from the imaginary part of the dielectric permittivity fits for all materials showing that none of these materials meet the needs of smart-grid power transformers of the future according to both Buchanan’s criterion for high temperature electrical insulation materials and Joule heating induced thermal rise calculations.
Introduction
Dielectric permittivity data for high-temperature, high-frequency electrical insulation materials is rarely available in the literature. A google search of temperature and frequency dependent dielectric permittivity models gives only a few examples of empirical models which in general do not satisfy the Kramers-Konig relations. Dielectric permittivity is an important property for electrical insulation materials used in high frequency transformers.
In the smart-grid of the future there are needs for a high-power, high-frequency grid-scale transformers operating in the 10 to 100kHz range [1]. This transformer converts power generated in any waveform to grid standards required for long-distance transmission. To provide adequate performance and 20-30 year service life for such a transformer, the electrical insulation material should survive a large temperature rise due to Joule and electromagnetic heating and the occasional geomagnetic disturbances, electromagnetic pulses or lightning strikes on the grid. Over 50% of today’s transformer failures are caused by electrical insulation failure or degradation [2]. Candidate materials for smart-grid high frequency transformer insulation materials consist of high-temperature polymers and ceramics.
Electrical insulation materials breakdown due to avalanche breakdown and thermal breakdown. Avalanche breakdown is characterized by the dielectric strength of a material also called its breakdown voltage. Electrical insulation materials undergo thermal breakdown due to an applied electric field that generates heat. The equation of interest is the heat conduction equation with a Joule heating source term on the right hand side:
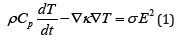
Where T is the temperature of the material, ρ is the material density, Cp is the heat capacity, κ is the thermal conductivity, σ is the conductivity and E is the local electric field. This equation has boundary conditions for the temperature at the surface, To,
being either material-material contact heat conduction or materialfluid
convection boundary conditions, i.e. 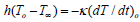 , apply. T∞ is the ambient fluid temperature (air or oil). In the
insulation, the electric field is defined as the spatial gradient of the
voltage, E = ∇v = ΔV / Δx , and is obtained from Gauss’s Law:
, apply. T∞ is the ambient fluid temperature (air or oil). In the
insulation, the electric field is defined as the spatial gradient of the
voltage, E = ∇v = ΔV / Δx , and is obtained from Gauss’s Law:
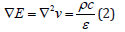
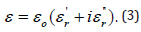
where ρc is the free charge density in the material and ε is the complex dielectric permittivity:
The AC electrical conductivity, σ, is related to the imaginary
part of the dielectric permittivity,  by [3]:
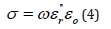
where ω (=2πν) is the angular frequency in radians per second
and ν is the frequency in cycles per second or Hz,
is the imaginary
part of the relative permittivity, ε, and εo is the permittivity of
vacuum. Gauss’s Law is solved with associated boundary conditions
on the voltage at various surfaces in the transformer. For a given
transformer with the voltages applied to the primary winding,
there is a magnetic field generated in the core that generates
a voltage in the secondary windings. These voltages are the
boundary conditions for Gauss’s Law in the insulation materials
separating the two coils over which the heat conduction equation
is to be solved in an efficient high frequency transformer [4] with
an interleaved winding structure. There are other ways to design a
high frequency transformer with individual coils on individual legs
of the core. Even these individual coils on individual legs of the core
have thin sections of insulation between the individual coil at high
voltage and ground at various points leading to locally very high E
values and locally high Joule heating.
All of the thermal properties in the heat conduction equation,
i.e. Cp and κ (Appendix for this data) and its boundary conditions
(hi) are of interest as well as the electrical conductivity, σ, and the
dielectric permittivity, ε, of the insulation. All of these thermal
properties are a function of temperature, and the electrical
properties are a function of frequency and temperature making
the above differential equations highly coupled. The steadystate
operating temperature profile is determined when the
time derivative of temperature is zero,  Under steady-state
conditions, the heat losses at the outer boundaries is equal to the
Joule heating, σE2, within the volume of the insulation giving rise to
an equation for the thermal rise given by:
Under steady-state
conditions, the heat losses at the outer boundaries is equal to the
Joule heating, σE2, within the volume of the insulation giving rise to
an equation for the thermal rise given by:
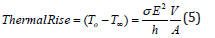
Where h is the heat transfer coefficient, V is the volume of the cylindrical coil and A is the external area of the coil where heat is lost via the heat transfer coefficient h. For thin sheets of insulation between interleaved coils, V/A≈δ where δ is the thickness of the insulation sheet over which the gradient in voltage, Δv, is observed giving E=(Δv/δ). The difference between the steady-state operating temperature and ambient temperature is equivalent to the thermal rise for which electrical insulations are classified, see Table 1. Due to the high transmission voltages associated with the power grid up to 765kV, significant amounts of Joule heating occur in electrical insulation materials. Higher temperature insulations are of interest to promote longer transformer lifetimes. The Class C in Table 1 corresponds to ceramic insulation materials whose upper temperature limits are established by the ceramic material chosen.
Table 1: Insulation Classes. Data A, B, F, N, H taken from hammondpowersolutions.com/en/resources/definition/ what-is-meant-by-class-in-insulation.

Note: the maximum acceptable temperature rise based on an average ambient temperature (T∞) of 30 °C during any 24- hour period and a maximum ambient of 40 °C at any time.
Electrical insulation thermal breakdown occurs due to a chemical reaction [5] causing impurities to be generated in the material that unfavorably alter electrical properties that can initiate avalanche breakdown. Assuming a constant operating temperature and a first order chemical reaction, the half-life of electrical properties follows the equation:
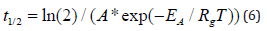
Where A [1/hr] is the reaction pre-exponential and EA is the activation of the first order chemical reaction rate, Rg is the universal gas constant and T is the absolute temperature.
As a result, it is clear that dielectric permittivity plays a key role in the performance of electrical insulation materials in highpower, high-voltage applications associated with the electrical grid. Electrical insulation materials have been studied at low frequency primarily due to the predominance of 50Hz power grid in Europe and 60Hz power grid in North America and parts of Asia. Moving to a future smart-grid will require high-frequency electrical insulation materials. Due to the high voltage associated with the grid, large temperature rises associated with transformer insulation materials makes data at elevated temperature necessary for the design of high-voltage, high-frequency power grid transformers.
Buchanan [6] gives a table for the general use of ceramic materials classified as good electrical insulators which can withstand high temperatures:
Dielectric Constant (ε`r)≤30 Dielectric loss Factor (ε”r)≤0.03 Dissipation Factor (tanδ=ε”r/ε`r)≤0.001 Electrical Conductivity (σ)≤10-10S/m Dielectric Strength ≥5MV/m Above are the desirable ranges of the dielectric constant, ε`r, and the dielectric loss factor (ε”r) which make up the complex function that is the dielectric permittivity, ε, as well as the electrical conductivity and dielectric strength. The dissipation factor is the ratio of the dielectric loss factor to the dielectric constant, tanδ=ε”r/ ε`r.This work provides temperature and frequency fits of dielectric permittivity and conductivity data for candidate materials for the electrical insulation materials for smart-grid transformer applications. This work considers that the dielectric permittivity is a complex function that follows the Kramers-Konig relations connecting the real and imaginary parts of the dielectric permittivity mathematically. Electrical conductivity is calculated from the imaginary part of the dielectric permittivity using equation (4) and compared to the Buchanan criterial. This work finally calculates the temperature rise due to the E field at various frequencies for candidate materials for the electrical insulation for smart-grid transformer applications.
Data Fitting
Ceramic materials
The DC conductivity of ceramic materials follows the small polaron theory [7]:
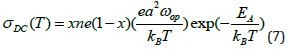
Where n is the cation concentration in the material, e is the charge on the electron, a is the distance between cation sites, ωop is the optical phonon frequency and x is the fraction of available sites occupied by small polarons. Typical values of the activation energy, EA, are a fraction of an electron volt which causes the DC conductivity to slowly increase with temperature. DC conductivity has been used to screen materials for usefulness as insulation materials at low frequency but AC conductivity is necessary to screen materials for use in transformers operating at high frequency.
An additional concern is the effect of electrical field, E, on the conductivity of ceramic materials. When the electric field is elevated as it is in the power grid, the conductivity increases according to the Poole-Frenkel effect [8] giving:
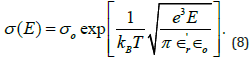
When the E field is 100V/cm, the conductivity increases by 19% for a dielectric constant (ε`r) of 3. Increasing the dielectric constant of the insulation, lowers the conductivity increase due to an elevated electric field. Many of the experimental results published in the literature have not corrected their conductivity measurements for the effect of an elevated electrical field nor for internal Joule heating during measurement.
SiO2
The AC conductivity for SiO2 grown by chemical vapor deposition from TEOS (Tetra Ethyl Orthosilicate) and subsequently annealed was measured by Kumar [9]. This work shows a high-temperature activation energy (EA) of 0.201eV at 50kHz and 0.116eV at 1MHz and at room temperature a power of frequency of 1.167 over a range of 42kHz to 2.5MHz as in the fit equation:
with some deviation on the value 1.167 observed at low frequencies. Higher temperature (110 °C to 550 °C) 50kHz conductivity measurements by Srivaastava, et al. [10] on thermally grown SiO2 show a 0.201eV activation energy at these high temperatures and 0.015eV activation energy at lower temperatures, see Figure 1, as well as a power of the frequency that is temperature dependent. Both of these activation energies are of a similar magnitude to that due to the small polaron theory. In all these experimental results, the AC conductivity increases with temperature as shown in Figure 1.
Figure 1 SiO2 AC conductivity data plotted ln(σ[S/m]) vs 1/T[K]. Data from Srivaastava et al. [10].

Permittivity data on thermally grown SiO2 by Srivaastava, et al. [10] are given in Figure 2. This data and that at other temperatures is well fit by the Debye dipole relaxation equation [11]:
Figure 2 Permittivity vs frequency for SiO2 for a) 275°K and b) 300°K. Data from Srivaastava et al. [10] Fit lines use debye dipole relaxation equation with data from Table 2. The resulting debye dipole relaxation equation fit gives: νo=12.210kHz, ωo[r/s]=2πνo[Hz] εro=exp[-1611°K/T+8.50] + exp[-68.457°K/T+1.844] and εroo=1.432.

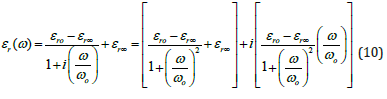
where εro is the low frequency relative permittivity, εr∞ is the high frequency relative permittivity, ωo is the dipole resonate frequency in radians per second and i is the imaginary number, √(- 1). The core mathematics of the Debye dipole relaxation equation is Kramers-Konig compliant - a situation where the real and imaginary parts of are not independent but specifically related to one another mathematically. When using equation 11 for fitting, all constants, εro, εr∞, and ωo=2πνo, were assumed to be unknown. Data fitting of a complex function is not straight forward due to real and imaginary parts as a result a custom method was developed [12]. Looking at the fit results for SiO2 at various high temperatures (Figure 2 & Table 2), we find that the values of νo and εr∞ are reasonably constant with temperature and have the values ~12.2kHz and ~1.5 respectively while the fit values of εro as a function of temperature shows an Arrhenius form with two activation energies, see Figure 3, showing a low-temperature activation energy of 0.0056eV and a hightemperature activation energy of 0.13eV with pre-exponentials of 4,913 and 6.324, respectively.
Figure 3 Arrhenius fit of temperature dependent ro ε values obtained from Debye dipole relaxation fits of data for SiO2 by Srivaastava, et al. [10] the line corresponds to an Arrhenius fit of the data with two exponential activation energy terms, i.e., εro=exp[-1611°K/T+8.50] + exp[-68.457°K/T+1.844].

Table 2: Debye dipole relaxation fit of SiO2 data from Srivastava, et al. [10].

Al2O3
DC conductivity of polycrystalline α-Al2O3 as a function of temperature has been measured by von Hipple [13] and shows an activation energy of 1.1eV. Similar high quality Debye dipole relaxation, equation (10), fits of the von Hipple dielectric permittivity data for α-Al2O3 (Figure 4 & Table 3) show nearly constant values of the resonant frequency, νo, at ~190Hz, and a high frequency relative permittivity, εr∞, of 10.4 to 10.7 with a low frequency relative permittivity, εro, that shows a double Arrhenius form with activation energies of 0.357eV and 0.02eV, see Figure 5. The fit data in Table 3 for 500 °C does not adhere to these (νo and εr∞) generalizations, however. Frequency and temperature dependent AC conductivity can be inferred from equation (4), σ(ω,T)=ω ε”r(ω,T) εo, because the conductivity data is not available in the literature. A plot of the AC conductivity versus frequency calculated in this way is shown in Figure 6; [14]. The AC conductivity increases with frequency to a plateau that increases with temperature. The plateau occurs above the resonant frequency, νo, which is higher for Al2O3 than for SiO2.
Figure 4 Permittivity vs Frequency for Al2O3 at a) 673°K and b) 773°K. Data from von Hipple, Alcoa Technical Report 19 [13]. Fit lines use data from Table 3. The Debye dipole relaxation equation fit gives: νo=190Hz, ωo[r/s]=2πνo[Hz] εsroexp[-4137°K/T+11.258] + exp[-232.997°K/T+3.108] and εroo=10.4.

Figure 5 Arrhenius fit of temperature dependent values obtained from Debye dipole relaxation fits of von Hipple α-Al2O3 data taken from Alcoa Technical Report 19 [13]. Fit equation is εro=exp[-4137°K/T+11.258]+exp[-232.997°K/ T+3.108] for the dashed green line, Blue fit line of high temperature data corresponds to the first exponential term.

Figure 6 Al2O3 AC conductivity vs frequency at various temperatures using the imaginary part of the dielectric permittivity from dipole relaxation fit of von hipple data [14] and equation (4).

Table 3: Debye dipole relaxation fit for high-temperature α-Al2O3. Data from von Hipple, Alcoa Technical Report 19 [13].

High temperature polymers
Flexible electric insulation material in a transformer is necessary to electrically insulate the wires that are wound into the coils. Polymers that have good electrical properties and high temperature stability are desired. Most polymers have thermal decomposition temperatures either in air or in inert gas that fall below 400 °C. There are but a few polymers that have thermal decomposition temperature at or above 400 °C including poly imide (PI) and poly dimethyl siloxane (PDMS) and poly methyl phenyl siloxane (PMPS), poly benzimidazole (PBI), poly (p-xylene) (PpX) and poly (p-phenylene) (PpP). Properties of these polymers are shown in Table 4. It should be noted that PpP is difficult to process. High temperature resistant polymers are an active field of research and development [14]. PBI was only recently commercialized for example. A successful research direction is to incorporate aromatic groups into the polymer backbone to achieve thermal stability. Due to their recent development only one of these polymers, Poly Imide, has datasheets with temperature and frequency dependent electrical properties. Measurements on other high temperature polymers are of interest to assess suitability for high-frequency transformer applications.
Table 4: High temperature polymer - electrical properties at room temperature.

Another mechanical property of interest is the glass transition temperature of the polymer. The glass transition temperature is the temperature below which an amorphous polymer takes on a glassy, brittle state and above which the structure turns rubbery. In some cases, electrical insulation materials need to be flexible which would suggest that they should have a glass transition temperature below the transformer fabrication temperature and in other cases a rigid insulation material is needed in operation which would suggest that they should have a glass transition temperature above the operating temperature.
Poly imide
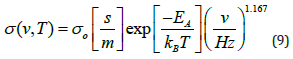
The conductivity of polymeric materials in general has been shown to be a power law function of frequency and an Arrhenius function of temperature. The AC electrical properties of poly imide films have been measured by Deligoz, et al. [17] from 0.2 to 100kHz and 294 to 448K. The conductivity can be shown to be a function of frequency, ω, and temperature, T, following the equation:
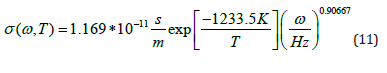
which corresponds to an activation energy of 0.106eV and power on the frequency of 0.90667. This fit of the conductivity data is shown in Figure 7 with the lines representing equation (11). It should be noted that the conductivity increases as temperature and frequency increase.
Figure 7 Poly imide conductivity vs frequency at various temperatures. Lines from equation (11). Temperatures range from 294 to 448°K.

The real and imaginary parts of the dielectric permittivity for poly imide were also measured by Deligoz, et al. [17] showing temperature and frequency dependences. The real part of the dielectric permittivity showed a very narrow range of variability with both temperature and frequency varying from 3.04 to 3.2, Figure 8. The frequency dependence of the imaginary part of the dielectric permittivity follows a power law expected by equation (11) and equation (4). The ratio of the imaginary part to the real part of the dielectric permittivity is equal to tanδ. From Figure 8, tanδ ranges from 0.007 to 0.014 which is larger than that (tan δ<0.005) desired in 2019 US DoE Office of Electricity’s Transformer and Resilience and Advanced Components Program [1]. The relative permittivity data for poly imide from Deligoz, et al. [17] is shown in Figure 8. The fit function in equation (11) does not satisfy Kramers-Konig relationships. Attempts to fit this poly imide data using the Cole [18], Davidson [19], Havriliak [20] and Dissaldo [20,21], equations were not successful. Attempts to fit the poly imide dielectric permittivity data with the Debye dipole relaxation equation were also not successful. The Debye dipole relaxation equation gives a much narrower region where the real part of the dielectric permittivity changes compared to the data. As a result, a modified Debye dipole relaxation equation:
Figure 8 Poly imide relative dielectric permittivity vs frequency at various temperatures. Real Part + data points, Imaginary Part x data points. Lines from a temperature and frequency dependent fit using an equation of the form, εr=f(T)+g(T)log(ω) where f(T) and g(T) are 2nd order polynomials for both the real and imaginary parts of the dielectric permittivity. Temperatures range from 294 to 448°K.


where β=0.2 was used to fit the poly imide dielectric permittivity data. The results of several of these fits are shown in Figure 9. The resulting fit coefficients are shown in Table 5. This data shows that ωo[=2πνo], εs, and εoo are functions of temperature. The low and high frequency dielectric permittivities, εs, and εoo, show double Arrhenius temperature dependence as shown in Figure 10 and the resonant frequency, ωo[=2πνo], shows a complicated temperature dependanceas given by the equation in the legend of Figure 9.
Figure 9 Poly Imide Relative Dielectric Permittivity vs Frequency at various temperatures. Fit lines use odified Debye dipole relaxation equation with νo[Hz]=exp[-4.0*10^6°K2/T^2+19291°K/T+18.243], ωo[r/s]=2πνo[Hz] εro=exp[-96.385°K/T+1.3805] and εroo=exp[-75.856°K/T+1.3048].

Figure 10 Natural logarithm of low (• εro) and high (• εroo) frequency permittivity values vs 1/T with Arrhenius fits.

Table 5: Poly imide fit coefficients for modified debye dipole relaxation equation.

Discussion
The dielectric constant for the materials discussed in this work are typically less than 30 meeting one of the Buchannan criteria for good electrical insulation materials. The dielectric strength of these materials also exceeds the Buchannan criteria. The Buchanan criterion of dielectric loss and conductivity, however, are not met by SiO2 at all frequencies where measurement is available. The electrical conductivity is met by Al2O3 at very, very low frequencies only and at low temperature and is met by poly imide at frequencies less than 1kHz and lower temperatures. At high frequency (10 to 100kHz) of interest for this new transformer, all materials, SiO2, Al2O3 and Poly Imide do not meet the Buchanan electrical conductivity criterion, a situation that is made worse at higher temperatures.
To investigate the critical role that AC conductivity plays in Joule heating, the temperature rise from equation (5) is calculated using the conductivity given in equation (4) and the imaginary part of the dielectric permittivity for the materials evaluated in this work and summarized in Table 6 as a function of both frequency and temperature. In addition, the Poole-Frenkel effect, equation (8), is used to correct the electrical conductivity for the high electric field experienced by the insulation material between the coils and grounded transformer core and between the primary and secondary coils wound one on top of the other with an interlayer of insulation. For this analysis, we will make the assumption that the ambient temperature, Too, is 30 °C, the outer diameter of the cylindrical coil is 50cm allowing V/A to be calculated in equation (5) and that the heat transfer coefficient is assumed to be 1W/m2/K and 5W/m2/K at the exterior of the coil corresponding to natural convection in air and oil respectively. The natural convection values of the heat transfer coefficients were determined using an approximation by setting the Nusselt number, Nu=hD/kfluid, equal to 2 where h is the heat transfer coefficient, D is the diameter of the coil and kfluid is the fluid thermal conductivity. Since the coil is copper coated with a polymer, the thermal conductivity of the coil itself is large compared to that of both the electrical insulation layer and the convective heat transfer at the exterior of the coil. The results of these calculations are shown in Figure 11. To generate these plots at a given frequency, a thermal rise is selected from which the insulation temperature is calculated allowing the electrical conductivity to be calculated. With the electrical conductivity and equation (5), the E field that will give this thermal rise at a given frequency is calculated. The resulting E field has various behaviors with thermal rise depending upon the insulation material, however, in all cases decreasing the frequency increases the E field at a given temperature rise. Increasing the fluid heat transfer coefficient from 1 to 5W/m2/K gives higher E fields in all cases.
Figure 11 Insulation E field for a given thermal rise at different frequencies.

Table 6: Summary of fit equations for dielectric permittivity 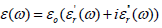 using the generalized equation:
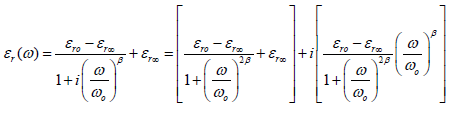

For all thermal rises the 10kHz and 100kHz traces in Figure 11 give E fields are <106V/m [=1kV/mm] and for SiO2<105V/m [=0.1kV/mm]. Since the insulation must insulate against both the shorting of the line voltage to ground and shorting between coils, the voltage difference is 100’s of kV in both cases making the insulation 100’s of mm thick and 1000’s of mm thick in the case of SiO2. Electrical insulation thicknesses in a traditional transformer are significantly less than this value as they are based upon the dielectric strength (or breakdown voltage) of these materials with values >107V/m [=10kV/mm].
Due to Joule heating effects, the electrical insulation needs to be 100’s of mm thick according to Figure 11. This would give a very large transformer as the coil consists of insulation in the form of a bobbin insulating against the grounded core, coil 1, an interlayer of insulation, coil 2 and insulation in the form of a bobbin cover so a total of 4 times 100’s of mm (plus the bobbin cover) given the cylindrical structure of the interleaved winding or >40cm not accounting for the two coils. For the insulation alone, this diameter is nearly as large as the assumed diameter - 50cm in this calculation and would exceed it when the two coils are considered. Therefore, the implications of these high-frequency, high-temperature permittivity fitting results for the electrical insulation materials are that none of these materials, neither SiO2, Al2O3 or Poly Imide, has a chance to survive due to Joule heating effects as a material of construction for the electrical insulation in this smart-grid power transformer of the future operating at 10kHz to 100kHz. This smart-grid transformer of the future will need to be redesigned as a result. For example, a much larger transformer window may be designed to accommodate the larger composite coil. In addition, if lower frequencies could be used these materials may be used with this design. Or if the transformer is redesigned so that the two coils are separated on individual legs of the core so that they require only one layer of insulation, the bobbin, to insulate the coil from the grounded core may be used but giving a transformer design that is less energy efficient.
Conclusion
Fits of the AC conductivity and dielectric permittivity as a function of temperature and frequency have been developed for SiO2, Al2O3, poly imide (Table 6 for a summary). Using Buchanan’s criterion for high temperature electrical insulation, especially the criterion for the electrical conductivity, none of these materials is particularly well suited for the electrical insulation material needed for future smart-grid transformers operation at 10 to 100kHz and elevated temperatures, >220 °C. E field at a given thermal rise calculations confirm the inadequacies of these electrical insulation materials for this application. Thus, an important criterion for the selection of electrical insulation materials for high frequency transformers needs to include Joule heating effects and not just dielectric strength. As a result, more work is needed either on the synthesis and characterization of high temperature polymers and polymer/ceramic composites for application in high-frequency, high-power smart-grid transformers or on the transformer design itself.
Author’s Contributions
All authors contributed equally to this work.
Data Availability
The data that supports the findings of this study are available within the article [and its supplementary material].
Acknowledgement
This work has been supported by the US Department of Energy’s Office of Electricity Delivery and Energy Reliability (DOEOE) Transformer Resilience and Advanced Components (TRAC) program under contract number DE-AC07-05ID14517.
Appendix
Thermal properties of materials
Table A1: Coefficients for the Shomate Equation for Heat Capacity in Units of J/mole/K: Cp(T)=A+B*(T/1000)+C*(T/100 0)2+D*(T/1000)3+E*(T/1000)-2 Data from NIST Chemistry Webbook see https://webbook.nist.gov/chemistry/.

**The units for heat capacity of Poly Imide and Mineral Oil are J/gm/K as the molecular weight of a polymer/oil is often not well characterized.
Table A2: Thermal conductivity fit for materials using polynomial fit coefficients for the equation 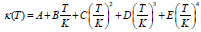 with units of W/m/K.

References
- Kerry Cheung (2019) Transformer resilience and advanced components program – program overview and project fact sheets. US DoE Office of Electricity, Oak Ridge National Laboratory, Tennessee, USA.
- https://www.engineeringworldchannel.com/transformer-failure/
- Gersten JI, Smith FW (2001) The physics and chemistry of materials. John Wiley & Sons, New York, USA, p. 234.
- https://www.ti.com/lit/ml/slup126/slup126.pdf
- Shimizu O (1985) Temperature classes of electrical insulators.
- Buchanan Relva C (Ed.), (2019) Ceramic materials for electronics, (3rd edn), CRC Press, USA.
- Robert R Heikes, Roland W Ure (1961) Thermoelectricity: Science and Engineering. Interscience Publishers, New York, USA.
- Gersten JI, Smith FW (2001) The physics and chemistry of materials. John Wiley & Sons, New York, USA, p.219.
- Kumar N, Chand S (2020) Effects of temperature, bias and frequency on the dielectric properties and electrical conductivity of Ni/SiO2/p-Si/A/ MIS Schottky diodes. Journal of Alloys and Compounds 817.
- Srivastava JK, Prasad M, Wagner JB (1985) Electrical conductivity of silicon dioxide thermally grown on silicon. J Electrochemical Soc 132(4): 955-963.
- https://www.tf.uni-kiel.de/matwis/amat/elmat_en/kap_3/backbone/r3_3_2.html
- The fit function was created from the sum of the analytical real and imaginary parts of the Debye dipole relaxation equation. To account for major differences in the values of the real and imaginary parts of the dielectric permittivity data, the smaller, imaginary part, was multiplied by a weight factor to make the data roughly equal. The fit function was fit with a Levenberg-Marquardt algorithm with partial derivatives supplied. Gavin HP (2020) The levenberg-marquardt algorithm for non-linear least squares curve-fitting problems.
- Wefers K, Misra C (1987) Oxides and hydroxides of aluminum.
- https://pdfs.semanticscholar.org/d3fa/4a1616fd1457c02d4f477dcbdae706c9667f.pdf
- Dahai Gao, Mengqiu Jia (2013) Synthesis of poly(methylphenylsiloxane)/phenylene‐silica hybrid material with interpenetrating networks and its performance as thermal resistant coating. J Applied Polymer Science 128(6): 3619-3630.
- Suthar JL, Laghari JR, Khechan W (1991) Poly-P-Xylene Film for high temperature high voltage dielectric applications. Conference on Electrical Insulation and Dielectric Phenomena, Knoxville, TN, USA, IEEE, pp: 244-249.
- Deligoz H, Ozgumus S, Yalcinyuva T, Yildirim S, Deger D et al. (2005) A novel cross-linked polyimide film: synthesis and dielectric properties. Polymer 46(11): 3720-3729.
- Cole KS, Cole RH (1941) Dispersion and absorption in dielectrics I. Alternating current characteristics. The Journal of Chemical Physics 9(4): 341-351.
- Davidson DW, Cole RH (1951) Dielectric relaxation in glycerol, propylene glycol, and n-propanol. The Journal of Chemical Physics 19(12): 1484-1490.
- Havriliak S, Negami S (1966) A complex plane analysis of α-dispersions in some polymer systems. Journal of Polymer Science Part C: Polymer Symposia 14(1): 99-117.
- Dissado LA, Hill RM (1983) A cluster approach to the structure of imperfect materials and their relaxation spectroscopy. Proceedings of the Royal Society A: Mathematical, Physical and Engineering Sciences 390(1798): 131-180.
- Dissado LA, Hill RM (1984) Anomalous low-frequency dispersion-Near direct current conductivity in disordered low-dimensional materials. Journal of the Chemical Society, Faraday Transactions 2: Molecular and Chemical Physics 80(3): 291-319.
- https://www.engineeringtoolbox.com/specific-heat-fluids-d_151.html
- http://aries.ucsd.edu/LIB/PROPS/PANOS/al2o3.html
- Ho CY, Powell RW, Liley PE (1972) Thermal conductivity of the elements. J Phys Chem Ref 1: 279-421.
- http://aries.ucsd.edu/LIB/PROPS/PANOS/dscu.html
- http://aries.ucsd.edu/LIB/PROPS/PANOS/fs.html
- https://www.dupont.com/content/dam/dupont/amer/us/en/safety/public/documents/en/DPT16_21668_Nomex_410_Tech_Data_Sheet_me03_REFERENCE.pdf
- Dong X, Liangping S, Hanbin W (2019) Investigation on the thermal conductivity of mineral oil-based alumina/aluminum nitride nanofluids. Materials (Basel) 12(24): 4217.
© 2021 Terry A Ring. This is an open access article distributed under the terms of the Creative Commons Attribution License , which permits unrestricted use, distribution, and build upon your work non-commercially.
Editor In Chief


.jpg)


Signup for Newsletter

Quick Links
 Editorial Board Registrations
 Submit your Article
 Refer a Friend
 Advertise With Us
Our Recent Edition

.jpg)


Top Editors


.jpg)


.bmp)
.jpg)
.png)
.jpg)


.jpg)


.png)

.png)


.png)


Financial Support

Sponsors

Latest e-Books

Latest Video

 a Creative Commons Attribution 4.0 International License. Based on a work at www.crimsonpublishers.com.
Best viewed in
a Creative Commons Attribution 4.0 International License. Based on a work at www.crimsonpublishers.com.
Best viewed in