- Submissions

Full Text
Research & Development in Material Science
Colloidal Microwave Absorber based on Magnetic Fluid of Iron Oxide Nanoparticles
Pourush Sharma, Ajendra Mani Tripathi, Rajesh Shukla and Anuj Shukla*
Defence Laboratory, India
*Corresponding author: Anuj Shukla, Defence Laboratory, India
Submission: May 13, 2021;Published: June 01, 2021

ISSN: 2576-8840 Volume 15 Issue 2
Abstract
Magnetic nanofluid was prepared by dispersing iron oxide nanoparticles in aqueous medium. Water dispersible iron oxide nanoparticles were synthesized by solvothermal decomposition of iron (III) acetylacetonate [Fe(AcAc)3] in Polyethylene Glycol 400 [PEG] and Polyacrylic Acid (PAA). Crystal structure was investigated using X-ray Diffraction (XRD) and magnetic properties were measured by using Vibrating Sample Magnetometer (VSM). Further, the XRD and VSM data were successfully used to retrieve the crystallite size and size distribution from powder samples. Particle size and size distribution extracted from magnetization curve have been found to be consistent with XRD and AFM. Microwave absorption of magnetic nanofluid can be controlled through changes in volume fraction of nanoparticle in dielectric aqueous fluid. Microwave absorbing properties of iron oxide nanoparticles are evaluated and presented here. Reported approach is a first step toward the development of switchable absorbers to operate reversibly between different states (absorption in presence of magnetic fluid or transmission in absence of magnetic fluid) by movement of magnetic fluid under external magnetic field in air or in non-dispersive carrier liquid.
Keywords: Colloidal microwave absorber; Magnetic nanofluid; Iron oxide nanoparticles
Introduction
Electromagnetic (EM) absorption is a widely investigated phenomenon across research fields, owing to its manifold applications, such as EM compatibility, EM interference, stealth, imaging devices, and wireless communication. The majority of microwave absorbing systems, including Salisbury screens, Jaumann absorbers, radar absorbing paints, and particle loaded polymeric layers, are passive in nature, which perform single functionality without repeated fabrication. With the growing demand in the EM spectrum, active absorber capable of exhibiting dynamic behaviours have been extensively pursued through controlling the external stimuli, offer multifunctional characteristics to mitigate the issues above [1-3]. Bregar’s theoretical efforts [4] indicate that the microwave reflectivity of ferromagnetic nanoparticle composites can be tuned through changes in particulate volume fraction, composition, and size, or through changes in the dielectric constant of the matrix material. The motivation of this is to develop switchable microwave absorber, enabling microwave absorbing control by applying external magnetic field. Magnetic fluid is stable dispersion of ferro/ferrimagnetic nanoparticles in nonmagnetic liquid carrier.
Magnetic fluid is a smart material that responds to external magnetic field along. Magnetic fluids have a large number of technological applications in various fields [5-8]. Core of magnetic fluids is magnetic nanoparticles, which have been of scientific and technological interest in last few decades. Their magnetic properties change drastically with the sizes as magnetic anisotropic energy, KV, where K is the magnetic anisotropic constant and V is the particle volume, becomes comparable to the thermal energy, resulting in magnetic moment randomization and super paramagnetism. Numerous schemes have been devised to synthesize magnetite nanoparticles. However, some important material problems viz. polydispersity and agglomeration need to be solved before magnetic nanoparticles can be utilized for magnetic fluid applications.
The conventional co-precipitation procedure of Fe (II) and Fe (III) salts by a base has been extensively used for making magnetite nanoparticles for mass production [9]. However, during these reactions, several parameters have to be controlled carefully, including pH value, nature and concentration of anions, mixing process of raw materials, temperature. An alternative method of synthesizing magnetite nanoparticles with tunable size and narrow size distribution is thermal decomposition of iron (III) acetylacetonate [Fe(AcAc)3] [10-12]. The reactions were carried out in organic solvents, such as octyl ether [13], phenol ether and benzyl ether [13] in the presence of organic compounds containing reactive functional groups, such as Polyvinylpyrrolidone (PVP) [13], oleic acid, oleyl amine and 1,2-hexadecane diol [14]. Nanoparticles presented in these reports were dispersible in a variety of organic solvents but not in water, and this limited their use in water based magnetic fluid. One-pot reaction were utilized to obtain water dispersible magnetite nanoparticles by thermal decomposition of Fe(AcAc)3 in the presence of water-soluble poly(ethylene glycol) of molecular weight Mw=400 (PEG), and poly acrylic acid of molecular weight 2000 (PAA2000). XRD and VSM data were utilized not only to find the phase and magnetic properties of the iron oxide nanoparticles but also to retrieve the size dispersion of the nanoparticles by using in-house written MATLAB based code. Magnetic fluid using synthesized water dispersible magnetite were prepared. Microwave absorption response can be switched between absorption and transmission by movement of magnetic fluid under external magnetic field in air or in non-dispersive solvent.
Experimental Details
Synthesis of magnetite
All chemicals are of analytical grade and used as received. The reaction apparatus consisting of a 250ml two-neck round-bottom flask equipped with a mechanical stirrer having a tight adapter and condenser. 5gm Fe(AcAc)3 and 1gm PAA2000 were dissolved in 100ml PEG400. The mixture was heated to 270 °C and refluxed for 60min to yield a black suspension, indicating the formation of magnetite nanoparticles. After cooling, the colloidal dispersion was centrifuged to isolate nanoparticles and the supernatant was discarded. Then precipitates were washed several times with distilled water. Thoroughly washed magnetic particles were dried at room temperature, yielding a fine powder.
Characterization
The structural characterization of the samples was carried out by the powder X-ray diffraction method performed on a Philips X’Pert Pro-system using CuKα1 (λ=0.154nm) radiation. The magnetic properties of the samples were studied using an ADE model EV-5 vibrating sample magnetometer. The magnetic measurements were first carried out on the sample together with the sample holder and then repeated on sample holder after removing the sample. To obtain the true magnetization value of the sample, magnetic data of bare sample holder was subtracted from the measured data of sample and sample holder combination. Further, to represent magnetization values in emu/g, weights of samples were taken. The synthesized magnetic nanoparticles were characterized by using NT-MDT Solver TS 150, Atomic Force Microscopy (AFM) in semi-contact mode. For AFM studies, fine power is redisposed in water by ultra-sonication for 15 minutes and sprayed on polished mica substrate. IR spectra of solid colloids were recorded in KBr using Shimadzu 8101A FTIR spectrometer. Vector Network Analyzer (R&S ZVM Model) was used to perform transmission and reflection measurements on samples of magnetite nanoparticles in the 8-12GHz range at room temperature. The values of complex permittivity and permeability of the composite materials were calculated from measured values of S-parameters using Nicolson-Ross algorithm.
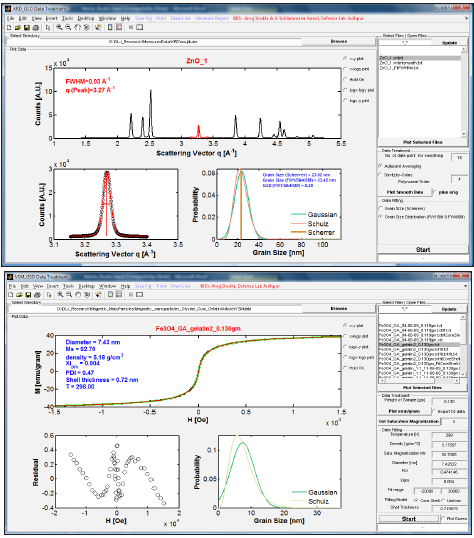
In our simple MATLAB based code, database management and data fitting methods have been integrated with GUI (graphical user interfaces). Compiled MATLAB based software package as standalone C executable can be run in windows-based operating system without MATLAB. The layout of the main program screen is shown in Figure 1. The GUI has been mainly divided into five panels. First & second panels (“Select Directory” & “Select File | Open Files”) are used to select the data from a directory which are to be treated or fitted, third panel (“Data Treatment”) deals with the data treatment, fourth panel (“Data Fitting”) deals with data fitting and in the fifth panel (“Plot Data”), all concerned data can be viewed.
Using this interface, the various fitting parameters can be set in a user-friendly way. When all the parameters are confirmed, press the button marked “Start” in “Data Fitting” panel, the fitting program will start and save the result when it is ended. Fitting termination is controlled by maximum 108 numbers of allowed function evaluations or maximum 1000 number of allowed iterations or 10-8 termination tolerance on the function value. Every graph can be printed or saved in a text format importable to spreadsheet and graphics programs. Multiple plots with different line colors can be overlaid. Figure 1A, shows the GUI to retrieve the crystallite size and size distribution by fitting Pearson VII function to XRD diffraction peaks. In Data Fitting panel of the main interface, there are two radio buttons, the Grain size (Scherrer) and Grain Size Distribution (FW1/5 & FW4/5M) are in charge to calculate either average crystallite size using Scherrer equation or calculate both crystallite size and size distribution using FW1/5 & FW4/5M method [15].
Initial guess parameters to fit the diffraction peak can be set in a user-friendly way by clicking the graph at three positions: first click set the guess value for base line and from which point to fit, second click will set the guess value for peak position and third click will set till which point to fit. All fitted results are also shown in plot data panel. Figure 1B, shows the GUI to retrieve the crystallite size and size distribution by fitting VSM data. Initial guess parameters to fit the VSM data can be set in a user-friendly way by parameter menu in Fitting Data panel. There are two radio buttons to choose either magnetic core and non-magnetic shell model or uniform model to fit the VSM data. Magnetic size, nonmagnetic shell thickness and size distribution after fitting can be obtained by just clicking the ‘Start’ button. All fitted results are also shown in Plot Data panel.
Figure 1: Graphical user interface to retrieve the size dispersion from (A) XRD data [XRD_GSD] (B) VSM data [VSM_GSD].
Results and Discussion
Fe3O4 nanoparticles were synthesized by the thermal decomposition method. One-pot reaction of Fe(AcAc)3 in presence of PAA at high temperature leads to water dispersible Fe3O4 nanoparticles. Herein, we report a facile synthetic approach of water dispersible magnetite nanoparticles in hydrophilic polymers such as PEG and PAA. PEG was selected as the reaction solvent due to its high boiling point (298 °C), so that it can facilitate the decomposition of Fe(AcAc)3 below its boiling point.
Figure 2 shows a comparison between the FTIR spectrum of synthesized magnetic nanoparticles, pure PEG and PAA. The formation of Fe3O4 nanoparticles is established by the presence of characteristic absorption band of the Fe-O of Fe3O4 nanoparticles at ~ 580 and 434cm-1 as shown in Figure 2A. The strong band at ca. 1710cm-1 as shown in FTIR spectrum of PAA (Figure 2B) is attributed to stretching of the carbonyl bonds (C=O) in carboxyl groups appear on every acrylic acid monomer unit and the bands at ca. 1400-1450cm-1 are attributed to the stretch of C-O and the deformation vibration of OH. In comparison to FTIR spectrum of PAA (Figure 2B), the FTIR spectrum of the synthesized nanoparticles Figure 2A shows that the peak at 1710cm-1 shrank and two new bands at ca. 1559 and 1415cm-1 are appeared due to the binding of the carboxylic acid groups to the surface of the nanoparticles to form carboxylate groups.
These spectroscopic changes support that the carboxylic acid groups from PAA is covalently bound to the particle surface. As shown in Figure 2C, the main peaks of functional groups present in PEG have been observed at 3480cm-1 (-OH stretching), 2885cm- 1 (C-H stretch) and 1110cm-1 (C-O-C stretching) in FTIR spectrum of PEG. All these bands were present in the spectrum of the synthesized nanoparticles (Figure 2A & 2C) too. It should be noted that non-coordinated species have been removed before FTIR analyses. Further, it is observed that intensity band attributed to -OH stretching for synthesized magnetic nanoparticles were shifted to lower frequency (3421cm-1) than for PEG (3480cm-1). These observations suggested there was an interaction between the PEG and synthesized magnetite nanoparticles. Thus, FTIR studies confirm the formation of Fe3O4 particles and attachment of both polymers, PAA and PEG onto the Fe3O4 nanoparticles surface.
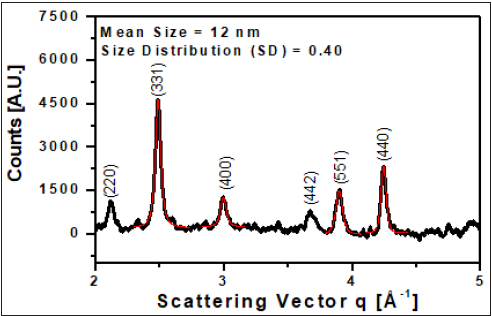
Synthesized Fe3O4 particles were further characterized by powder X-ray Diffraction (XRD) and Vibrating Sample Magnetometer (VSM). Figure 3 shows the XRD pattern of Fe3O4 nanoparticles. XRD data were analyzed as a function of scattering vector q=(4π/λ) sin(θ), where 2θ is the scattering angle and λ is the wavelength of X-ray. An XRD pattern (Figure 3) of the synthesized nanoparticles can be indexed to the lattice plane 220, 331, 400, 442, 511, and 440 of face-centered cubic spinel structure of pure Fe3O4, which are also very close to the reported value for Fe3O4 (JCPDS 65- 3107). The broadening of these diffraction peaks indicated that the sample was composed of nanosized particles.
Figure 2: FTIR spectra of (A) coated Fe3O4 nanoparticles with PAA/PEG (B) pure PAA (C) pure PEG 400. Photographs of synthesized magnetic nanoparticles dispersed in water and PEG400 with and without magnetic field.

Figure 3: X-ray powder diffraction pattern of the synthesized magnetic particles.
From the same XRD pattern, analyzing the broadning of the
peaks, one can extract the mean size of the crystallite and their
dispersion. As discussed under section 3 “Software Package”, an
inhouse developed MATLAB-based software has been used to
extract the crystallite size and size distribution based on full width
at 1/5 maxima and full width at 4/5 maxima (FW1/5&4/5M)
method (Figure 1A). A detailed description and justification of
the FW1/5&4/5M method can be found elsewhere [11]. The basic
concept to retrieve the mean crystallite size and their dispersion
from shape of peak (FW1/5 & 4/5 Method) is the following. In
the case of crystalline powders containing grains of the same size,
there exists a simple relation between the FWHM of the diffraction
peaks and the grain size, D, described by the Scherrer equation.
In the more realistic case of a polydisperse powder, which can be
characterized by two parameters - mean size D and size distribution
 the FWHM is a more complex function. The method we use
here is based on the assumption that grain sizes obey a Schulz
size distribution, which is both physically realistic as well as
mathematically tractable. We have chosen a popular Pearson VII
function to fit four diffraction peaks of synthesized nanoparticles
(Figure 3). In analysis of XRD peaks, it has been assumed that peak
broadening occurs primarily due to the small size of the particles.
This assumption has been validated by comparing the FWHM of
the 220, 331, 400, 511, and 440 peaks, which are very similar, thus
suggesting peak broadening occurs primarily due to the small size
of the particles. Reflections 331, 400, 551 and 440 were selected
for analysis, because each of them is sufficiently separated from
all others. The results of the least-squares fit were used to find
the width of the peaks at 1/5 and 4/5 of the full maximum and to
calculate the corresponding values of D and SD (Figure 1A). Red
line in Figure 3 is the peak fit to get the peak positions and FW1/5
& 4/5M. The average crystallite sizes are found to be nearly 12nm
and size distribution ~ 0.4.
Figure 4 gives the magnetization curve measured at room temperature (298K) for synthesized Fe3O4 nanoparticles. It can be seen that the magnetization curve shows no hysteresis. Neither coercivity nor remanence was observed. These observations reveal that the synthesized Fe3O4 nanoparticles have a single domain structure and are super paramagnetic. Further, mean size and size distribution are estimated from VSM data by fitting a magnetic core- nonmagnetic shell model based on the Langevin function [16] using in-house developed software package discussed in section 3. Magnetization curves and fitted data are shown in Figure 4. The optimum fitted parameters are also shown in Figure 4.
Figure 4: Magnetization curve of the Fe3O4 nanoparticles at room temperature (298K).

In agreement with the XRD results, diameter and size distributions of nanoparticles are 11.5nm (12.0nm from XRD) and (0.40 from XRD), respectively, estimated from the magnetization curve. Size distributions determined from XRD data and VSM data are also shown in Figure 5. Saturation magnetization Ms of synthesized nanoparticles is 20emu/g. Nonmagnetic shell thickness obtained from VSM data is 2.3nm. Nonmagnetic shell may be due to the formation of surface layer of disordered spin which do not contribute to saturation magnetization.
The AFM image of synthesized nanoparticles shows (Figure 6A) that the majority of the particles were spherical with mean size 12.6nm. The size of nanoparticles was estimated from the height of the particles. Figure 6B shows height profile of a cross section along the line indicated in Figure 6A. Mean height of nanoparticles (12.6nm) obtained from AFM are in agreement with those determined from XRD and VSM. Slightly higher value of mean size obtained from AFM than the mean size estimated by VSM and XRD evidencing that the synthesized magnetic nanoparticles were likely to be coated by an amorphous layer of PEG and PAA.
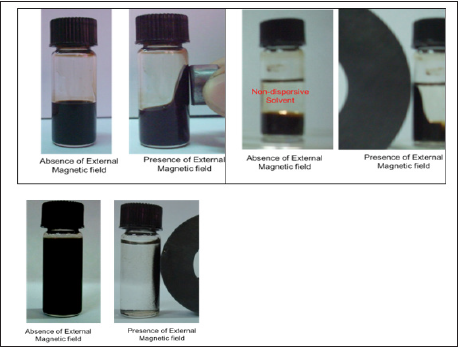
Magnetic fluid was prepared by the dispersion of synthesized magnetite nanoparticles into water or PEG. As shown in Figure 7, either whole fluid moves under magnetic field in air or in nondispersive solvent or magnetic particles can be separated from water by applying external magnetic field. These colloidal systems can be utilized as switchable microwave absorbers. Magnetic fluids in non-microwave absorbing container will absorb microwave due to presence magnetite nanoparticles and can be easily switched to non-absorbing or transmission state by either moving magnetic fluid or separating magnetic particles by applying external magnetic field.
Figure 5: Particle-size distribution determined from XRD and VSM data.
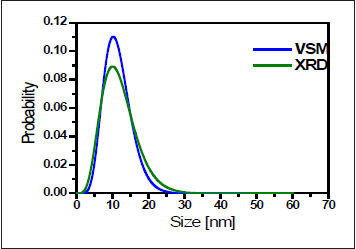
Figure 6: Coated magnetic nanoparticles (A) AFM image (the shaded bar is a measure of height); (B) A cross section along the line indicated in figure (A).
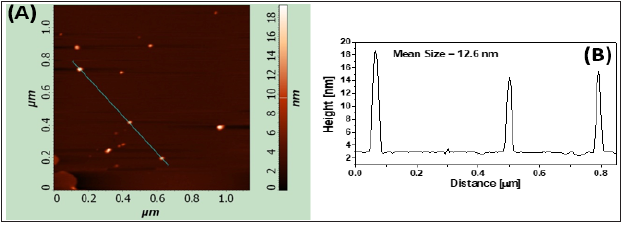
Figure 7: Photographs of colloidal Microwave Absorbers: (A) Movement of whole fluid in air under magnetic field (B) Movement of whole fluid in non-dispersive solvent under magnetic field (C) Separation of magnetic materials from carrier liquid.
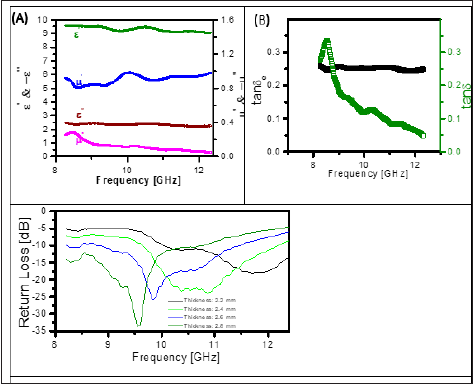
Microwave absorbing properties of magnetite nanoparticles which absorb incident microwave has been studied. According to the transmission line theory [17], when an electromagnetic wave transmits through a medium, its absorption is affected by many factors, such as permittivity, permeability, sample thickness, and the frequency of the electromagnetic wave. In order to better investigate the effects of these factors on the microwave absorption, the relative complex permittivity (εr=εr’- jεr’’) and permeability (μr=μr’ -jμr’’) of magnetite nanoparticles in the frequencies range of 8-12GHz were measured. As shown in Fig. 8A, the value of real part of permittivity and permeability are ~ 9.5 and ~ 1, respectively. The values of dielectric loss tangent (tanδE) and magnetic loss tangent (tanδM) which are commonly used to describe losses, are found to be 0.25 & 0.3 at 8GHz, respectively. Conduction loss due to electron hopping between ions of the same type on equivalent lattice sites, e.g., Fe3+ ↔ F e2+ contributes to the dielectric loss observed in magnetic nanoparticles. Magnetic loss is observed due to natural resonance frequency (Figure 8B).
To further investigate microwave absorption properties of the magnetic nanoparticles, the Reflection Loss (RL) curves were calculated using the complex permittivity and permeability at the given frequency and absorber thickness according to the transmit-line theory. Calculated reflection loss behavior of composites with varying thickness. As shown in Figure 8C, RL peak shifted to higher frequency with decreasing thickness from 2.8mm to 2.2mm. The effective RL can be tuned more than 10dB in the frequency range 8-12GHz with a thickness range 1.9- 2.5mm and the maximum RL of 35dB is observed at 9.5GHz with a matching thickness (dm) of 2.8mm.
Figure 8: Real part and Imaginary part of permittivity and permeability (B) Tangent losses.
Summary
Magnetic fluid was successfully prepared using magnetite nanoparticels and water as a carrier liquid. Magnetite nanoparticles were synthesized by thermal decomposition of Fe(AcAc)3 in polyethylene glycol solution phase in the presence of polyacrylic acid. FTIR confirmed the polymeric shell coating on Fe3O4 nanoparticle surface and thus enhanced their dispersibility as well as their stability in aqueous dispersions. The process for the preparation of coated Fe3O4 nanoparticles is quite facile and scalable. The average crystallite size is found to be nearly 12nm and size distribution 0.4. The average crystallites size and size distribution determined from XRD, VSM and AFM are in good agreement. Synthesized magnetic nanoparticles exhibits both dielectric as well as magnetic loss and good for microwave absorption application. Magnetic fluids can be used as switchable microwave absorbers by tuning their absorbing properties using external magnetic field.
References
- Xu HX, Tang S, Tong C, Guang W, Lei Z, et al. (2016) Multifunctional microstrip array combining a linear polarizer and focusing metasurface. IEEE Trans Antennas Propag 64: 3676-3682.
- Li H, Cao Q, Wang Y (2017) A novel 2-B multifunctional active frequency selective surface for LTE-2.1GHz. IEEE Trans Antennas Propag 65(6): 3084-3092.
- Yang H (2016) A programmable metasurface with dynamic polarization, scattering and focusing control. Scientific Rep 6: 35692.
- Bregar VB (2004) Advantages of ferromagnetic nanoparticle composites in microwave absorbers. Magnetics IEEE Transactions 40(3): 1679-1684.
- Mehta RV (2017) Synthesis of magnetic nanoparticles and their dispersions with special reference to applications in biomedicine and biotechnology. Mater Sci Eng C 79: 901-916.
- Liu T, Chen X, Di Z, Zhang J, Li X, et al. (2007) Tunable magneto-optical wavelength filter of long-period fiber grating with magnetic fluids. Appl Phys Lett 91(12): 121116.
- Chieh JJ, Yang SY, Horng HE, Hong CY, Yang HC (2007) Magnetic-fluid optical-fiber modulators via magnetic modulation. Appl Phys Lett 90(13): 133505.
- Philip J, Jaykumar T, Kalyanasundaram P, Raj B (2003) A tunable optical filter. Meas Sci Technol 14(8): 1289-1294.
- Sayar F, Guven G, Piskin E (2006) Magnetically loaded poly(methylmethacrylate-co-acrylic acid nano-particles). Colloid Polym Sci 284: 965-978
- Sun S, Zeng H (2002) Size-controlled synthesis of magnetite nanoparticles. J Am Chem Soc 124(28): 8204-8205.
- Pinna N, Grancharov S, Beato P, Bonville P, Antonietti M, et al. (2005) Magnetite nanocrystals: Nonaqueous synthesis, characterization, and solubility. Chem Mater 17(11): 3044-3049.
- Woodward RC, Heeris J, Pierre ST, Saunders TG, Gilbert M, et al. (2007) A comparison of method for the measurement of the particle-size distribution of magnetic nanoparticles. J Appl Cryst 40(S1): s495-s500.
- Liu HL, Ko SP, Wu JH, Jung MH, Min JH, et al. (2007) One-pot polyol synthesis of mnosize PVP-coated sub-5nm Fe3O4 nanoparticles for biomedical applications. J Magn Magn Mater 310: e815-e817.
- Sun S, Zeng H, Robinson DB, Raoux S, Rice PM, et al. (2004) Monodisperse MFe2O4 (M=Fe,Co,Mn) nanoparticles. J Am Chem Soc 126(1): 273-279.
- Pielaszek R (2004) FW1/5/4/5M method for determination of the grain size distribution from J. Alloys and Compounds 382: 128-132.
- Shukla MK, Patra M, Manoth S, Songara VK, Singh G, et al. (2010) Preparation and characterization of biocompatible and water-dispersible superparamagnetic iron oxide nanoparticles (SPIONs). Applied Science Letters 3: 1-7.
- Pillalamarri SK, Blum FD, Tokuhiro AT, Bertino MF (2005) One-pot synthesis of polyaniline-metal nanocomposites. Chem Mater 17(24): 5941.
© 2021 Anuj Shukla. This is an open access article distributed under the terms of the Creative Commons Attribution License , which permits unrestricted use, distribution, and build upon your work non-commercially.
 a Creative Commons Attribution 4.0 International License. Based on a work at www.crimsonpublishers.com.
Best viewed in


.jpg)


 Editorial Board Registrations
 Submit your Article
 Refer a Friend
 Advertise With Us
.jpg)


.jpg)


.bmp)
.jpg)
.png)
.jpg)


.png)

.png)


.png)


