- Submissions

Full Text
Research & Development in Material Science
The Influence of the Nanostructures on the Dye Adsorption in Dye Sensitized Solar Cell
Paula Maria da Silva*, Marilene Morelli Serna, Eguiberto Galego and Rubens Nunes Faria Jr
Center of Science and Materials Technology, Brazil
*Corresponding author: Paula Maria da Silva, Center of Science and Materials Technology, Brazil
Submission: May 11, 2021;Published: May 17, 2021

ISSN: 2576-8840 Volume 15 Issue 2
Abstract
In this work, ZnO nanostructures were synthesized by two distinct routes, which consisted in grow distinct morphologies on a seed layer by Chemical Bath Deposition method (CBD) using zinc acetate dihydrate, zinc chloride, zinc sulfate heptahydrate and zinc nitrate hexahydrate as precursor solutions and Ethylenediaminetetraacetic Acid (EDTA) and ammonium chloride as complex agents. The dye Eosin Y salt was adsorbed on the ZnO nanostructures using electrophoresis. The nanostructures were characterized by Scanning Electron Microscopy (SEM), X-ray Fluorescence (XRF) and X-ray Diffraction (XRD). The amount of dye adsorbed on the film surface was evaluated by UV-vis spectrophotometry. The nanostructure prepared from the ZnAc solution presented the higher concentration of dye.
Keywords: ZnO nanostructures; Eosin Y; DSSC; Electrophoresis
Introduction
The increasing energy demand has motivated the research for sustainable sources such as solar energy and dye sensitized solar cell is a promising device. This has motivated the research for renewable sources. Among the many ways of convert the sun light into electricity the Dye Sensitized Solar Cell (DSSC) is a promising alternative. This device is considered as one of the types of third-generation solar cells. The DSSC was developed in 1991 by Gratzel with an efficiency of conversion of 7,9% [1]. Nowadays, the DSSC prepared using TiO2 as photoanode has achieved the maximum efficiency of 13% [2]. The DSSC that used ZnO as photoanode achieved an efficiency of 8.28% [3,4]. Recent studies showed that the ZnO is a great candidate for use in these devices due to its characteristics. The ZnO is an interesting alternative due to its physics characteristics such as band gap of 3,7eV at room temperature and electron mobility of 200cm2×V-1×s-1. The ZnO presents a high electron mobility when compared to TiO2 (0,1-4cm2×V-1×s-1) [5]. The low efficiency of DSSC that uses ZnO sensitized with the ruthenium dyes as photoanode can be attributed to complex formation of ZnO with the dye [6].
The use of metal-free organic dyes is an attractive alternative, once there is no formation of complexes when these dyes are used to sensitize the ZnO [7-12]. Among the dyes studied, Eosin Y presents promising results, besides providing the manufacture of a translucent orange DSSC with potential use in architectural elements [11-15].
The Eosin Y can be found in both salt and acid form. The Eosin Y salt is soluble in water and ethanol while the acid form shows low solubility in water [16]. Adsorption occurs by the bonding of carboxylic or hydroxyl groups, in the case of ZnO the bonding preferably occurs between the carboxylic group and the surface (1010) [17].
The immersion of the semiconductor oxide in the dye for 24h is the most common method of sensitization. However, this method is very expensive to manufacture DSSC due to the long time required for sensitization. [18-21]. In addition to the economic aspect, the sensitization time has a great influence on short-circuit current density and open circuit voltage [22-25].
In this work, electrophoresis was used to adsorb the Eosin Y on the surface of the photoanodes of ZnO of distinct morphologies obtained by the Chemical Bath Deposition method (CBD).
Materials and Methods
The ZnO nanostructures were grown onto a glass substrate coated with Fluorine Doped Tin Oxide (FTO). The ZnO seeds were prepared using the Successive Ionic Layer Adsorption and Reaction (SILAR) method, reported in a previous work [26].
The nanostructures were grown by CBD from 0.02M of distinct zinc salts: zinc acetate dihydrate (Zn(CH3COO)2.2H2O), zinc chloride (ZnCl2), zinc nitrate hexahydrate (Zn(NO3)2). The Ethylenediaminetetraacetic Acid (EDTA) 0.002M as complex agent and ammonium hydroxide (NH4OH) in the molar proportion Zn2+ to NH3 of 1:20 were used to prepare the complex [Zn(NH3)4]2+. The samples were named E-Ac, E-Cl and E-Nit respectively. A solution containing NH4Cl in proportion Zn+2:NH3 of 1:30 and zinc sulfate (ZnSO4) 0.01M as counter-ion was used to prepare the nanoparticles from a sulfate solution. The pH of the last solution was adjusted for pH=11 using NaOH 5M. This sample was named E-Sulf. The substrates were immersed in the solutions at 358K for 12h.
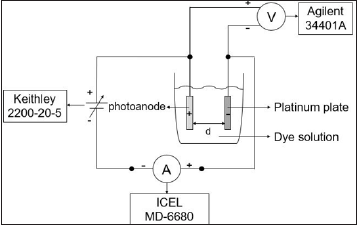
Figure 1 shows the classical schematic diagram for the adsorption of the dye through electrophoresis method. The Eosin Y salt 1.0x10⁻³M aqueous solution was used. The electrophoresis was carried for 900s at a current of 1.0x10⁻³A. The dye was desorbed by immersing the film on a NaOH 0.1M in ethanol 50% solution.
Figure 1: Schematic diagram of the apparatus used for electrophoresis.

The ZnO nanostructures were characterized using scanning electron microscopy (XL 30, Philips), X-ray fluorescence (EDX 720, Shimadzu) and X-ray diffraction (Ultima IV, Rigaku). The amount of dye adsorbed on the nanostructures surface was evaluated by UV-vis spectrophotometry (GT7227, Global Trade Technology), in wavelengths from 450nm to 650nm. The amount of dye loaded was calculated by adjusting the linear function from known concentration solutions.
Results and Discussion
Figure 2 shows the SEM imagens of the ZnO grown nanostructures. It can be noted that the nanostructures show distinct structures according to the zinc salt used. Figure 2a shows the nanostructures E-Ac, which presents nanorods like structures. Figure 2b indicates the rosebud morphology of the nanostructures E-Cl. Figure 2c exposes the film E-Nit, in this case, the film exhibits a heterogeneous morphology, composed of distinct nanorods and plate like structures. Figure 2d depict the structure E-Sulf, which was formed by nanorods-like structures of distinct orientation.
Figure 3 shows the x-ray diffraction patterns of the ZnO nanostructures. It revealed that all the precursors solutions have produced nanostructures of ZnO (and not Zn(OH)2). Furthermore, from the relative intensity of the peaks was also inferred that the film prepared using ZnAc showed higher preferred crystallographic orientation than the others nanostructured ZnO layers.
Figure 2: SEM micrographs of ZnO nanostructures with the precursors: (a) Zn(CH3COO)2.2H2O, (b) ZnCl2, (c) Zn(NO3)2 and (d) ZnSO4.

Figure 3: X-ray diffraction patterns of ZnO nanostructures prepared using the precursors: (a) Zn(CH3COO)2.2H2O, (b) ZnCl2, (c) Zn(NO3)2 and (d) ZnSO4.

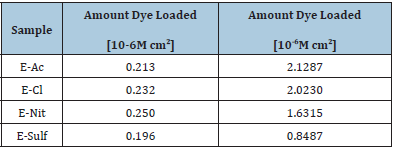
The thickness of the ZnO nanostructured layer measured using XRF is shown in Table 1. The values are given in mass per area unit. Thus, it was possible to evaluate the compactness of the samples by comparing the results with the morphology.
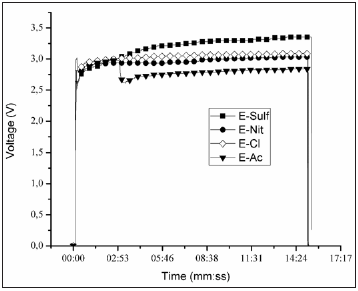
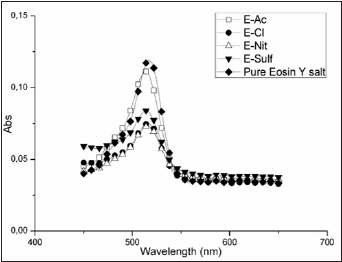
Figure 4 shows the electrophoresis curves. It can be seen that the sample E-Sulf presents a rising voltage curve, which indicates that the Eosin Y do not access easily the (1010) surface of the nonortogonal nanorods. The samples E-Cl and E-Nit, which exhibit heterogeneous morphologies composed by plates of lower superficial area, showed a constant deposition rate. The behavior of the voltage curve of the film E-Ac suggests that the adsorption mechanism (with long and orthogonal nanorods) occurred initially in most internal layer next to the seed and later in lateral faces of the nanorods. The amount of dye desorbed (Table 1) on the nanostructure E-Ac, with the highest amount of dye adsorbed, corroborates with this Figure 5 shows the UV-Vis spectra of the desorbed Eosin Y salt in a NaOH solution. The centered band at 515nm indicates preferential formation of monomers. It can also be observed that the spectra of the desorbed Eosin Y is shifted when compared to the spectrum of pure Eosin Y. This can be attributed to an interaction between the dye and the atoms of Zn and the formation of dimers. The dye absorbed on the films surface measured by UV-vis spectrometry is showed in Table 1.
Table 1: Thickness of the ZnO nanostructured layer and dye adsorbed.

Figure 4: V(t) x t (mm:ss) electrophoresis data for Eosin Y adsorption.

Figure 5: UV-Vis spectra of eosin Y solution desorbed of ZnO nanostructured film.

The amount of dye loaded on the semiconductor oxide is a function of the porosity and superficial area. Das et al. [27] reported that the saturation of the Eosin Y adsorption on a thickness ZnO film approximately 8μm (prepared by doctor blade method) occurs at in an interval of 12h. In this case the amount dye adsorbed was 0.191mMcm2. The influence of the porosity was studied by Gan et al. [28] and the maximum adsorption did not occur at the higher thickness, the dye loaded only was 5.53x10⁻⁸M cm2 on 2.6μm thickness. In the present work the amount of dye was higher than the values found on the literature. Also, the amount of dye loading showed to be dependent on the ZnO morphology and the degree of compactness. The maximum dye load occurred in the E-Ac sample, which showed a nanorod with a higher preferred crystallographic orientation and with a large surface in the (1010) face.
Conclusion
The amount of dye adsorbed is dependent to the morphology of the ZnO films. The nanostructure formed by nanorods showed the higher amount of dye adsorbed. Considering that this is the kind of morphology that presents the higher electronic mobility, then it is the best option for DSSC manufacturing. The electrophoresis proved to be an efficiency and fast method to dye adsorption for DSSC. However, the process parameters may be influenced by the morphology.
References
- O’Regan B, Grätzel M (1991) A low-cost, high-efficiency solar cell based on dye-sensitized colloidal TiO2 Nature 353: 737-740.
- Mathew S, Aswani Y, Peng G, Robin H, Basile F, et al. (2014) Dye-sensitized solar cells with 13% efficiency achieved through the molecular engineering of porphyrin sensitizers. Nat Chem 6(3): 242-247.
- Xie Y, Hu J, Bal T, Zhou X, Yang J (2016) Effect of surface modification by coating thioacetamide on the performance of ZnO-based dye-sensitized solar cells. New J Chem 40: 6475-6479.
- He Y, Hu J, Xie Y (2015) High-efficiency dye-sensitized solar cells of up to 8.03% by air plasma treatment of ZnO nanostructures. Chem Commun 51: 16229-16232.
- Canto-Aguilar EJ, Rodríguez-Pérez M, García-Rodríguez R, Lizama-Tzec F, De Denko A, et al. (2017) ZnO-based dye-sensitized solar cells: effects of redox couple and dye aggregation. Electrochim Act 258: 396-404.
- Anta JA, Guillén E, Tena-Zaera R (2012) ZnO-based dye-sensitized solar cells. J Phys Chem C 116(21): 11413-11425.
- Ambade S, Mane R, Han S, Lee S, Sung M, et al. (2011) Indoline-dye immobilized ZnO nanoparticles for whopping 5.44% light conversion efficiency. J Photoch Photobio A 222(2-3): 366-369.
- Baviskar P, Zhang J, Gupta V, Chand S, Sankapal B (2012) Nanobeads of zinc oxide with rhodamine B dye as a sensitizer for dye-sensitized solar cell application. J Alloy Compd 510: 33-37.
- Cheng H, Hsieh W (2010) High-efficiency metal-free organic-dye-sensitized solar cells with hierarchical ZnO photoelectrode. Energy Environ Sci 3(4): 442-447.
- Chiu W, Lee C, Cheng H, Lin H, Liao S, et al. (2009) Efficient electron transport in tetrapod-like ZnO metal-free dye-sensitized solar cells. Energy Environ Sci 2(6): 694-698.
- Minoura H, Yoshida T (2008) Electrodeposition of ZnO/dye hybrid thin films for dye-sensitized solar cells. Electrochemistry 76(2): 109-117.
- Pandikumar A, Saranya K, Ramaraj R (2012) Sheaf-like-ZnO @Ag nanocomposite materials modified photoanode for low cost metal-free organic dye-sensitized solid-state solar cells. Appl Phys Lett 101(9): 093112.
- Yoshida J, Zhang D, Komatsu S, Sawatani H, Minoura H, et al. (2009) Electrodeposition of inorganic/organic hybrid thin films. Adv Funct Mat 19(1): 17-43.
- Kanmani S, Ramachandran K, Umapathy S (2012) Eosin yellowish dye-sensitized ZnO nanostructure-based solar cells employing solid peo redox couple electrolyte. International Journal of Photoenergy 2012: 1-8.
- Khadtare S, Jadkar S, Hui K, Mane R, Pathan H (2014) Eosin-Y (EY), rose bengal (RB) an EY-RB sensitized ZnO solar cells. International Renewable and Sustainable Energy Conference (IRSEC).
- Cooksey CJ (2017) Quirks of dye nomenclature 10 eosin Y and its close relatives. Biotech Histochem 93(3):211-219.
- Hosono E, Fujihara S, Kimura T (2004) Synthesis, structure and photoelectrochemical performance of micro/nano-textured ZnO/eosin Y electrodes. Electrochim Acta 49(14): 2287-2293.
- Kuo H, Wu C (2014) Speed up dye-sensitized solar cell fabrication by rapid solution rops bombardment. Sol Energ Mater Sol C 120: 81-86.
- Luo X, Kim J, Ahn J, Lee D, Kim JM, et al. (2016) Electro spraying-assisted rapid dye molecule uptake on the surface of TiO2 nanoparticles for speeding up dye-sensitized solar cell fabrication. Sol Energ Mater Sol C 144: 411-417.
- Shahzad N, Alexe-Ionescu A, Tresso E, Barbero G (2013) Physical description of the impregnation mechanism of dye molecules in contact with porous electrodes. Physics Lett A 377(12): 915-919.
- Yeh S, Lee P, Liao H, Chen Y, Chen C, et al. (2015) Facile solution dropping method: a green process to dyeing TiO2 electrodes of dye-sensitized solar cells with enhanced power conversion efficiency. ACS Sustainable Chem Eng 3(1): 71-81.
- Arote S, Ingle R, Tabhane V, Pathan H (2014) Eosin-Y sensitized tin oxide photoelectrode for dye-sensitized solar cell application: effect of dye adsorption time. J Renew Sustain Ener 6(1): 013132.
- Bazzan G, Deneault J, Kang T, Taylor B, Durstock M (2011) Nanoparticle/dye interface optimization in dye-sensitized solar cells. Adv Funct Mater 21(17): 3268-3274.
- Guillén E, Casanueva F, Anta J, Vega-Poot A, Oskam G, et al. (2008) Photovoltaic performance of nanostructured zinc oxide sensitized with xanthene dyes. J Photoch Photobio A 200(2-3): 364-370.
- Lee C, Chou C, Chen C, Yeh M, Lin L, et al. (2014) Power Sources 246: 1-9.
- Galego E, Serna M, Ramanathan L (2013) A new route to grow ZnO seed layer using SILAR method. Technical Proceedings of the 2013 NSTI Nanotechnology Conference and Expo 3: 509-512.
- Das P, Roy A, Das S, Devi P (2016) Enhanced stability of Zn2SnO4 with N719, N3 and eosin Y dye molecules for DSSC application. Phys Chem Chem Phys 18(3): 1429-1438.
- Gan X, Li X, Gao X, He X, Zhuge F (2009) Deposition potential dependence of ZnO-eosin Y hybrid thin films prepared by electrochemical deposition and their photoelectrochemical properties. Mater Chem Phys 114(2-3): 920-925.
© 2021 Paula Maria da Silva. This is an open access article distributed under the terms of the Creative Commons Attribution License , which permits unrestricted use, distribution, and build upon your work non-commercially.
 a Creative Commons Attribution 4.0 International License. Based on a work at www.crimsonpublishers.com.
Best viewed in


.jpg)


 Editorial Board Registrations
 Submit your Article
 Refer a Friend
 Advertise With Us
.jpg)


.jpg)


.bmp)
.jpg)
.png)
.jpg)


.png)

.png)


.png)


