
- About Us
- Information
-

The Author ensures that the research has been conducted responsibly and ethically with adherence to all relevant regulations. read more..
- For Authors
- For Reviewer
- Manuscript Guidelines
- Membership
- Publication Ethics
-
- Journals
- Reprints
- e-Books
- Videos
- Policies
- Contact Us
 COVID-19
- Submissions


Full Text
Research & Development in Material Science
Iterative Tomography of Pipes During Operation
Vengrinovich VL, Zolotarev SA* and Zhukov KA
Institute of Applied Physics of NAS of Belarus, Belarus
*Corresponding author: Zolotarev SA, Institute of Applied Physics of NAS of Belarus, Belarus
Submission: April 20, 2021;Published: May 11, 2021

ISSN: 2576-8840 Volume 15 Issue 2
Abstract
Accurate assessment of pipe-wall thickness directly from the pipe’s tomographic images, restored from only a few X-ray tangential projections, made in a limited observation sector, is discussed. Because the effects of scattered radiation and beam hardening contribute up to 50% of the primary radiation, ignoring these effects yields image blurring, strong artifacts, and inaccurate sizing. A computerized technique has been developed that simulates the contribution of the scattered radiation, beam hardening, and screen nonlinearity, which is used to correct the projection data. The iterative Bayesian techniques are then used to reconstruct pipes images from the modified projections, using volumetric and/or hull representation of the pipe. Using these techniques, the error of the pipe-wall-thickness assessment from projection data can be as small as 300μm. This article shows that standard projection techniques using X- or gamma rays in combination with X-ray film or imaging plates for the data acquisition can be used to reconstruct wall-thickness profiles in an in-field environment.
Keywords: Industrial areas; Tomographic images
Introduction
There are a number of industrial areas, such as chemical and petrochemical, energy, pipeline transport, where accurate estimates of the thickness of the walls of transporting pipes, as well as the detection of defects in the solidity of pipes is a problem of the viability of the design and its safety. Often these assessments require a combination of several non-destructive control techniques, such as vortex, ultrasound and X-ray. Note that the object of the type “pipe” belongs to the class of bite-homogeneous objects of control. All the methods considered, except those based on X-rays, can be used only with sensors that are either directly inserted into the controlled tube or there is the possibility of direct contact with the outer surface of the pipe.
X-ray radiography allows contactless examination of the outer and inner surface of the pipe, but accurate estimates of corrosive and other damage to the pipe are not possible according to the radiograms used by X-ray methods give only a flat image of the 3D pattern and therefore the estimates made with their help are very approximate. On the X-ray, the shadows of the internal structures are superimposed on each other and mask important fragments of the pipe, much fewer minor defects. In the tomographic image, the internal structure of the pipe is reproduced without overlays, materials of different density and composition clearly differ. The dimensions of any inaccessible cavity and walls can be measured with high accuracy. That is, the problem could be solved by obtaining and analyzing three-dimensional tomographic images of pipes, but classical computed tomography is not applicable with limited access to the tube - a case that actually exists in practice [1].
The greatest application in the task - total thicknessometry - has ultrasound, but the laboriousness of the method when working with large surfaces of the pipe and the need for good contact of the sensor with the surface limit the scope of its application. Film and digital X-rays are also possible, but due to these limitations and the need to use a powerful source - radiation, Ƴ for example, Ir-192 with a short half-life, have not yet found widespread use. These restrictions apply entirely to the defectoscopy of ring welded tubes [2].
Iterative image reconstruction
Consider the recovery task as a reverse incorrect task with the goal of solving the following operator equation:
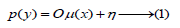
where p- measured data in the temporal or spatial area y, o - the operator that transfers input over the weekend, or one of the types of hardware function, set in a linear case using an order matrix with physical elements;- the vector of the unknown values being used and m× nOijμ (x)η the noise superimposed on the input. There are many different situations in which the operator equation (1) has no solution in the classical sense, and this means that the solution is ambiguous and unsustainable. However, despite the fact that the classic solution of the equation (1) in most cases does not exist, a generalized solution, or so-called pseudo-solution can be obtained by solving the problem of regularization, leading in the simplest case to minimize quadratic functionality. Let’s define a pseudosolution from the condition: μ (x)
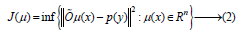
Where Rn is n dimensional rationed space with elements but is a model data derived from a direct problem solution. μ1,...,μnOμ (x) Pseudo-the solution may not be the only one, however, among the solutions having a minimum norm (2), it is the only one. The idea of optimizing the data processing process by maximizing some of the a priori functionality weighted by the regularization option has proved fruitful. B(μ ) Functionally imposes qualitative restrictions on the solution set either in the form of the sum of the squares of the adjacent elements of the reconstructed object or as a sum (the method of maximum entropy), which is an entropy of discretely distributed elements that matter. B(μ )Σμ 2j Σμ j logμ jμ j Incorporating a priori-expected probability distribution into calculations provides an opportunity to reduce the impact of uncertainty in experimental data. The probabilistic rule for optimal information processing is based on the Bayesian theorem to calculate the conditional probability, which is written in the form of:
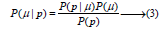
where a posterior probabilistic distribution is a probabilistic function that formally describes the noise-based response of the measuring system, is an unquestionable probability of experimental data, which is seen here as a global rationing constant set by the rule and is a prior probabilistic distribution. So, to calculate the most likely unknown solution, you need to maximize the expression.

With a probabilistic approach, image reconstruction begins with the maximization of Bayesov’s conditional probability according to the expression (3). This maximization operation is equivalent to minimizing the following functionality [3]:

where noise distributed under Gauss’s law can be presented as follows:

Here, the measured data in the pixel on a two-dimensional
projection with  index k, j jk , O μ are calculated projection data
for a specific data collection system, where the values jk μ are
coefficients of linear material weakening of the object material in
the corresponding discrete elements of volume (the voxels of the
right) Expression can be interpreted as a medium-sized dispersion
of the entire image. Member logP(μ ) is an information negative
entropy. The quality of input information can be assessed using the
absolute probability of input P( p) The relatively small value of the
P( p) value is usually the result of poor interoperability of the a prior
information, which does not cover all inputs, but the extremely
high value of P( p) greatly expands the configuration space and
thus leads to difficulties associated with poor convergence of the
iterative procedure and, accordingly, too much computational costs.
index k, j jk , O μ are calculated projection data
for a specific data collection system, where the values jk μ are
coefficients of linear material weakening of the object material in
the corresponding discrete elements of volume (the voxels of the
right) Expression can be interpreted as a medium-sized dispersion
of the entire image. Member logP(μ ) is an information negative
entropy. The quality of input information can be assessed using the
absolute probability of input P( p) The relatively small value of the
P( p) value is usually the result of poor interoperability of the a prior
information, which does not cover all inputs, but the extremely
high value of P( p) greatly expands the configuration space and
thus leads to difficulties associated with poor convergence of the
iterative procedure and, accordingly, too much computational costs.
The use of iterative tomographic algorithms using total variation as a regulatory function (TV) provides good results in the use of iterative tomography, allowing to successfully reconstruct images by minimizing semi-norm TV even with a limited number of noisy projections. Using the minimization of the total variation of the reconstructed image allows to eliminate artifacts caused by the noise of X-ray projections, arising from the small current of the X-ray tube. In addition, the use of total variation ensures the near-total elimination of strip artifacts caused by a decrease in the number of projections [4].
Tomography of limited number of projections at incomplete angle of view
During the tomographic reconstruction, a set of X-ray projection images is transformed into many flat sections of the three-dimensional tomographic image, which is a laborious computational procedure. The Institute of Applied Physics of NANB has developed software that allows for parallel reconstruction for spiraling, fan and conical geometry of shooting. The software is designed for Windows XP, 64 bit, Windows 7, 64 bit and Windows 8, 64 bit. Internal defects such as cracks, voids and foreign inclusions can have a significant impact on the reliability and quality of industrial products. With our state-of-the-art tomographic software, we can give you a look inside your product and show you in three-dimensional form why they don’t meet the requirements [5].
Our experience allows us to correctly assess complex 3D digital images and correctly diagnose the problem by identifying defects up to the micron level. Usually, the study of the internal structure of the object cannot be achieved without the destruction of the object itself. This study is crucial for identifying defects in substandard products, such as identifying voids and cracks. When the sample is cut into several parts in order to find these defects, New defects can be introduced, the original sample is destroyed, and therefore there is a risk that the defect will not be detected due to the fact that the cutting of part of the sample was done in the wrong place.
3D imaging, applied simultaneously with the software for tomographic reconstruction, is an alternative to destructive control methods, as the controlled object can be investigated in its entirety, and the result of tomographic reconstruction provides a full threedimensional representation of the necessary spatial area, both inside and outside the object. The software is designed to collect input projection data at different positions of the radiation source and different scanning geometries.
Two-dimensional wrapping tomography of the longitudinal profile of the pipe
Purpose: Reconstruct the longitudinal image of the pipe and measure the thickness of the walls with an accuracy of 0.5mm.
The wording of the problem: Overcoming mathematical degeneration: The prospective viewing angle of the object is too small to accurately recover the image of the four surface pipes (Figure 1).
Figure 1: Scan geometry for reconstruction longitudinal profile pipes.

The Federal Institute of Materials Science and Diagnostics (Germany, Berlin) has developed a tomographic radiometry system TomoCAR, adapted to a wide range of pipe diameters and allows automatic receiving a set of flat X-ray images of longitudinal section of the pipe in the corner of the view, limited to 400-450. The view of the installation is shown in Figure 2. The pixel is 83 microns, with a total length of 1,856 pixels. 0.4мм 1.5ммThe mechanized radiometric system was created to inspect the ring seams. Its main task is to detect and assess the size of 176mm 500mm the cracks. The X-ray source moves along the longitudinal axis of the pipe. At the same time, in one pass it produces up to 1200 pulses of radiation recorded by the linear matrix of detectors.
Figure 2: Mechanized tomographic radiometric system.

The main problem is that in the planning tomography due to the acute lack of data due to the small angle of view (only 350-450 instead of the required 1800) reconstruction by filtered reverse projections (FOP) allows only a greased image of a pipe with a large number of artifacts.
In the Institute of Applied Physics Computational Diagnostics Laboratory, in cooperation with the Federal German Institute of Materials Science and Diagnostics, an application software package was developed, Providing reconstruction of the profile of the inner and outer surface of the pipes with the help of the system of mechanized radiometry TomoCAR. The software interface provides input of the raw data and the task of parameters of preprocessing and reconstruction, both for scanning along the pipe axis, and for the sequential removal of a set of such scanned data while rotating the scanner around the axis of the pipe with a given angular step, which provides reconstruction of the internal and outer surface of the pipe.
Examples of pipe profile reconstruction
Designed by Institute of Applied Physics, the reconstruction technology for tomoCAR’s mechanized X-ray projection system, However, due to the use of smoothing prior information, the resolution may not be sufficient 0.5мм to detect particularly minor defects. In the upper zone of the picture, the result of the reconstruction of the pipe by the FOP method is shown, on the lower zone - the result of the reconstruction of the same section of the pipe by the method of wrapping reconstruction, and in the middle - the image obtained by merging the two previous images (Figure 3).
Figure 3: Image fusion technology.

3D X-ray tomography
An important addition to the previously described tomographic methods of reconstruction based on limited data is the method of three-dimensional wrapping reconstruction, which allows to reconstruct the inner and outer surface of the pipe, which is in operation even with unilateral access to it.
Reconstruction of the inner surface of the pipe by five projections
The proposed technique was tested on a sample from the German Institute of Materials Science and Diagnostics, which was a steel pipe. To test the resolution of the algorithm, four delays were attached to the inner surface of the pipe 3.6mm, 1.8mm, 1.4mm ,1.25mm, 0.8mm (Figures 4 & 5).
Figure 4: X-ray data collection scheme.

Figure 5: Reconstruction results: (a) gray value representation of inner pipe surface together with pipe profile along the circle, thickness profile 1 and profile 2 along pipe axis shown in (b) and (c), respectively.

For this geometry, the source of radiation can be considered a point, i.e., the translucent was carried out by a conical beam. The linear weakening of the pipe material was transferred to a larger grid for reconstruction. The pixel size of the new images was . The image size was 593x299 pixels. Discretization of the inner surface μ −1 0.2mm and: on the corner of 1200 points, and on the axis residents 213 points (0.3 degrees and - the size of intervals on the corner and coordinate). The bill time on modern computers is about 10 to 15 minutes.0.3mm, 0.1mm.
Three-dimensional tomography taking into account a priori information
In industrial X-ray imaging, the input of the data and the limited range of their view require optimal accounting of all available a prior information. It is known that the main problems of industrial tomography are:
A. Limited viewing angle,
B. Low number of projections
C. Translucent by a diverging conical beam.
The challenge is to use the maximum pre-found prior information about the solution you’re in. In the process of image reconstruction, the information is numerically transformed, which involves its distortion, as it involves discretization. When a mathematical model is replaced with a discrete model, the original information is distorted. Iterative account and rounding errors distort the information as it is numerically converted. The more complex the task, the more distortions of information in its numerical solution, the less reliable the result of the decision. Attempts to achieve the desired accuracy by reducing the step of the grid lead to an increase in the number of unknowns. At the same time, the amount of calculations increases dramatically, and, consequently, the accumulation of errors.
However, additional prior information about the integral properties of the object under study can be added to the theoretical model. The introduction of a prior information narrows the function class in which a solution is sought, reduces computation, and creates restrictions on random misrepresentation of information when you score. As a rule, industrial objects are bit-and-homogeneous objects consisting of the final number of different materials. For example, industrial pipelines can be considered as three-phase objects consisting of steel or cast iron, insulation and leaking liquid, or some gaseous phase (steam or gas). For such objects, the quality of tomographic reconstruction can be significantly improved by using iterative algorithms using total variation as a regulatory function. The total variation method has provided new possibilities of iterative tomography, allowing to successfully reconstruct images by minimizing semi-standard TV even with a limited number of noisy projections.
Below, Figure 6 shows five X-ray projections of a pipe with a diameter and a thickness of 10mm wall, obtained at the Mozyr oil refinery. The lack of energy of the X-ray source caused a strong blur on the X-ray projections due to the effects of scattering and the tightening of X-rays.89мм. Figure 7 shows a cross section of the pipe in the weld area and a promising image of the pipe. Note that this image is unsuitable for inirtauriscal measurements (Figures 8 & 9).
Figure 6: X-ray projections of the test tube.

Figure 7: Cross section and a promising view of the reconstructed pipe image.

Figure 8: Cross section of the pipe and its profile along the line running through its center.

Figure 9: Cross-section of the pipe and its profile along the line running through the center of the pipe.

Conclusion
The proposed tomographic reconstruction technique can be applied to the wall thickness determination for corroded pipes. For this purpose, only a couple of projections within limited observation angle are sufficient to get accurate measures. The measurement error of less than 0.3mm can be reached. The accuracy of the technique can be improved by extracting the contribution of concomitant effects, like scattering and background radiation, from the exposed image. Finally, the conclusion can be drawn that standard projection techniques using X- or Gamma rays in combination with X-ray film or imaging plates can be applied for the data acquisition to reconstruct wall thickness profiles in an infield environment. This work was funded by the Federal Ministry of Economics of Germany and the National Academy of Sciences of Belarus.
References
- Vengrinovich VL, Zolotarev SA (2009) Iterative methods in tomography.
- Vengrinovich VL, Denkevich JB, Tillack GR, Nockeman C (1997) Multistep 3D X-ray tomography from a limited number of projections and views. In: Tompsonand DO & Chimenti DE (Eds.), Review of Progress in QNDE. 16: 317-323.
- Vengrinovich VL, Denkevich JB, Tillack GR (1998) Limited projections and views bayesian 3d reconstruction using gibbs priors. 3(8): 2371-2378.
- Linden WV (1995) Maximum entropy data analysis. J Appl Phys A 60: 155-165.
- Jia RQ (2010) A fast algorithm for the total variation model of image denoising. Adv Comput Math 33: 231-241.
© 2021 Zolotarev SA. This is an open access article distributed under the terms of the Creative Commons Attribution License , which permits unrestricted use, distribution, and build upon your work non-commercially.
Editor In Chief


.jpg)


Signup for Newsletter

Quick Links
 Editorial Board Registrations
 Submit your Article
 Refer a Friend
 Advertise With Us
Our Recent Edition

.jpg)


Top Editors


.jpg)


.bmp)
.jpg)
.png)
.jpg)


.jpg)


.png)

.png)


.png)


Financial Support

Sponsors

Latest e-Books

Latest Video

 a Creative Commons Attribution 4.0 International License. Based on a work at www.crimsonpublishers.com.
Best viewed in
a Creative Commons Attribution 4.0 International License. Based on a work at www.crimsonpublishers.com.
Best viewed in