
- About Us
- Information
-

The Author ensures that the research has been conducted responsibly and ethically with adherence to all relevant regulations. read more..
- For Authors
- For Reviewer
- Manuscript Guidelines
- Membership
- Publication Ethics
-
- Journals
- Reprints
- e-Books
- Videos
- Policies
- Contact Us
 COVID-19
- Submissions


Full Text
Research & Development in Material Science
Annual Inhalation Dose of Indoor Radon and Thoron in Mizoram, India
Chhangte LZ1*, Zoliana B2, Sahoo BK3, Sapra BK3, Pachuau Z4 and Zirlianngura5
1Department of Physics, Govt. Zirtiri Residential Science College, Aizawl, Mizoram, India
2Department of Electronics, Govt. Zirtiri Residential Science College, Aizawl, Mizoram, India
3Radiological Physics and Advisory Division, Bhabha Atomic Research Centre, Mumbai, India
4Department of Physics, Mizoram University, Aizawl, Mizoram, India
5Department of Chemistry, Govt. Zirtiri Residential Science College, Aizawl, Mizoram, India
*Corresponding author: Chhangte LZ, Department of Physics, Govt Zirtiri Residential Science College, Aizawl, Mizoram, India
Submission: February 03, 2021;Published: March 05, 2021

ISSN: 2576-8840 Volume 15 Issue 1
Abstract
Annual inhalation dose of indoor radon and thoron have been measured using Solid State Nuclear Track Detector (LR-115 type-ІІ) based Twin Cup Dosimeter with single entry and Direct Progeny Sensors (DPS) in Mizoram, which has the highest lung cancer incidence rates among males and females in India. The measurement was carried out in 50 dwellings selected primarily from the background gamma radiation level measured using Micro-R survey meter and the construction type of the building. The annual inhalation dose of indoor radon and thoron are found to be 1870.68±10μSv/y and 631.7±4μSv/y respectively which are higher than the global average values but within the ICRP recommendation.
Introduction
About 87% of the radiation dose received by mankind is due to natural radiation sources and the remaining 13% by anthropogenic radiation [1]. The worldwide average natural radiation dose to humans is about 0.3-1.0mSv/year which is four times higher than the world average of artificial radiation exposure [2]. The most important component of natural radiation exposure to the public is due to the inhalation of indoor radon, thoron and their decay products which constitute about 54% of natural radiation [3]. As radon/thoron gases are inhaled, densely ionizing alpha particles emitted by the short-lived decay products of radon/thoron can interact with biological tissue in the lungs leading to DNA damage and results into lung cancer [4]. Since majority of the residents use to spend most of the time at indoors, the knowledge of the indoor concentration of radon, thoron and their progenies is of utmost importance.
To calculate the annual indoor inhalation dose of radon and thoron, their indoor concentration, progenies concentration and their equilibrium factors must be calculated first. In the present study, passive measurement technique has been followed for measurement of indoor radon and thoron concentration, using Solid State Nuclear Track Detector (LR-115 Type-II) in Pin-Hole Based Twin Cup Dosimeters with single entry developed by Bhabha Atomic Research Centre (BARC), Mumbai [5]. To measure the progenies concentration, deposition base Direct Radon/Thoron Progeny Sensor (DRPS/DTPS) were used [6-8]. Dwellings were selected according to the gamma level measured using Gamma Survey Meter and the building type. The GPS co-ordinates have also been recorded for each dwelling in which dosimeters and DRPS/DTPS were installed for proper location assessments.
Study Area
The geographical location of the study area is Saiha and Lawngtlai districts of Mizoram, India within Latitude-220 29’ 28.3” to 220 36’ 59.4” and Longitude 920 59’ 14.3” to 920 52’ 22.0” with altitude ranging from 1866±10 feet to 3807±10 feet from the sea level.
Methods
Indoor radon & thoron
The LR-115 type-II plastic track detectors (SSNTDs) kept in the Dosimeter was deployed in 50 dwellings of 8 different villages of Lawngtlai and Saiha District, Mizoram India from 3rd July 2015 to 22nd June 2016. Due to maximum occupancy, bedrooms were chosen for deployment of the dosimeters. After more than 90 days of exposure in dwellings, the detectors were removed and subjected to chemical etching in 2.5N NaOH solutions at 60 ˚C for 90 minutes in a constant temperature bath. Then these films were washed and dried. The track density was obtained by using the standard spark counter (Model PSI-SC1) with operating voltage (500V) and the pre-sparking voltage (900V) of the spark counter, which has been established before these measurements [9] (Figure 1).
Figure 1: Pin-hole base dosimeter.

The track density recorded on the detector in the Radon Chamber and Radon+Thoron Chamber were converted into radon and thoron concentrations according to the following formulae
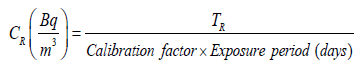
where CR is the radon concentration and TR are the tract density of detector in Radon Chamber. Calibration factor used=0.0172±0.002 [5].
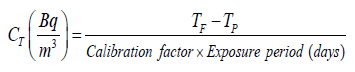
where CT is the thoron concentration, TF is the track density of films in Radon chamber and TP is that for Radon+Thoron chamber. Calibration factor used=0.010±0.001 [5].
Progeny measurement
The concentrations of progenies are determined through Equivalent Equilibrium Radon/Thoron Concentrations (EERC & EETC). The EEC of radon/thoron is equal to that quantity of radon/ thoron concentration which is in secular equilibrium with its progeny nuclides giving equivalent potential alpha energy concentration (PAEC) for the progeny nuclides actually present in the atmosphere. EERC and EETC were measured by deposition based Direct Progeny Sensors (DRPS/DTPS) in bare modes [8] (Figure 2).
Figure 2: DRPS & DTPS.

DTPS element is made up of LR-115 type II mounted with
50μm aluminized mylar to selectively detect only 8.78MeV alpha
particle emitted from 212Po; while DRPS is made up of LR-115 type
II mounted with aluminized mylar plus cellulose nitrate of effective
thickness 37μm to detect mainly 7.69MeV alpha particle emitted
from 214Po. The basic principle of operation of these sensors is that
the detector detects the alpha particles emitted from the deposited
progeny atoms. The tracks formed are recorded in the exposed
LR-115 type II film is related to Equilibrium Equivalent Progeny
Concentration (EEC) using the sensitivity factor [6]. The DRPS and
DTPS are hanged along with the dosimeter on the ceiling of the
bedroom for a minimum of 90 days. The detectors were then etched
and subjected to Spark counting.
The track density obtained using DTPS can be used directly to
calculate the EETC, since the comparatively larger thickness (50μm)
of the absorber used in DTPS does not allow radon progeny to pass
through it and hence there is no interference from radon progeny to
thoron progeny. Formulae used to calculate EETC is as follows [6,8]
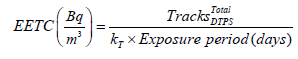
where kT is the calibration factors for DTPS. The values of calibration factors for DTPS in natural environment have been calculated by [10] to be equal to 0.94 Tracks cm-2d-1/EETC(Bqm-3). In case of EERC, since the energy of 212Po (thoron progeny) is higher than that of 214Po (radon progeny), the alpha particles emitted from both radon progeny and thoron progeny pass through the absorber (37μm) used in the DRPS and hence to calculate EERC, the tracks produced by the thoron progeny are eliminated as calculated from DTPS, using the equation [8]
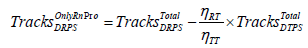
where, ηRT(= 0.01 ± 0.0004/ alpha particle ) and ηTT (= 0.08 ± 0.004/ alpha particle ) are the track registration efficiencies of thoron progeny in DRPS and that in DTPS, respectively, TracksOnlyRnPr o DRPS is the tracks density recorded on DRPS due to only radon progeny and TracksTotal DRPS and TracksTotal DTPS are the abbreviations for total track density recorded on DRPS and DTPS, respectively. Formulae used to calculate EERC [6,8] is given as follows
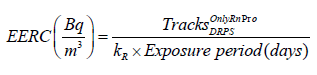
where kR is the calibration factors for DRPS. The values of calibration factors for DRPS in natural environment have been calculated by [10] to be equal to 0.09 Tracks cm-2d-1/EETC(Bqm-3).
Equilibrium factors
The equilibrium factor or the sensitivity factor for the radon (FR) and thoron (FT) are the quantity of ultimate interest in passive dosimetry applications. In the literature on inhalation dosimetry, it is conventional to express FT as the track density expected for 1-day exposure to an environment containing 1Bq/m3 of EETC. Likewise, FR represents the track density expected for 1-day exposure to an environment containing 1Bq/m3 of EERC after subtracting the track density expected from 1Bq/m3 of EETC.
The following formulae are used to obtain the sensitivity factor (equilibrium factor) of radon and thoron respectively [8].
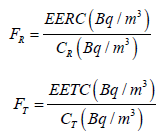
where CR and CT are theconcentration of radon and thoron
Inhalation dose
Annual inhalation dose rate is the amount of radon and/
or thoron inhaled per annum (μSv/yr) by individuals indoor.
Inhalation dose can be calculated using the obtained concentrations
of the parent nuclei and the progenies.
Several models have been developed to assess the inhalation
dose rates to the population due to radon, thoron and their progeny
[11]. Lung dose distribution assessment carried out by different
agencies right from 1956 to 2000 given in details in UNSCEAR
reports. [12] shows a large variation in dose conversion factors.
The estimated dose conversion factors varied drastically based on
the breathing rate as well as the target tissue. Based on these, the
dose conversion factors were derived, which has been used for the
compilation of the inhalation dose rate (D) as shown below
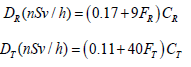
where numerical numbers are the dose conversion factors for gas and progeny concentrations [12].
Result and Discussion
(Figure 3); (Table 1) Indoor radon, thoron and their progeny concentration have been calculated in 50 (only 31 can be compared) dwellings situated in 8 different villages/town of Saiha and Lawngtlai District of Mizoram. The observed annual average concentration of indoor radon in the dwellings has been varying from 52.73±5Bq/m3 to 143.36±8Bq/m3 with the average value of 89.50±7Bq/m3, and that of thoron varying from 17.39±13Bq/m3 to 53.57±21Bq/m3 with the average value of 34.60±17Bq/m3. The annual average indoor radon and thoron concentration obtained is on the higher side of the average worldwide indoor radon (40Bq/m3) and thoron (10Bq/m3) concentration [13] and national average values (42 and 12.2Bq/m3) [8]. However, the indoor radon or thoron level are well below the action level recommended by the WHO and ICRP [14,15].
Figure 3: Annual average inhalation dose.

Table 1: Annual average indoor radon, thoron and progenies concentration (Bq/m3), equilibrium factors and inhalation dose (μSv/y).

The calculated annual average value of EERC has been varying from 9.82±1Bq/m3 to 27.24±2Bq/m3 with the average value of 15.04±2Bq/m3, and that of EETC varies from 0.78±0.1Bq/m3 to 2.73±0.6Bq/m3 with the average value of 1.71±0.1Bq/m3. The average indoor progeny concentrations of radon and thoron lie under 17Bq/m3 and 3Bq/m3 respectively which are the safe limits recommended by [15] in the dwellings.
The annual average Equilibrium Factor for radon has been varying from 0.18±0.02 to 0.39±0.03 with the average value of 0.27±0.03 which is lower than the globally assumed value of 0.4 [12] and that of thoron varies from 0.02±0.006 to 0.34±0.003 with the average value of 0.08±0.01 which is smaller than the globally assumed value of 0.1 [16].
The annual average indoor radon inhalation dose has been varying from 856.86±7μSv/y to 3070.24±12μSv/y with the average value of 1870.68±10μSv/y and that of thoron varies from 290.62±3μSv/y to 1140.41±5μSv/y with the average value of 631.7±4μSv/y. This result is higher than the global average values (1100μSv/y for radon & 90μSv/y for thoron). The Total Inhalation Dose varies from 1362.25±10μSv/y to 3774.68±18μSv/y with the average value of 2502.38±14μSv/y and GM of 2419.67μSv/y (GSD 1.302). This result is within the national average value (0.27-5.14mSv/y) reported by [17] and lower than the upper value for annual dose level (10mSv/y) recommended by [18].
Conclusion
i. Annual Average Indoor Radon, thoron and their progeny
concentrations in the study area are found to be under the
safe limits recommended by [15] but higher than the national
average.
ii. The annual average equilibrium factor for radon and
thoron are found to be lower than the globally assumed values.
iii. The annual inhalation dose of radon and thoron are higher
than the global average, but the total average indoor inhalation
lies within the national average and [18] recommended value.
Contribution of inhalation dose rate due to thoron and its
progeny is seen to be about 25% of the total inhalation dose
rate.
Acknowledgement
The Authors are grateful to Radiological Physics and Advisory Division, Bhabha Atomic Research Center for providing necessary equipment and all the resident in the study area who have helped in carrying out this study.
References
- Kannan V, Rajan MP, Iyengar MR, Ramesh R (2002) Distribution of natural and anthropogenic radionuclides in soil and beach sand samples of Kalpakkam (India) using hyper pure germanium (HPGe) gamma ray spectrometry. Appl Radiat Isot 57(1): 109-119.
- UNSCEAR (2008) Vol I Annexure B. Exposure to the public and workers from various sources of radiation. Report to the General Assembly. New York, United Nations, p. 234.
- UNSCEAR (1994) United nations scientific committee on the effects of atomic radiation, ionizing radiation: Sources and biological effects. New York, USA.
- Edling C, Wingreen G, Axelson O (1986) Quantification of the lung cancer risk from radon daughter exposure in dwellings- An epidemiological approach. Environment International 12(1-4): 55-60.
- Sahoo BK, Sapra BK, Kanse SD, Gaware JJ, Mayya YS (2013) A new pin-hole discriminated 222Rn/220Rn passive measurement device with single entry face. Radiation Measurements 58: 52-60.
- Mishra R, Mayya YS (2008) Study of a deposition-based Direct Thoron Progeny Sensor (DTPS) technique for estimating equilibrium equivalent thoron concentration (EETC) in indoor environment. Radiation Measurements 43(8): 1408-1416.
- Mishra Rosaline, Sapra BK, Mayya YS (2015) Emerging trends in 222Rn and 220Rn decay products detection. Solid State Phenomena 238: 134-139.
- Mishra Rosaline, Mayya YS, Kushwaha HS (2009) Measurement of 220Rn/222Rn progeny deposition velocities on surfaces and their comparison with theoretical models. Journal of Aerosol Science 40(1): 1-15.
- Azimi Garakani D, Shahbazi M, Latifi G (1981) A new automatic spark counting system. Nuclear Tracks 4(3): 141-149.
- Mishra R, Prajith R, Sapra BK, Mayya YS (2010) Response of direct thoron progeny sensors (DTPS) to various aerosol concentrations and ventilation rates. Nuclear Instruments and Methods in Physics Research Section B: Beam Interactions with Materials and Atoms 268(6): 671-675.
- Ramu SC, Shaikh AN, Muraleedharan TS, Ramachandran TV (1992) Measurements of indoor radon levels in india using solid-state nuclear track detectors: Need for standardization. Defen Sc Jour 42(4): 219-225.
- UNSCEAR (2000) Annexure B. Exposures from natural radiation, Report to the general assembly with scientific annexes, United Nations. Pp: 84-141.
- Nazaroff WW, Nero AV (1988) Radon and its decay products in indoor air. John Wiley & Sons, New York, USA.
- WHO (2009) WHO handbook on indoor radon: A public health perspective. Geneva, Switzerland, p. 94.
- ICRP (1993) Protection against 222Rn at home and at work. Annals of ICRP 23(2): 1-39.
- UNSCEAR (1993) United nations scientific committee on the effects of atomic radiation. Sources, effects and risks of ionizing radiation. Report to the General Assembly, New York, United Nations.
- Ramachandran TV, Mayya YS, Sadashivan S, Nair RN, Eappen KP (2003) Radon-thoron levels and inhalation dose distribution patterns in indian dwellings. BARC Report Mumbai, Government of India, pp: 1-63.
- ICRP (2007) The 2007 recommendations of the international commission on radiological protection. Annals of ICRP, ICRP Publication, pp: 1-34.
© 2021Chhangte LZ. This is an open access article distributed under the terms of the Creative Commons Attribution License , which permits unrestricted use, distribution, and build upon your work non-commercially.
Editor In Chief


.jpg)


Signup for Newsletter

Quick Links
 Editorial Board Registrations
 Submit your Article
 Refer a Friend
 Advertise With Us
Our Recent Edition

.jpg)


Top Editors


.jpg)


.bmp)
.jpg)
.png)
.jpg)


.jpg)


.png)

.png)


.png)


Financial Support

Sponsors

Latest e-Books

Latest Video

 a Creative Commons Attribution 4.0 International License. Based on a work at www.crimsonpublishers.com.
Best viewed in
a Creative Commons Attribution 4.0 International License. Based on a work at www.crimsonpublishers.com.
Best viewed in