
- About Us
- Information
-

The Author ensures that the research has been conducted responsibly and ethically with adherence to all relevant regulations. read more..
- For Authors
- For Reviewer
- Manuscript Guidelines
- Membership
- Publication Ethics
-
- Journals
- Reprints
- e-Books
- Videos
- Policies
- Contact Us
 COVID-19
- Submissions


Full Text
Research & Development in Material Science
Vibrational Analysis and Electrical Conduction Mechanism Investigations ofOrder Disorder Phase Transitions in [N(C3H7)4]2ZnBr4Compound
Souad Chkoundali1, Abdelhedi Aydi1*and Faouzi HLEL2
1Laboratory of Multifunctional Materials and Applications (LaMMA), Faculty of Sciences of Sfax, University of Sfax, Tunisia
2Laboratory of spectroscopic characterization and optics of materials, Faculty of Sciences, University of Sfax, Tunisia
*Corresponding author: Abdelhedi Aydi, Laboratory of Multifunctional Materials and Applications (LaMMA), Faculty of Sciences of Sfax, University of Sfax, Tunisia
Submission: September 14, 2020;Published: November 13, 2020

ISSN: 2576-8840 Volume 14 Issue 3
Abstract
Bis-Tetrapropylammoniumtetrabromozincate has been synthesized and characterized by X-ray, vibrational spectroscopy and impedance spectroscopy. The Rietveld refinement of the XRD diffractogram confirms the crystallization of the compound through the monoclinic system (space group C2/c). A temperature study of the Raman scattering revealed two phase transitions at about T1=340 and T2=393K.The evolution of the wavenumber and the line width versus the temperature showed some singularities associated with the transitions, suggesting that they are governed by the re-orientation of the [N(C3H7)4]+organic part. The complex impedance plotted as semicircle arcs in the temperature range and the centers of the semicircles lie below the real axis, which indicates that the material is non-Debye type. Double semicircles were related to bulk and grain boundary effects. Furthermore, the alternating current conductivity of the [N(C3H7)4]2ZnBr4obeyed the Jonscher’s law: σAC(ω)=σdc+Aωs and the conduction could be attributed to the correlated barrier hopping (CBH) model in region (I) and (II)and the Non-overlapping Small Polaron Tunneling (NSPT) in region (III).
Keywords: Bis-Tetrapropylammoniumtetrabromozincate; Raman spectroscopy; Phase transition; Electrical conductivity; Conduction mechanism
Introduction
Organic-inorganic hybrid materials have attracted growing attention in recent research because they can combine specific properties of organic-inorganic frameworks including the formation of interactions [1]. In fact, regarding the nature (molecular, ionic, hydrogen bonding, etc...) of organic and inorganic components, many combinations may be achieved to elaborate the interesting materials with special physical properties in several fields of new scientific materials, such as nonlinear optical, electronic, magnetic [2]. These materials have recently attracted further interest due to their attractive potential for application [3]. More particularly, the hybrids compounds of the general formula A2MX4, where A is the alkylammonium group, M a divalent metal and X a halogen, has received much attention due to the presence of several phase transitions related to the re-orientation of the cationic parts [4-10].Taking these aspects into account and as an extension of our previous studies on organic-inorganic hybrid materials, herein, we have successfully synthesized the bis-tetrapropylammoniumtetrabromozincate compound. Structurally, at room temperature, [N(C3H7)4]2ZnBr4 crystals are monoclinic system (Space group C2/c) with the following unit cell parameters: a=33.145(5) Å, b=14.234(3) Å, c=15.081(2) Å, β=110.207(5)°. The atomic arrangement can be described by an alternation of organic and inorganic layers along the [100] direction, which are made up of [N(C3H7)4]+ and [ZnBr4]2- atom (Figure 1). The inorganic groups are located in the (100) plane at a=1/8 and 3/8 sandwiched between two different organic sheets [11]. In fact, the objective of this paper is to study the Raman scattering and electric propriety in order to investigate the phase transition for this compound.
Figure 1: Crystal structure of the [N(C3H7)4]2ZnBr4, view along the b axis.

Experimental Procedure
Synthesis
The organic–inorganic [N(C3H7)4]2ZnBr4 crystals were grown using ZnBr2 (purity 98) and [N(C3H7)4]Br (purity 97%; FLUKA) are dissolved in an aqueous solution in a molar ratio of 1:1. After a few days, the white prismatic monocrystals are obtained through a slow evaporation at room temperature. Then, the single crystal is selected using a microscope.
X-ray powder diffraction
The phase purity and homogeneity were checked using X-ray powder diffraction analysis. Using a Phillips PW 1710 powder diffractometer operating with CuKa(l= 1.5405 Å), the XRD patternawas recorded in a wide range of Bragg angles (9<2q<50). The Raman scattering spectra were recorded using a Horiba-Jobin-Yvon T64000 Raman spectrometer in the frequency range of 100-3200cm-1 using the 514.5nm radiation of an Ar/Kr laser as excitation. The studies of a function of temperature were performed in a Link am heating stage up to 415K. The wavenumbers and widths of the Raman lines were determined by fitting using the LabSpec5 software with a combined Lorentzian–Gaussian band shape. To study the electrical proprieties, the [N(C3H7)4]2ZnBr4 compound are grinded and pressed into cylindrical pellet of 8 mm in diameter and 1.1mm in thickness using 3t/cm uniaxial pressure. The performed measurements were executed in the frequency and temperature range of 200 Hz-5MHz and 303 K-423K, respectively, using a HP4284 impedance analyzer.
Results and Discussion
X-Ray powder diffraction
The X-ray diffraction pattern of the [N(C3H7)4]2[ZnBr4] compound at room temperature is shown in Figure 2. The Rietveld refinement was performed using the FULLPROOF software Program. The circles symbolize the experimental data, and the line presents the simulated pattern. The purity of the studied compound was proved and the reflection peaks were indexed in the monoclinic system (C2/C space group) ) and the refined cell parameters are found to be as follows: a=33.132(5) Å, b=14.234(3) Å, c=15.081 (2) Å and β= 110.23(1)°. The quality of the refinement was evaluated through the goodness of where c2 =6.67. The values of the reliability factors obtained from the refinement are Rip=8.99, Rp= 8.15 and Rexp=3.48 and the fitted parameters were found to be in a good agreement the previously reported results in the literature [11].
Figure 2: X-ray powder diffraction pattern for[N(C3H7)4]2ZnBr4 compound.

Temperature evolution of the Raman spectra
Table 1: Assignments of most important observed bands in Raman spectra of [N(C3H7)4]2ZnBr4 at room temperature.

The strong Raman bands observed in the wavenumber, which range between 2988and 2905 cm, are assigned to the stretching vibrations of the CH3 and CH2 groups while the bands at 1460 and 1350cm-1 area scribed to the asymmetric and symmetric bending vibration of the CH3, respectively. As for the bands observed in the range of 847-750 cm-1, they emanate from the bending of the (C-C-C + C-N-C) groups and the N-C stretching vibrations. However, the internal modes of ZnBr4 anion are below 312cm-1. In fact, the assignments of the observed bands are realized by comparing them to similar compounds, such as:[N(C3H7)4]2SbCl4 compound [12] , [N(C3H7)4 ]2CoCl4compound [13],[N(C3H7)4 ]2SnCl6 compound [14] , [N(C3H7)4]2FeCl4 [15] compound, [(C3H7)4N][M(N(CN)2)3] compound [16] and [(C3H7)4N][Cd(N(CN)2)3] compound [17]. These vibrational wavenumbers together with the proposed band assignments are listed in (Table 1).
The aim of this work is to find the modes sensitive to the phase transition at 340 and 393K in the 2[N(C3H7)4]ZnBr4 compound. The Raman spectra at several temperatures are illustrated in (Figure 3a-3d).These spectra are devised into four areas of wavenumbers: the first from 100 to 320cm-1, the second from 320 to 1000cm-1, the third from 1000 to 1600 and the fourth from 2600 to 3200cm-1.It is obvious that several Raman mode wavenumbers change discontinuously at around the transitions evidenced at 340 and 393K by DSC measurements [11]. A careful analysis of these spectra clearly shows that the results and discussion shapes of most bands obtained between 100 and 320cm-1, where the anionic part is found, do not change a lot below the phase transition temperatures (T=340 and 393K), which means that these modes are not directly connected to the phase transition. However, several bands showed a significant shift in their frequency position and half-width assigned to the internal vibrations of the [(C3H7 )4 N]+cation. The position and width at half maximum for the selected lines obtained between 320 and 1600cm-1 are depicted in (Figure 4a & 4b). The band related to the temperature dependence of the rocking vibration (ρr(CH2)) located at 334cm-1 showed a variation in its position to the low wavenumber by 2cm-1 in the first transition and to the high wavenumber by 4cm-1 in the second transition (T2). Besides, the half-width of this band shifts to low frequency by 7cm-1before the first transition (T1) and by 6cm-1 after the second transition (T2).The peak observed at 780cm-1 is assigned to the symmetric stretching vibration of ν1(NC4) which is decreased by 3cm-1 and half-width is increased by 12cm-1 before the second transition. The wavenumber of bands located at 872cm-1 and 847cm-1,whichisassigned to the (δs(CH3)+ δs(CH2)) and (δs(C-N-C)+δs(C-C-C)), respectively is decreased by 3cm-1 at around 393K. It is clear that the bands located at 1350cm-1 assigned to the symmetric bending vibration of δs(CH3)have vanished above the second transition (T2).The anti-symmetric bending vibration of δas(CH3)) observed at 1460cm-1 presents a variation in the position by 9cm-1 , while the half-widths increase by 10cm-1 at T2K. The temperature dependence of the Raman spectra in the region of the stretching symmetric-and asymmetric vibrations between 2600 and 3200cm-1 is presented in (Figure 5a & 5b). The biggest change in the band position is observed for the mode at 2955cm-1 associated with the asymmetric stretching vibration of νas(CH2). This band vanishes above the second transition (T2). The band at 2905cm-1related to the symmetric stretching νs(CH2) mode shifts to higher wavenumber by 4cm-1 at the second transition. A significant jump in the half-width of this band is observed at T2. Then, the anti-symmetric stretching vibration of νas(CH2) observed at 2934cm-1 presents a position variation by 3cm-1 , while the half-widths increase by 8cm-1 at T2K. On the other hand, the band related to the temperature dependence of asymmetric stretching vibration of νas(CH3) located at 2970cm-1 shows a variation in its position to the high wavenumber by 2cm-1 at T1 and 4cm at T2, and in its half-widths by 5cm-1around the second phase transition.
Figure 3: Evolution of the Raman spectrum as a function of temperature: a. from 100-320cm-1, b. from 320-1000cm-1, c. from 1000-1600cm-1and d. 2600-3200cm-1

Figure 4: Evolution of certain positions Raman (a) and (b) width at mid-height as a function of the temperature in the region 320-1600 cm-1.

Figure 5: Evolution of certain positions Raman (a) and (b) width at mid-height as a function of the temperature in the region 2600-3200cm-1.

The important changes in the Raman spectra are observed at 393K for some internal modes of cationic parts, which suggests that the dynamics of the [N(C3H7)4]+ cationic parts evidence the contribution of the mechanism of phase transition [18]. In order to verify that the phase transitions are correlated with changes in the dynamical state of the cationic groups, a quantitative study about the band located at 2970cm-1(νas(CH3))was realized.
Temperature dependence of the wavenumber
The temperature dependence of the Raman wavenumber of a phonon connected to an order-disorder mechanism according to Andrade and Porto [19] can be described by:
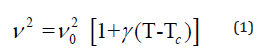
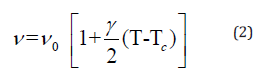
Where γ is the thermal coefficient and ν0 is the “hard-core wavenumber” at temperature transition (Ttr). Generally, the values of γ are small so that we can approximate Eq (1) by [20]:
The thermal coefficient depends on the variation of the wavenumber position and the volume of the crystal according to the following expression:
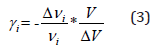
whereand are the variations of the volume and of the wavenumber position, respectively, symbolizes the original volume and the band position of the i mode at room temperature.
Figure 6: Temperature dependence of the band position at 2970cm-1.

According to the approximation of Gruneisen, the relative change of any vibration is directly proportional to the relative change in the volume [21]. Figure 6 shows the dependency of the Raman wavenumber versus the temperature of the analyzed band at 2970cm-1fitted using Eq. (2). We obtain the expansion coefficient γ = 5.1210-3K for T<T1, γ = 5.0810-3K for T1<T<T2 and γ = 5.10-3 for T>T2. Hence, the decrease of the thermal coefficient related to the changes of the wavenumber position indicates an increase of the cell volume due to a structural transformation. Indeed, an important weakening of the Vander Waals interaction and the CH3 groups involved in the C-HCl Vander Waals interaction gain motional freedom [22].
Temperature dependence of the full width of half maximum
To verify that the phase transitions are correlated with changes of the [N(C3H7)4]+ groups, we followed the analysis of the full width at half maximum (FWHM), which is based on the theory used for the damping associated with an order-disorder mechanism. The analysis of the full width at half maximum (FWHM) described by Carabatos-Nedelec and Becker was followed [23]. The temperature dependence of the band-width is described by [24].
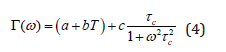
where, , is the phonon wavenumber and is the mean reorientation time of the atoms to jump from one potential to another; it is given by
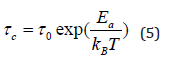
where, is the activation energy for the mode connected to the order/disorder transition, is the Boltzman constant, is the relaxation time at infinite temperature. Eq. (4) can then be written by:
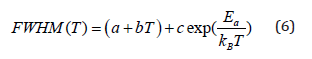
Figure 7: Temperature dependence of the band half-widths at 2970cm-1.

The linear part of Eq. (6) corresponds to the vibrational relaxation and the exponential term corresponds to the reorientational relaxation. The latter is connected to the thermal molecular reorientational motions of a diffusive nature. The thermal variation of FWHM of the band located at 2970 (νas(CH3)) is plotted in Figure 7. the activations energies obtained by fitting with Eq.(6) are: Ea1=112 kJmol-1 in region I, Ea2=110 kJmol-1 in region II and Ea3=88 kJmol-1 in region III. In fact, the decrease of activation energy is probably due to the decrease of the population involved in this vibration which can be due to the change of the conformation of the [N(C3 H7 )+ ] cation [25].
Impedance studies
Impedance spectroscopy is the most reliable technique to study the electrical properties and processes of the materials. It gives a direct correlation between the response of a real system and an idealized model circuit composed of discrete electrical components [26]. The complex impedance data (-Z’’vsZ’) of [N(C3H7)4]2ZnBr4 compound for some representative temperatures are shown in Figure 8. All these plots are formed by two semi-circles. Thus, the lower frequency dispersion corresponds to the grain boundary and the higher one to the interior grain [27]. In other words, the centers of semicircles that compose the total electric response are centered below the real axis (Z), which confirms the presence of non-Debye type of relaxation in the materials. The impedance data have been fitted to an equivalent circuit model consisting of two parallel R-CPE circuits connected in series (Figure 8).
Figure 8: Complex impedance plots at different temperatures of [N(C3H7)4]2ZnBr4 Compound inset figure 8 equivalent circuit of the [N(C3H7)4]2ZnBr4 Compound.

The impedance of the constant phase element (ZCPE) is given by the following equation [28]:
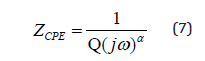
Where, Q indicates the value of the capacitance of the CPE element and α is the degree of deviation with respect to the value of the pure capacitor.
The real and imaginary components of the whole impedance were calculated according to the following expressions:
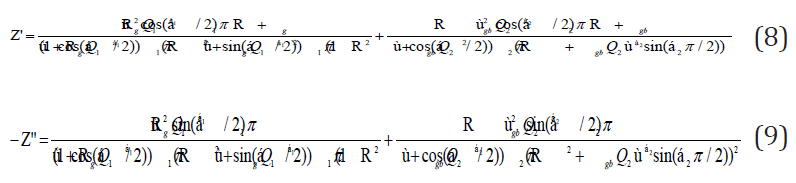
The refinement results performed using the selected electrical model are summarized in Table 2. Let (Rg, Rjg) and (Qg, Qjg) be the resistance and capacitance of the CPE element of grains and grain boundaries, respectively, whereas α (0< α< 1) is the fractal exponent. In order to check the choice of equivalent circuit, we present in (Figure 9a & 9b) the variations of the experimental values of Z′ and Z′′ at some temperatures versus to the simulate dones calculated using the parameters extracted from the equivalent circuit. From this figure, It is obvious that the slope obtained from a fit linear of these curves at each temperature is substantially equal to the unity. The good accordance between the experimental and theoretical data indicates that the used equivalent circuit describes reasonably well the electric properties of Bis-Tetrapropylammoniumtetrabromozincate sample. The continuous current (dc) conductivity from the grain contribution can be determined from the following expression
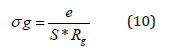
Where, e and S are respectively the thickness and the area of the pellet.
Figure 9: Measured and calculated values of the real part of the complex impedance Measured and calculated values of imaginary part Z”.

Table 2: The equivalent circuit parameters for the [N(C3H7)4]2ZnBr4 Compound.

Figure 10: Temperature dependence of Ln(σgT) versus reciprocal temperature for [N(C3H7)4]2ZnBr4 Compound.

The thermal evolution of the bulk conductivity is shows in Figure 10. It was observed that the σg increases with the increase of temperature and follows the Arrhenius behavior, which is given by
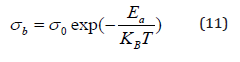
Where, Ea is the activation energy, A is the pre-exponential factor and kB is the Boltzmann’s constant.
All phase transitions appearing in the Raman spectroscopy are affirmed by the change of the curve slope at T1 and T2. The values of the activation energy determined from the linear adjustment to the data points are Ea(I)=0.38eV in region I, Ea(II)=0.61eV in region II and Ea(III)=0.44eV in region III. It is worth noticing that the variation in the activation energies values can be explained by the movement in the cationic and anionic parts. As well as, it is probably, the mobility of the charge carriers is due to a hopping mechanism [29]. Then, a study of the ac conductivity for the sample was carried out to identify the origin of the conduction process. This makes it possible to study the transport mechanism of charge carriers as well as their interactions as a function of frequency [30].
Figure 11: Frequency dependence of the AC conductivity at various temperatures.

Figure 11 shows the evolution of the ac conductivity as a function of angular frequency. Depending on the frequencies domain, two regions are clearly distinguishable. Firstly, the appearance of a plateau at a low frequency region (<0.1MHz), which increases with temperature, reflecting the direct current conductivity σdc due to the motions of charge carriers [31]. The second regime is observed at a higher frequency (>0.1MHz) corresponding to ac conductivity. The frequency at which the dispersion takes place is called frequency hopping.
Generally, the conductivity dispersion is analyzed using Jonsher's power law [32]:
σAC(ω)=σdc+Aωs (12)
where, σdc is the direct current conductivity, A is a constant depending on temperature and s is an exponent representing the degree of interaction between mobile ions and surrounding lattices [33].
To determine the predominant conduction mechanism of the ac conductivity for the title compound, different theoretical models correlating the conduction mechanism of ac conductivity with the exponent s (T) [33] are used .The variation of exponents(T), which is obtained by the fitting of the experimental data of ac conductivity, is plotted as a function of temperature in Figure 12. It is clear from this figure that the exponent s decreases with the rising temperature below and above the first phase transition (T1=340K) and increases with the increasing temperature above the second phase transition (T2=393K). This result implies that the correlated barrier hopping model (regions I and II) and the non-overlapping small polaron tunneling (region III) model are the most probable models to describe the ac electrical conduction for the crystal in this range temperature.
Figure 12: Temperature dependence of the frequency exponent s.

Conclusion
In summary, it can be said that a novel organic-inorganic hybrid compound, [N(C3H7)4]2[ZnBr4], has been successfully synthesized at room temperature by slow evaporation. The Raman spectra at several temperatures were studied. It is clearly shown that the important changes in the Raman spectra are observed for some internal modes of cationic parts [N(C3 H7 )+],which means that these modes are directly connected to the phase transition. Besides, the complex impedance analysis revealed the contribution of the grain and the grain boundary to electrical properties. In fact, a detailed analysis of the arcs revealed that the equivalent electrical circuit of this sample could be regarded as two elements (R/CPE) in series. Finally, the frequency- dependent (ac) conductivity has been interpreted in terms of Jonscher’s law. Then, the temperature dependence of s is investigated to understand the conduction mechanism in the different regions, which is attributed to the CBH model in regions I and II and the NSPT model, in region III.
References
- Allouche F, Selmi W, Zid MF, Benlecheb T (2019) Theoretical and experimental study of new hybrid compound rich in hydrogen bonding: 2-carboxyanilinium hypophosphite. Journal of Molecular Structure 1179: 756-763.
- Siegel R, Feininger E, Metzger S, Lippert B (1998) Metalated nucleobase quartets: Dimerization of a metal-modified guanine, cytosine pair of trans-(NH3)2PtII and formation of CH···N Hydrogen Bonds. J Am Chem Soc 120(46): 12000-12007.
- Ben Bechir M, Karoui K, Tabellout M, Guidara K, BenRhaiem A (2014) Alternative current conduction mechanisms of organic-inorganic compound [N(CH3)3H]2ZnCl4. Journal of Applied Physics 115: 153708.
- Ostrowski A, Cizman A (2008) EPR studies of line width anomalies at phase transitions in [N(C2H5)4]2MnCl4. Physica B: Condensed Matter 403(18): 3110-3113.
- Karoui K, Ben Rhaiem A, Guidara K (2012) Dielectric properties and relaxation behavior of [TMA]2Zn5Cu0.5Cl4 compound. Physica B: Condensed Matter 407(3): 489-493.
- Jakubas R (1986) Ferroelectric phase transition in tris (dimethylammonium)nonachlorodiantimonate (III), NH2(CH3)2]3Sb2Cl9. Solid State Communications 60(4): 389-391.
- Ben Bechir M, Karoui M, Tabellout K, Guidara M, Ben Rhaiem A (2018) Dielectric relaxation, modulus behavior and thermodynamic properties in [N(CH3)3H]2ZnCl4. Phase Transitions 91(8): 901-917.
- Tarasiewicz J, Jakubas R, Zaleski J, Baran J (2008) Structural characterization, thermal, dielectric and spectroscopic properties of di(n-pentylammonium) pentabromoantimonate(III): [n-C5H11NH3]2[SbBr5]. Journal of Molecular Structure 876(1): 86-101.
- Mlik Y, Couzi M (1982) On the structures of the low-temperature phases of (CH3)4NMnCl3 and (CH3)4NCdCl3: A Raman scattering and group theoretical study. Journal of Physics C Solid State Physics 15(34): 6891-6906.
- White JG (1963) The crystal structure of tetramethylammonium mercury tribromide, N(CH3)4, HgBr3. Acta Crystallographica 16: 397- 403.
- Chkoundali S, Hlel F, Khemekhem H (2016) Synthesis, crystal structure, thermal and dielectric properties of tetrapropylammoniumtetrabromozincate [N(C3H7)4]2[ZnBr4] compound. Applied Physics A 122(12): 1066-1068.
- Weslati N, Chaabane I, Hlel F (2015) Raman investigation of the order-disorder phase transitions in the 2[N(C3H7)4]SbCl4 Vibrational Spectroscopy 81: 90-95.
- Moutia N, Ben Gzaiel M, Oueslati A, Khirouni K (2017) Electrical characterization and vibrational spectroscopic investigations of order-disorder phase transitions in [N(C3H7)4]2CoCl4. Journal of Molecular Structure 1134: 697-705.
- Hajlaoui S, Chaabane I, Oueslati A, Guidara K, Bulou A (2015) Raman scattering investigation of the high temperature phase transition in[N(C3H7)4]2SnCl4. Spectrochimica Acta A 136: 547-552.
- Ben Brahim K, Ben gzaiel M, Oueslati A, Hlel F, Gargouri M (2019) Synthesis, structural characterization and electrical conduction mechanism of the new organic-inorganic complex: [(C3H7)4N]FeCl4. Materials Research Bulletin 118: 110505.
- Ciupa Litwa A, Ptak M, Hanuza J, Kucharska E, Beć K (2019) Comparative studies of vibrational properties and phase transitions in perovskite‐like frameworks of [(C3H7)4N][M(N(CN)2)3] with M=Mn, Co, Ni . J Raman Spectroscopy 50(10): 1561-1571.
- Maczka M, Ptak M, Gagor A, Sieradzki A, Peksa P, et al. (2019) Temperature-and pressure-dependent studies of a highly flexible and compressible perovskite-like cadmium dicyanamide framework templated with protonated tetrapropylamine. J Materials Chemistry C 7(8): 2408-2420.
- Meekes H, Janner A, Janssen T (1988) Raman and infrared studies of [N(CH3)4]2ZnCl4. J Physic B Condensed Matter 71: 273-285.
- Andradet PR, Porto SP (1974) Hard core phonon frequency at transition temperature. Solid State Communications 14(7): 547-550.
- Jebari F, Becker P, Carabotos-Nédelec C (1994) Order‐disorder phase transition in diethylenetriammoniumchlorocadmate single crystals determined by Raman spectroscopy. J Raman Spectroscopy 25(4): 261-265.
- Lucazeau G (2003) Effect of pressure and temperature on Raman spectra of solids: anharmonicity. Journal of Raman Spectroscopy 34(7-8): 478-496.
- Oussaϊd M, Becker P, Carabotos-Nédelec C (2000) Raman scattering investigation of order-disorder phase transitions in cadmium tris(thiourea) sulphate(CTS). J Raman Spectroscopy 31(6): 529-533.
- Carabatos-Nédelec C, Becker P (1997) Order-disorder and structural phase transitions in solid‐state materials by Raman scattering analysis. J Raman Spectroscopy 28(9): 663-671.
- Wyrzykowski D, Kruszynski R, Kłak J, Mrozinski J, Warnke Z (2007) Magnetic characteristics of Tetrabutylammonium Tetrahalogenoferrates(III): X‐ray crystal structure of Tetrabutylammonium Tetrabromoferrate(III). J Allgemeine Chemie 633(11-12): 2071-2076.
- Ben Brahim Kh, Ben gzaiel M, Oueslati A, Gargouri M (2018) Electrical conductivity and vibrational studies induced phase transitions in [(C2H5 )4N]FeCl4. RSC Adv 8(71): 40676-40686.
- Rahal A, Borchani SM, Guidara K, Megdiche M (2018) Electrical, dielectric properties and study of AC electrical conduction mechanism of Li9,0.1NiV0.5P0.5O4. R Soc Open Sci 5(2): 171472.
- Trigui W, Oueslati A , Hlel F, Bulou A (2017) Raman scattering and alternative current conduction mechanism of the high‐temperature phase transition in [(C4H9)4N]3Bi2Cl9. J Raman Spectroscopy 48(12): 1718-1724.
- Rhimi T, Toumi M, Khirouni K, Guermazi S (2017) AC conductivity, electric modulus analysis of KLi(H2PO4)2 Journal of Alloys and Compounds 714: 546-552.
- Hao J, Bai W, Li W, Zhai J (2012) Correlation between the microstructure and electrical properties in high‐performance (Ba85Ca0.15)(Zr0.1Ti0.9)O3 lead‐free piezoelectric ceramics. J American Ceramic Society 95(6): 1998-2006.
- Brahma S, Choudhary RP, Shivashankar SA (2012) Structural, thermal and electrical characterization of NdLiMo2O8 electroceramics, using impedance spectroscopy. Journal of Physics and Chemistry of Solids 73(2): 357-362.
- Sentürk E, Koseoglu Y, Sasmaz T, Alan F, Tan M (2013) RC circuit and conductivity properties of Mn6Co0.4Fe2O4 nanocomposite synthesized by hydrothermal method. Journal of Alloys and Compounds 578: 90-95.
- Jonscher A (1977) The ‘universal’ dielectric response. Nature 267: 673-679.
- Elgahami H, Trigui W, Oueslati A, Hlel F (2019) Structural, thermal analysis, and electrical conductivity of new organic-inorganic [(C4H9)4P]SbCl4 Ionics 25(3): 1359-1371.
© 2020 Abdelhedi Aydi. This is an open access article distributed under the terms of the Creative Commons Attribution License , which permits unrestricted use, distribution, and build upon your work non-commercially.
Editor In Chief


.jpg)


Signup for Newsletter

Quick Links
 Editorial Board Registrations
 Submit your Article
 Refer a Friend
 Advertise With Us
Our Recent Edition

.jpg)


Top Editors


.jpg)


.bmp)
.jpg)
.png)
.jpg)


.jpg)


.png)

.png)


.png)


Financial Support

Sponsors

Latest e-Books

Latest Video

 a Creative Commons Attribution 4.0 International License. Based on a work at www.crimsonpublishers.com.
Best viewed in
a Creative Commons Attribution 4.0 International License. Based on a work at www.crimsonpublishers.com.
Best viewed in