- Submissions

Full Text
Research & Development in Material Science
Test of Surface Roughness for Bipolar plates for Vanadium Redox Flow Batteries and Biological Fuel cells
Hickmann T*
Eisenhuth GmbH & Co. KG, Germany
*Corresponding author: Hickmann T, Department of Electrical/Electronic Engineering, Faculty of Engineering, Nigeria
Submission: August 28, 2020;Published: September 15, 2020

ISSN: 2576-8840 Volume 14 Issue 1
Abstract
Modern energy systems such as redox flow batteries (RFB) or biological fuel cells (BFC) are becoming increasingly popular in the specialist trade [1-5]. Despite a number of demonstrative tests and the increasing number of media representations [4-7], up to now the systems are cost-intensive and for some components like bipolar plates are only a few materials are usable like original carbon materials. So, the development and knowledge in processing of the components are essential for the economic efficiency of the systems. However, it is necessary to look at the surface structure of the materials as one of the parameters defined by different production methods and after-treatment. There are some measurement methods commercially available, which are tested on different samples and generate different values. It can be concluded that optical methods are more suitable than mechanical ones.
Keywords: Vanadium redox flow batteries; Biological fuel cells; Graphite compound; Bipolar plates;Surface roughness
Introduction
In order to define the surface roughness, it is necessary to define the parameters. Common parameters are the arithmetic average called Ra and the average of maximum peak to valley height of profile called Rz. The arithmetic and averaged maximum peak height are looked for in order to describe the surface quality of graphite compound panels from different manufacturing and aftertreatment processes. The corresponding measurements are taken relatively locally so that either a wide range of measuring points or always the same points have to be checked in order to obtain comparable, meaningful results. The surface roughness has a significant impact to the contact resistivity of the graphite material to the connecting parts like electrodes [8].
Test Method
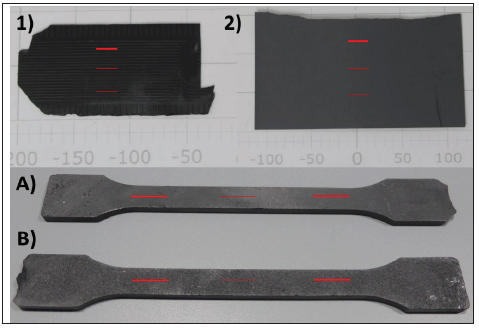
Figure 1: Pictures of some of the samples. The red lines show exemplary the starting and end point of one measurement run.

In this study samples like shown in Figure 1 are used for the evaluation of the measurement methods. The samples 1, 2, A and B are made by injection moulding and are partially sand-blasted. In the case of samples A and B different sand-blasting materials are used. The sample 3 is made by compression moulding and is milled afterwards. The samples are samples out of production (samples 1-3) or specially produced specimens for different tests (samples A-B).
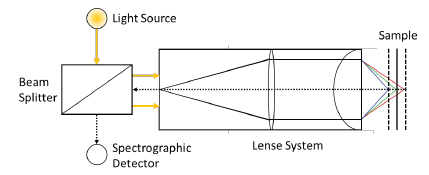
The analysis works with the measuring device MicroProf®, which operates based on a white light distance measurement. The measuring process uses the chromatic aberration of lenses, thus the wavelength dependent refraction index, with the sample being lighted by focused white light (halogen lamp). A system of passive lenses with large chromatic aberration vertically subdivides the white light into focusing points of different colours and height.
When focused light hits a surface, this light - contrary to non-focused light - is perfectly reflected. It arrives through the same system of lenses and a fiber optic cable at a miniature spectrometer. Thus, the wave length (colour) of the electric light indicates via a calibration table the distance between sensor and sample. The vertical resolution capacity amounts to 10nm, the lateral resolution capacity is defined by the size of the light spot with a diameter of 1-2μm (Figure 2).
Figure 2: Measuring principle of the white light distance measurement with a chromatically coding sensor.

Parallel tot he optical measurement, a surface roughness tester SRT 5000 was used.. This device measures via a lens the roughness of a surface by means of the deflection of a needle, which connected to a spring is drawn or scratched respectively in parallel with the surface. The spring is connected to a height measurement device. The roughness tester is checked prior to the measurement on a calibration object.
AResults and Discussion
In the Table 1, the results of the two measurement methods are recorded and compared. Strong differences can be noticed between the results. On the other hand, the deviations between the results of one method of the three measuring lines are relatively similar. With regard to the interpretation of the measured results and the recorded differences between the methods the sample 3 shows the maximum surface quality, assuming a relative accuracy of the white light process.
Table 1: Measurement results of surface roughness for samples 1-3.

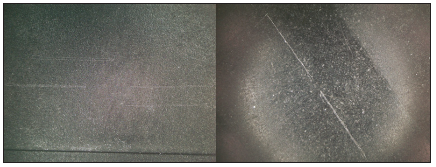
The sample 3 has been machined, whereas the sample 2 with the highest roughness has been sand-blasted, a fact that goes with the high value. The sample 1 shows at the measurement with the needle process the lowest value, but also the biggest difference referred to the results by the white light measurement. This is in line with the origin of the sample as it stems from injection mould and being composed of a significantly more fluid material. As the calibration of the surface roughness tester has been accomplished successfully, intuitively the differences between the results of the two measuring methods should not be so dramatic. However, the surface seems damaged by the scratching of the needle, so it is assumed that the results are lower than they should be. This was confirmed by a microscopy of the samples, shown in Figure 3. As the tested material is a graphite compound, it appears to be too soft for the method. Additionally, as described above the sample 1 consists of a more fluid material and is therefore much softer according the material data sheets.
Figure 3: Microscopy pictures of the surfaces of sample 1 (left) and 3 (right) after the mechanical roughness measurement.

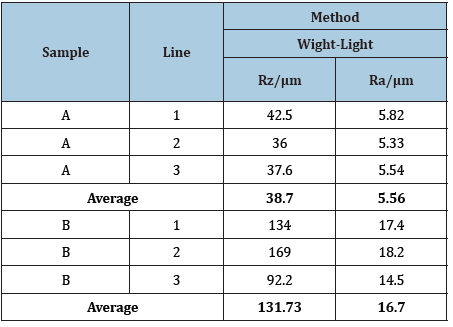
Results of the optical surface roughness test from samples A and B are listed in Table 2. Sample A is sand-blasted with glass pearls like the sample 2. Sample B is sand-blasted with corundum particles. The spherical structure of the glass pearls seems to leave minor changes in the surface structure compared to the sharp corundum particles.
Table 2: Measurement results of surface roughness for samples A-B.

Conclusion
It is shown, that optical methods are more likely to show respectable results for the surface roughness measurement. Regarding the surface roughening methods, especially a Rz from over 100µm is problematic, if for example the flow field structure of a plate is complex and fine structured. Damage on these structures should be avoided, so the processing or rather after-treatment methods for roughening the surface are limited. They should be selected wisely and tested beforehand.
At the moment a high surface quality is mostly requested, so this objective is achieved for example by sample 3, but development in tool making should result in the production of similar surface qualities via injection moulding. The milling process in which the sample 3 is made is matured but is also very time consuming and is therefore expensive. Injection moulding is a preferred method for mass production.
Acknowledgement
The author thanks the Federal Ministry of Economy and Energy for the donation in the project ‘ContiBio-Elect’ and ‘Demo Bio BZ’. Additionally, thanks to KIMW Prüf- und Analyse GmbH for the measurements with their white light distance measurement device.
References
- Skyllas KM, Chakrabarti M, Hajimolana S, Mjalli F, Saleem M (2011) Progress in flow batters research and development. Journal of the Electrochemical Society 158 (8): R55-R79.
- Weber A, Mench M, Meyers J, Ross P, Gostick J, et al. (2011) Redox flow batteries: A review. Journal of Applied Electrochemistry 41: 1137-1164.
- Noack J, Roznyatovskaya N, Fischer P (2015) The chemistry of redox-flow batteries angew. Chem Int Ed 54(34): 9776-9809.
- Quarthal D, Novotyn J, Oetken M (2017) Farbspiel in redoxflussbatterien. Nachrichten Aus Der Chemie 65(6): 672-675.
- Rosenberg D, Pansegrau S, Wachholz M, Rehling A, Busker M, et al. (2017) Redox-flow-batterien-organische batterien mit zukunftsperspektiven. Chemkon 24(4): 325-340.
- (2017) Medienpaket der Siemens-Stiftung zum thema, kondensator, wasserstoff, redox-flow-wir speichern regenerative Energie, Germany.
- Hempelmann R (2015) Redox-flow-batterie. In: Mischnick P, Deusing GI (Eds.), Chemistry and energy - what is there? What should I do? Germany, pp. 38-39.
- Avasarala B, Haldar P (2009) Effect of surface roughness of composite bipolar plates on the contact resistance of a proton exchange membrane fuel cell. Journal of Power Sources 188(1): 225-229.
© 2020 Hickmann T. This is an open access article distributed under the terms of the Creative Commons Attribution License , which permits unrestricted use, distribution, and build upon your work non-commercially.
 a Creative Commons Attribution 4.0 International License. Based on a work at www.crimsonpublishers.com.
Best viewed in


.jpg)


 Editorial Board Registrations
 Submit your Article
 Refer a Friend
 Advertise With Us
.jpg)


.jpg)


.bmp)
.jpg)
.png)
.jpg)


.jpg)


.png)

.png)


.png)


