- Submissions

Full Text
Research & Development in Material Science
Investigation by Thermal Cycle Simulation of Heat Affected Zone in Welded AA2014 Aluminum Alloy
Elhadj Raouache1, Zakaria Boumerzoug2,*, Fabienne Delaunois3, Valdez-Castro L2 and Fares Khalfallah4
1Department of Civil Engineering, Algeria
2Mechanical Engineering Department, Algeria
3Metallurgy Department, Belgium
4Department of Physics, Algeria
*Corresponding author: Zakaria Boumerzoug, Mechanical Engineering Department, University of Biskra, Algeria
Submission: April 30, 2020;Published: May 12, 2020

ISSN: 2576-8840 Volume 13 Issue 3
Abstract
This paper is a contribution to the study of weld ability of AA2014 aluminum alloy by using thermal cycle simulation. It presents the microstructures obtained after thermal cycle simulation of welding by rapid heating and cooling treatments in a specific simulation equipment. Optical microscopy, X-ray diffraction, and micro hardness measurements were used as characterization techniques. Micro structural and mechanical details of the heat affected zone of the real welded joint realized by TIG welding process were compared to the simulated heat affected zone by the thermal cycle simulation in specific equipment.
Keywords: Thermal cycle simulation; AA2014 aluminum alloy; HAZ; Welding; Microstructures; Micro hardness
Abbreviations: HAZ: Heat Affected Zone; TIG: Tungsten Inert Gas; XRD: X-Ray Diffraction; BM: Base Metal; FZ: Fusion Zone; Hv : Hardness Vickers
Introduction
Now a days, the objective of the manufacturing industries is to achieve the economical welding condition. The reduction of experimental time and cost have crucial role for selecting the best parameters in economical way. A lot of welding processes like arc welding, gas welding, thermal welding and friction welding are normally used in the manufacturing industries [1].
The aluminum alloys used in aircraft have usually been unsuitable for fusion welding and have previously been riveted. Aluminum alloys, such as AA2014, can be joined without cracking related problems by most fusion and solid-state welding processes. Tungsten Inert Gas (TIG) welding is a fusion welding process widely used for joining ferrous and nonferrous metals [2].
Heat generated during welding induces an important temperature gradient in and around the welded area. The region outside the welded joint that is thermally affected by the welding treatment is known as the heat-affected zone (HAZ) [3]. The properties and microstructure of the HAZ are affected by the thermal cycle. The mechanical properties of the welded metal and the HAZ are closely related to their microstructures, which are dependent on the chemical composition of the material and the thermal history (cycles) due to the welding processes [3,4]. The effect of HAZ has on the strength of the welded materials can be crucial, because HAZ is often the cause of future damage of many devices in which welding technology was used for their repair [5]. For these reasons, it is necessary to investigate this narrow zone in welded metal.
However, the investigation of the HAZ in the real weldments is not easy, because it is not possible to obtain an appropriate specimen at very narrow locations in the HAZ [6,7].
Weld thermal cycle simulation can be used for optimizing the welding technology since it enables some mechanical testing for properties that cannot be made on real welded joints because of small width of HAZ [8]. For example, in our previous contribution to the understanding of the different microstructures in welded joints of Inc 738 LC super alloy using the thermal cycle simulation [9], we found that the obtained microstructures by thermal cycle simulation of welding correspond to those observed in the same zone of the real welded joint realized by TIG welding.
In this work, we studied the effect of heat treatment obtained by a thermal cycle simulation on AA2014 alloys microstructure, and we compared our observations to the real welded joint by TIG welding process.
Experimental Procedure
Aluminum alloys AA2014 were used as a base metal (chemical composition is given in Table 1). The real welded specimens are 10mm thick 10×57mm2. The welding experiments were carried out using a TIG welding machine (Make: Technology 232 AC/DC –HF/ LIFT) with a speed of 0.1m/min, and welding current 70A.
Table 1: Chemical composition of the AA2014 aluminum alloy.

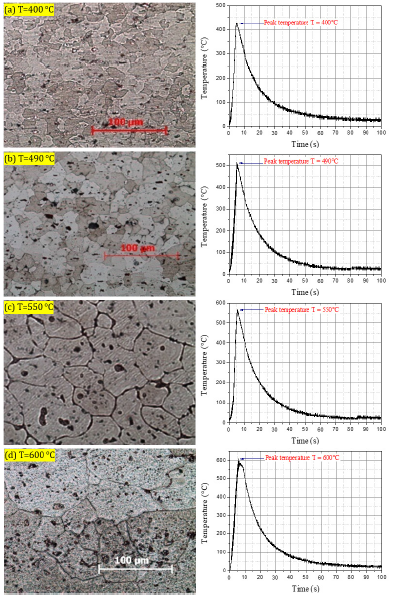
The thermal cycle simulations are performed in appropriate equipment (Smit weld CTS1405 simulator) (Figure 1). The power sources are provided by electro resistance and electro induction that facilitate and control heating rates. The Smitweld CTS1405 simulator is equipped to carry out computer-controlled temperature cycles that consist of a rapid heating followed by a cooling treatment. Peak temperatures of 400 °C, 490 °C, 550 °C, and 600 °C were used for the thermal cycles (Figure 2) [10,11].
Figure 1: Smitweld thermal cycle simulator.
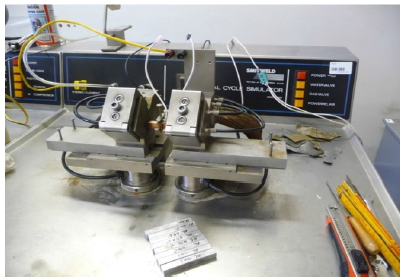
Figure 2: Equilibrium diagram of Al-Cu with a point in the HAZ, which will be obtained by thermal simulation [10,11].

The specimens for metallographic examination were polished using different grades of emery papers. Final polishing was done using the diamond compound (0.5μm particle size) in the discpolishing machine. Specimens were etched with Keller’s reagent to reveal the microstructure. Vickers’s micro hardness testing machine was employed for measuring the hardness of the specimens with 0.1kg load. X-ray diffraction instrument of X’PERT PRO MPD » of Philips type was used. The XRD analysis was carried out using Cu Kα target at a working voltage 40kV and current 30mA.
Results and Discussion
The microstructure observed in real welded joint realized by TIG welding is shown in Figure 3. Three different zones are presented:
Figure 3: Equilibrium diagram of Al-Cu with a point in the HAZ, which will be obtained by thermal simulation [10,11].
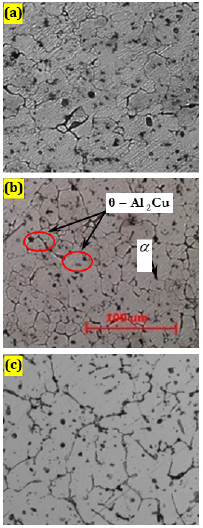
1) Base metal (BM): corresponds to the part of unaffected zone of the welded metal (Figure 3a).
2) Heat affected zone (HAZ): There is a slight difference between the microstructure of the BM and the HAZ. However, finer grains were formed in this zone (Figure 3b).
3) Fusion zone (FZ): The microstructure of this zone is due to the faster heating and fast cooling of weld metal [2,10]. Compared to the base metal (Figure 3a) and HAZ (Figure 3b), a significant grain growth was visualized at the fusion zone (FZ) (Figure 3c).
Microstructures after thermal cycleFigure 4 illustrates the microstructures obtained after each thermal cycle. For example, Figure 4a shows the microstructure obtained after a thermal cycle with a peak temperature of 400 °C. It is characterized by homogeneous structure and it is not different to the structure of the base metal. The same microstructure is observed after thermal cycle with a peak temperature of 490 °C (Figure 4b). However, increasing the peak temperature to 550 °C induces a variation in grain size, and phenomenon of liquefaction in grain boundaries (Figure 4c). Finally, a thermal cycle with a peak temperature of 600 °C resulted in an exaggerated grain growth reaction (Figure 4d). The investigation of the simulated HAZ by the thermal cycle simulation technique has given more micro structural information. This result is in agreement with our recent work performed on stainless steel 304L [12], where it was found that the HAZ is not a homogeneous structure but it is formed with different subzones.
Figure 4: Microstructures of AA2014 aluminum alloy after simulation welding process and their plotted temperature-time during the welding thermal cycle.
Results of X-Ray diffraction
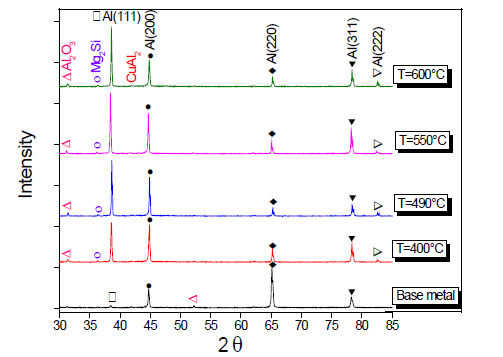
Figure 5 illustrates the X-ray diffraction (XRD) patterns obtained from aluminum alloy samples submitted to different thermal cycle’s simulation (400 °C, 490 °C, 550 °C, and 600 °C). For comparative study, the XRD pattern of the real welded joint of AA2014 Aluminum alloy is included in Figure 5. According to Figure 5, there are no evidence of phase changes when comparing between base metal, welded zones and the sample obtained by thermal cycle’s simulation on Aluminum alloy. This shows that the welding process does not produce enough heat which causes phases changes within the material due to the onset of melting and re-solidification. However, a new texture was developed during the increase of the temperature of the base metal, because the intensity of the peak (111) is very low in the base metal which increases by the increase of the peak temperature of the thermal cycle. On other hand, the intensity of the peak (200) decreases by the increase of the peak temperature. In general, this crystallographic transformation is due to the reorganization of grains. However, there was not a real phase transformations after different thermal cycles, because the same phases revealed in the base metal have been detected by XRD in the heat treated samples by thermal cycle simulations.
Figure 5: X-ray diffraction diagrams from the base metal, samples obtained after each thermal cycle of AA2014 aluminum alloy.
Hardness measurements
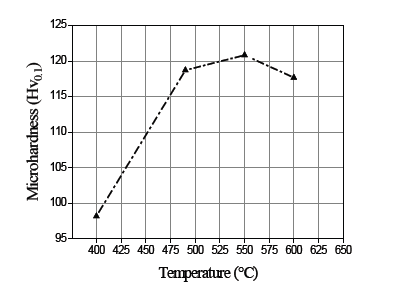
In the welding process, hardness measurements give a general idea of the micro structural transformations and the variation of the local mechanical properties [10]. Hardness measurements were performed on real welded joint by TIG process and also on samples treated by thermal cycle simulation, and the results are presented in Figure 6 & 7 respectively. In real welded joints, the lowest hardness (70Hv) is found in the HAZ, however the FZ has the highest hardness values. The common zone, situated between HAZ and FZ, the hardness reaches the maximum value (117Hv). According to the profile hardness variation from the HAZ to FZ (Figure 6), there is an increase in hardness value from 75Hv to 117Hv which corresponds approximatively to the hardness evolution in simulated samples from 98Hv to 121Hv (Figure 7). It can be concluded, there is a similitude between this limited zone in real welded joint (hardness curve indicated by square) and the shape of the hardness curve plotted from the simulated samples. This increase in hardness is mainly due to the refinement of the microstructure by recrystallization, as appeared in Figure 3b. However, in the fusion zone, the significant increase in temperature leads to the dissolution of strengthening precipitates and grain growth which cause a remarkable degradation of hardness. In addition, we can consider that the width of the HAZ is between 1 and 2mm.
Figure 6: Hardness profile variation of real welded joint of AA2014 aluminum alloy.

(HAZ: Heat Affected Zone; BM: Base Metal; FZ: Fusion Zone; Hv : Hardness Vickers )
Figure 7: Curve of measured hardness values corresponding to different thermal cycle’s simulation of AA2014 aluminum alloy. (Hv : Hardness Vickers )
Conclusion
Heat affected zone of the real welded 2014 aluminum alloy realized by TIG process was investigated by the thermal cycle simulation of the base metal. From thermal cycle simulation, the increase of temperature leads to hardness increase and microstructure changes. There was a similarity between the hardness profile of HAZ of the real joint and simulated HAZ obtained from thermal cycle simulation of the base metal. HAZ is not a homogeneous zone but it is composed with different subzones and each subzone has its microstructure (grain size) which depends on heating temperature. There was not a phase transformation of the base metal after thermal cycle simulation.
Acknowledgement
Authors wish to express their deep thanks to WBI, University of Mons, and DGRSDT for their support.
References
- Ganesan M, Marimuthu P (2016) Experimental investigation of tensile strength behavior on friction welded austenitic stainless steel grade 304L joints. International Journal of Applied Engineering Research 11(2): 1251-1255.
- Shanavas S, Edwin RDJ (2017) Weldability of AA 5052 H32 aluminum alloy by TIG welding and FSW process - A comparative study. ICRAAE-2017 IOP Conf Series: Materials Science and Engineering 247: 012016.
- Boumerzoug Z, Raouache E, Delaunois F (2011) Thermal cycle simulation of welding process in low carbon steel. Materials Science and Engineering A 530: 191-195.
- Chen Y, Wang Y, Gianetto J (2008) Thermal and microstructure simulation of high strength pipeline girth welds. In Proceedings of the 18th International Offshore and Polar Engineering Conference, Vancouver, Canada, pp. 33-39.
- Sloderbach Z, Pajak J (2005) Determination of ranges of components of heat affected zone including changes of structure. Archives of Metallurgy and Materials 60(4): 2607-2612.
- Samardžić I, Stoić A, Kozak D, Kladaric I, Dunđer M (2013) Application of weld thermal cycle simulator in manufacturing engineering. Journal of Manufacturing and Industrial Engineering 1-2(12): 7-11.
- Dunder M, Vuherer T, Kladaric I (2010) Weld ability investigation of TStE 420 after weld thermal cycle simulation. Strojarstvo 52(2): 97-104.
- Dunđer M, Samardžić I, Vuherer T (2015) Weld ability investigation steel P91 by weld thermal cycle simulation. Metalurgija 54(3): 539-542.
- Boumerzoug Z, Cherif S (2017) Thermal cycle simulation of welding process in Inc 738 LC super alloy. Key Engineering materials 735: 75-79.
- Feulvarch E (2016) Numerical modeling of the friction-kneading welding process (Friction stir welding). Engineering Techniques.
- Nagendrappa B, Saurabh M, Raman R (2010) Effect of mechanical arc oscillation on Partially Melted Zone (PMZ) microstructure and properties of AA2014 T6 TIG welds. In proceedings of the 12th International Conference on Aluminium Alloys, Yokohama, Japan, pp. 922-927.
- Hamza S, Boumerzoug Z, Raouache E, Delaunois F (2019) Simulated heat affected zone in welded stainless steel 304L. Acta Metallurgica Slovaca 25(3): 251-258.
© 2020 Zakaria Boumerzoug. This is an open access article distributed under the terms of the Creative Commons Attribution License , which permits unrestricted use, distribution, and build upon your work non-commercially.
 a Creative Commons Attribution 4.0 International License. Based on a work at www.crimsonpublishers.com.
Best viewed in


.jpg)


 Editorial Board Registrations
 Submit your Article
 Refer a Friend
 Advertise With Us
.jpg)


.jpg)


.bmp)
.jpg)
.png)
.jpg)


.jpg)


.png)

.png)


.png)


