
- About Us
- Information
-

The Author ensures that the research has been conducted responsibly and ethically with adherence to all relevant regulations. read more..
- For Authors
- For Reviewer
- Manuscript Guidelines
- Membership
- Publication Ethics
-
- Journals
- Reprints
- e-Books
- Videos
- Policies
- Contact Us
 COVID-19
- Submissions


Full Text
Research & Development in Material Science
Role of Distribution and Diffusion Coefficients of Compacted Clay Liner and Geomembrane in Landfills
Md Farhad Hasan*and Hossam Abuel Naga
Department of Civil Engineering, Australia
*Corresponding author: Md Farhad Hasan, Department of Civil Engineering, Australia
Submission: September 20, 2019;Published: September 30, 2019

ISSN: 2576-8840 Volume11 Issue5
Abstract
The research demonstrates the theoretical impact of various parameters on contaminant migration through landfill liners, utilising POLLUTEv7 software. The study considers the impact of varying attenuation by adsorption and effective diffusion coefficients, on the mobility of contaminants through clay and geomembranes. The sensitivity of these parameters was tested in regards their impact on the maximum contaminant concentration in a receiving aquifer under a theoretical landfill scenario. This principally addresses the role of temperature in the diffusion of contaminants through the liners. In order to understand the parametric behaviour, a simple 1D landfill model was developed using the Pollute7 software, and the parameters were tested in the simulation. On the basis of the model analyses, it could be stated that clay distribution and diffusion coefficient measurably affect the most during the contaminant migration through the landfill liners, in particular for inorganics, whereas coefficients concerning geomembranes were found to have marginal or no impact on the aquifer concentration level in the present scenario. Furthermore, it was also found that temperature increases the diffusion process in landfills at a broader range, and hence proper attention is required to study the changes in temperature in landfills
Keywords: Landfill; Clay liner; Geomembrane; Contaminant migration; Pollute7; Distribution coefficient; Diffusion coefficient; Aquifer concentration
Introduction
Landfill is an essential part of the waste management system. Wastes which cannot be reused or recycled, are generally stored in landfills. A typical landfill consists of geomembrane, clay liner, and overlays the prevailing hydrogeological setting, depending on the landfill type and geographic location [1,2]. Solid wastes contain different types of contaminants, such as inorganics, anions, organics, and pesticides. Through the percolation of water and the in-situ generations from waste decomposition contaminants can partition to the aqueous phase (leachate) [1,3]. This leachate is able to percolate through the waste and presents a potential risk of emission through the base of the landfill if not appropriately managed. In landfills, geomembranes and clays materials are often employed as barriers which aim to retard the migration of contaminants [4-6]. Understanding contaminant migration if important to establishing a safe environmental legacy.
Contaminant mobility through landfills occurs by advection, dilution, and dispersion [7], as well as by a number of factors such as the prevailing aqueous geochemistry, adsorption/ desorption reactions and precipitation [8]. In order to determine the contaminant mobility through the landfill liner, it is essential to fully consider these the geochemical processes. Diffusion is associated with the migration of pollutants from an area of high concentration to low, whereas advection is related to the flow of leachate [9-11]. On the other hand, the localised alteration in the groundwater flow which leads to mechanical mixing is defined as dispersion [12-14]. Therefore, in order to ensure safe landfill operations and modelling, adequate knowledge of those transport phenomena and related parameters is required.
The limited advection of the leachate through landfill liners allows for collection and removal of the contaminants from the landfill system. The limited advection through these materials means the mobility of contaminants is highly influenced by the diffusion kinetics [15,16]. During diffusion or advection through the landfill liner, contaminants in the system can be removed from the aqueous phase onto the barrier material through adsorption, controlled by as the specific distribution coefficient of clay (Kd) or geomembrane (Ka) [17-19]. In short, Kd represents the adsorption efficiency of a specific contaminant to a specific solid media under specific geochemical conditions [19,20]. Meanwhile, diffusion of contaminants through the clay liner and geomembrane is expressed by two more coefficients namely, clay diffusion coefficient (De), and geomembrane diffusion coefficient (Dg) [20-25].
In any contaminant migration numerical analysis, the sensitivity of the aforementioned parameters has to be properly understood to precisely predict contaminant migration [7]. In this research, a finite layer approach has been considered to model a 1D landfill using Pollute7 software to assess the role Kd, Ka, De, and Dg have in controlling contaminants. The results provide some basic insight on the influence of each parameter for different contaminants. Based on the model scenario, it was found that clay distribution coefficient (Kd) had the most significant impact on the maximum leachable concentration values due to its ability to attenuate contaminant mass at a bigger range, essentially removing from the system. On the other hand, partitioning to geomembranes had a marginal impact due to having less thickness compared to clay liners. In addition, the influence of temperature on the diffusion coefficient was also investigated which showed that with an increment in temperature, the diffusion procedure increases abruptly.
Mathematical Formulation
The transportation of dissolved contaminants through the subsurface may vary based on the type of soil, degree of saturation, and soil-contaminant interaction [26]. However, in most of the landfill applications associated with the contaminant mobility, the flow is considered in one direction and can be found by utilising the 1D dispersion-advection equation for a layered deposit [27]. This approach takes into consideration advection, diffusion and dispersion of the contaminant and leachate as it migrates through subsurface layers. In the following sections, basic theory on the necessary numerical parameters and boundary conditions for the modelling will be discussed.
Numerical parameters
In numerical analysis, a contaminant transport model is developed to represent a landfill. The model consists of the general governing equations along with the boundary and initial conditions. After developing the model, the governing equations are solved. The 1D contaminant migration is governed by the following equation [27]:
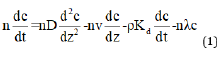
where,
c=contaminant concentration at depth z at time t
D=coefficient of hydrodynamic dispersion at depth z
v=groundwater velocity at depth z
n=porosity of soil
ρ=dry density of soil
Kd=clay distribution coefficient
vs=Darcy velocity
λ=decay constant of the contaminant species
The clay distribution coefficient Kd, is specific for each contaminant and solid material tested. The parameter is utilised in determining the adsorption potential of the dissolved contaminants in contact with the soil. In general, Kd is the ratio of the contaminant concentration associated with the solid to the contaminant concentration in the aqueous solution, considering the fact that the whole system is in equilibrium condition [8]. Kd values are typically derived experimentally [26], however, approaches to mathematical determination can also be used. The following empirical equation provided by [28], which was in fact derived from experimental data:
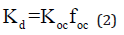
Here, and represent the organic carbon/water partitioning coefficient and weight fraction of organic carbon in the soil, respectively. Meanwhile, the diffusion coefficient of clay, De, is included in the mass flux transportation (f) equation, which can be written as the following [28,29]
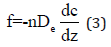
where, De is the clay diffusion coefficient.
On the other hand, if the landfill contains a geomembrane, two other parameters namely, geomembrane distribution coefficient (Ka), and geomembrane diffusion coefficient (Dg), have to be implemented in the numerical modelling. The parameters can be determined by the following empirical equations [14]:
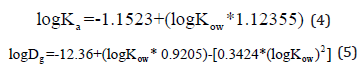
Here, Kow is the octanol/water partition coefficient which is used to model the transportation of dissolved hydrophobic organic compounds in both soil and groundwater.
In general, Equations (4,5) were derived from experimental data, as mentioned in [14]. Figure 1 demonstrates the influences of Kow in both Ka and Dg. It could be observed from Figure 1a that Ka remained indifferent to the increment of Log Kow, and later started to increase exponentially. On the other hand, Dg was much found to be much responsive at low Log Kow, but started to lose dominance as Log Kow ⩾2. This could be explained by comparing Figure 1a and 1b, where Ka started to increase abruptly once Da started to decrease. It means at lower Kow, the geomembrane diffusion coefficient is more dominant than the geomembrane distribution coefficient. Once Ka reached almost 1200, the impact of Dg diminished.
Figure 1: Effect of Log Kow on geomembrane (a) distribution coefficient (Ka), and (b) diffusion coefficient (Dg), based on [14].

Boundary conditions
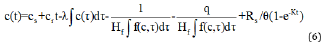
In the 1D approach, top and bottom boundary conditions of the layers have to be defined. The bottom boundary was considered to have an infinite thickness for the ease of the study. However, a finite mass top boundary condition was considered in this study, where the initial source concentration begins at an initial value, and increases with time (t), at a specific rate (cr). As the contaminant is migrated into the soil or collected by a leachate collection system, the concentration decreases. Based on this understanding, the mathematical expression for finite mass top boundary condition can be written as the following [14]:
Here,
cs=constant concentration at the top boundary
= volume of leachate collected/unit area of landfill/unit time
Rs=mass of pollutants in the waste available to be transformed into dissolved over time
= volumetric water content of the waste
=generation coefficient determined based on the conversion
rate half-life K, such that k=ln 2/K
Hf= reference height of the leachate
Reference height of the leachate indicates the leachate volume that would contain the total amount of leachable mass of a specific contaminant at an initial concentration. Therefore, the reference height is equal to the contaminant (M)/unit area divided by the initial source concentration [1].
Methodology
The numerical simulations in this study were carried out by the finite layer approach. The method was applied by using Pollute7 software [7], which uses the finite layer technique and simplifies the governing equations by introducing Laplace transform parameters [17]. The conventional finite difference or finite element method has a plethora of pitfalls, as governing equations have to be discretised, and each and every time and mesh step have to be well-defined [30,31]. Therefore, a finite layer technique could be a reasonably easier technique, where the equations are already included in the system and the semi-analytical solution could be achieved. The solutions were found to be numerically accurate when comparisons were made both qualitatively and quantitatively with finite difference and finite element methods [1]. In the present research, 1D landfill modelling has been performed by finite layer technique. Due to the semi-analytical solution, the total mass flux into the clay or geomembrane barrier was predicted without determining the solution for the entire landfill.
Figure 2 contains the schematic diagrams of the landfill design adopted in this study. The thickness of the clay liner and aquifer were considered to be 1m each. If the geomembrane exists in the system Figure 2b, the thickness was considered to be 1.5mm [32]. Contaminant migration was then simulated through and the concentration changes in the receiving aquifer layer were monitored to determine the maximum concentration. Key parameters were then varied to assess their impact on the concentration in the aquifer.
Figure 2: Schematic diagrams of the landfills considered in this study.

Table 1 shows the basic numerical parameters considered in the simulation technique. If the geomembrane was not present in the system, layer 1 was omitted. The dry density and porosity were considered based on [33]. Although dry density and porosity have significant impacts on the soil mechanics [34], the primary focus was diverted to the clay and geomembrane coefficients. It should be mentioned here that since Kd, De, Ka and Dg vary based on the type of contaminants, no specific value has been mentioned in Table 1.
Table 1:General specification of landfill parameters..

Results and Discussion
Effect of clay distribution coefficient Kd
Figure 3: Changes in maximum leachable concentration as a function of Kd

The clay distribution coefficients for many contaminants in the literature have considerable variability, due to the influence of key environmental attributes. As Kd is considered in the landfill model, it is assumed to infer a liner, zero-intercept relationship between sorbed and non-sorbed species of the contaminant. For the sensitivity analyses, the Kd value was variable, and the rest of the parameters were kept constant. Figure 3 demonstrates that for lead, nickel, and mercury, as Kd increased, the maximum concentration in the aquifer increased concurrently. This behaviour could be attributed to the fact that as the contaminant partitions to the solid phase its concentration in the liquid decreases [33]. It should be mentioned that Figure 3 demonstrates the results for landfills where geomembrane was absent, and hence the contaminant mobility through the compacted clay liners was taken into account. The presence of geomembrane adds an additional barrier in the system, and therefore, the results would turn out to be different.
Role of clay diffusion coefficient De
In this part of the sensitivity analysis, the diffusion coefficient of clay was varied to observe the changes in the concentration at the aquifer. Figure 4 illustrates that as De increased, the concentration in the aquifer increased for both inorganics Figure 4a and anions Figure 4b. For example, for nickel, De=2×10⁻¹⁰m2/s and the concentration in the aquifer it can accept was approximately 0.015mg/L, whereas it increased to 0.047 mg/L as De reached 10×10-10m2/s, despite having the same initial concentration. Therefore, if the maximum aquifer concentration level is lower than 0.047mg/L, the initial concentration has to be increased. It should be mentioned here that most of the contaminants have De between 1×10⁻¹⁰m2/s to 6×10⁻¹⁰m2/s [20]. Meanwhile, iodide and fluoride do not readily adsorb. Therefore, their mobility is more influenced by the diffusion coefficient, and it is unlikely that the trend of increment will remain consistent throughout the process.
Figure 4:Effect of De on-aquifer concentration for (a) inorganics, and (b) anions.

Influence of geomembrane distribution coefficient Ka
Considering the other numerical parameters as constants, increment in the geomembrane distribution coefficient had a negligible impact on the aquifer concentration, as shown in Figure 5. It was found that at Ka≤200mL/g, the concentration at the aquifer remained unchanged, regardless of the type of contaminants (Figure 5a & 5b). This is likely due to the low thickness of the geomembrane (1.5mm), whereas the clay liner was 1m. Therefore, despite Kd remained unchanged, Ka failed to make a reasonable impact on the aquifer concentration.
Meanwhile, as Ka values increased further (more than 200mL/g), the concentration started to decrease slowly. This is due to the fact that as the retention on the geomembrane increases, the concentration at the aquifer should decrease, and a similar pattern could be seen in Figure 5. However, for most of the contaminants, Ka values were found to be between 0.0013mL/g to 0.15mL/g, exempting tributyltin oxide, chlorobenzene, heptachlor, and few more where each of them has Ka=1000mL/g or more [20]. Therefore, it’s unlikely that Ka will have any substantial impact on the aquifer concentration as far as the standard values are concerned.
Figure 5: Impact of Ka on aquifer compliance level for (a) inorganics, and (b) anions.

Impact of geomembrane diffusion coefficient Dg
The rate of diffusion through geomembrane is presented by geomembrane diffusion coefficient (Dg). The values of Dg may vary based on the source and type of the pollutants. In general, charged cations and anions possess extremely low Dg comparing to inorganics. In fact, anion like chloride does not provide any breakthrough during the geomembrane diffusion experiment, and upper bound for the Dg could be as low as 6×10-15m2/s [28]. Thus, it was expected that Dg would have an insignificant impact on the concentration of contaminants.
Figure 6 depicts the changes in the aquifer concentration level as a function of Dg, which is also in accord with the statement in the preceding paragraph. For nickel, there was no change in the aquifer concentration unless Dg was larger than 1×10-14m2/s, and for other pollutants such as mercury, lead or other anions, the increment rate was slower than nickel. It could be referred to the previous discussion regarding Kd that nickel, in fact, has higher Kd than lead or mercury. At this stage, the diffusion rates of the contaminant mobility are dominated by advection and the leakage through the geomembrane holes. At Dg= 1×10-13m2/s, the increment in concentration values could be observed; however, this outcome was recorded keeping other parameters constant, which is unlikely in the practical application. Apart from some organics such as benzene, chloroform, most of the contaminants have low Dg, and there was no contaminant where DeDg [20]. Therefore, in this scenario, Dg has a marginal impact on the aquifer concentration, regardless of the type of contaminants. However, it should be mentioned that Dg might have a significant contribution to contaminant mobility through the landfill liners, depending on the influence of other parameters, and physical properties of geomembranes.
Figure 6: Influence of Dg on aquifer compliance concentration for (a) inorganics, and (b) anions.

Changes in diffusion process with temperature
Temperature is one of the critical factors which influence the diffusion process. Rowe [33] created a database of the normalised diffusion coefficients at different temperatures between 10 ˚C to 65 ˚C, where it was found that diffusive transports of geomembranes were considerably 40% greater at 20 ˚C than that at 10 ˚C. It can be described from the conceptual understanding of the diffusion as a function of temperature. This fluid movement will enhance the diffusion process, particularly through the geomembrane [35,36]. The temperature of the landfills can be affected with changes in time, rate of landfilling of wastes, water content of the waste mass, and the saturated waste thickness [33]. As a result, to develop a realistic landfill design, changes in the diffusion with temperature should be taken into account.
In this study, the changes in diffusion coefficients were recorded as a function of temperature. Figure 7a is a replication from the equation provided by Rowe [33]. Based on the changes in clay diffusion coefficient (De) the numerical analyses were conducted to observe the changes in the aquifer concentration. Therefore, the modified De actually represented the effect of temperature in the diffusion modelling. Figure 7b pinpoints that the concentration at the aquifer increased with temperature, which means the initial concentration to reach the final concentration level will increase. As a consequence, the rate of diffusion through either clay or geomembrane would be higher.
Figure 7: Impact of temperature on (a) De, and (b) aquifer compliance value.

Conclusion
The sensitivity analyses of landfill models during contaminant migration have been conducted by the finite layer method corresponding to the changes in numerical parameters. The research has considered all the important numerical parameters involving potential contaminant transportation through landfill liners such as distribution and diffusion coefficients of clay and geomembrane liners, the effect of temperature, and dry density and porosity of clay. The 1D numerical model was used to interpret the impact of those parameters, and based on this study, the following conclusions can be made:
1) Inorganic contaminant’s mobility is profoundly influenced by clay distribution coefficient (Kd), and clay diffusion coefficients (De). Anions do not generally have Kd values, and their transportation is likely to be affected by the diffusion coefficient (De).
2) Geomembrane coefficients have a marginal impact on the aquifer concentration due to geomembrane’s physical dimension, comparing to that of clay liners. However, this is the result of the present model scenario, and may not necessarily agree with different landfill models.
3) Increment in temperature increases the diffusion, and hence it will increase the aquifer concentration. In that case, the contaminant mobility will be dominated by the diffusion process. Therefore, adequate attention should be provided on changes
Conflict of Interest
The authors declare there is no conflict of interest.
References
- Rowe RK (2004) Barrier systems for waste disposal facilities. (2nd edn), Spon Press, London.
- Yi L, Hossam AN, Qais AR, Md FH (2019) Effect of pore-water salinity on the electrical resistivity of partially saturated compacted clay liners. Advances in Materials Science and Engineering 2019: 1-13.
- Renou S, Givaudan JG, Poulain S, Dirassouyan F, Moulin P (2008) Landfill leachate treatment: review and opportunity. Journal of Hazardous Materials 150(3): 468-493.
- Canter LW, Knox RC (1985) Septic tank system effects on ground water quality. Lewis Publishers, USA.
- Moore JN, Luoma SN (1990) Hazardous wastes from large-scale metal extraction: A case study. Environ Sci Technol 24 (9): 1278-1285.
- Mor S, Ravindra K, Dahiya RP, Chandra A (2006) Leachate characterization and assessment of groundwater pollution near municipal solid waste landfill site. Environ Monit Assess 118(1-3): 435-456.
- Rowe RK, Booker JR (2004) Pollute v7. GAEA Technologies, Canada.
- Krupka KM, Kaplan DI, Whelan G, Serne RJ, Mattigod SV (1999) Understanding variation in partition coefficient, Kd, values. Volume II: Review of geochemistry and available Kd values for cadmium, cesium, chromium, lead, plutonium, radon, strontium, thorium, tritium (3H), and uranium. United states environmental protection agency, USA.
- Allen A (2001) Containment landfills: the myth of sustainability. Engineering Geology 60(1-4): 3-19.
- El Zein A, Rowe RK (2008) Impact on groundwater of concurrent leakage and diffusion of dichloromethane through geomembranes in landfill liners. Geosynthetics International 15(1): 55-71.
- Cuevas J, Ruiz AI, de Soto IS, Sevilla T, Procopio JR, et al. (2012) The performance of natural clay as a barrier to the diffusion of municipal solid waste landfill leachates. Journal of Environmental Management 95: S175-S181.
- Smith JA, Jaffé PR, Benzene transport through landfill liners containing organophilic bentonite. Journal of Environmental Engineering 120(6): 1559-1577.
- Xie H, Lou Z, Chen Y, Jin AM, Chen P (2011) An analytical solution to contaminant advection and dispersion through a GCL/AL liner system. Chin Sci Bull 56(8): 811-818.
- Rowe RK (1987) Pollutant transport through barriers. ASCE Library, pp. 159-181.
- Yildiz ED, Ünlü K, Rowe RK (2004) Modelling leachate quality and quantity in municipal solid waste landfills. Waste Manag Res 22(2): 78-92.
- Leo A, Hansch C, Elkins D (1971) Partition coefficients and their uses. Chem Rev 71(6): 525-616.
- Rowe RK (1988) Eleventh canadian geotechnical colloquium: contaminant migration through groundwater-the role of modelling in the design of barriers. Can Geotech J 25(4): 778-798.
- Barone FS, Rowe RK, Quigley RM (1992) A laboratory estimation of diffusion and adsorption coefficients for several volatile organics in a natural clayey soil. Journal of Contaminant Hydrology 10(3): 225-250.
- O’Connor DJ, Connolly JP (1980) The effect of concentration of adsorbing solids on the partition coefficient. Water Research 14(10): 1517-1523.
- Verge A (2012) Considerations in the design of barrier systems for landfills and lagoons. Queen’s University, Canada.
- Shackelford CD, Daniel DE (1991) Diffusion in saturated soil. II: Results for compacted clay. Journal of Geotechnical Engineering 117(1991): 485-506.
- Rowe RK, Hrapovic L, Kosaric N (1995) Diffusion of chloride and dichloromethane through an HDPE geomembrane. Geosynthetics International 2(1995): 507-536.
- Sangam HP, Rowe RK (2001) Migration of dilute aqueous organic pollutants through HDPE geomembranes. Geotextiles and Geomembranes 19(6): 329-357.
- Chao KP, Wang P, Wang YT (2007) Diffusion and solubility coefficients determined by permeation and immersion experiments for organic solvents in HDPE geomembrane. Journal of Hazardous Materials 142 (1-2): 227-235.
- Drury D, Hall DH, Dowle J (2003) The development of land sim 2.5. National Groundwater and Contaminated Land Centre, Environment Agency, Europe.
- (2008) Standard test method for 24-h batch-type measurement of contaminant sorption by soils and sediments. American Society of Testing Materials, USA.
- Kerry RR, John R (1985) 1‐D pollutant migration in soils of finite depth. Journal of Geotechnical Engineering 111(4): 479-499.
- Rowe RK, Booker JR (1995) A finite layer technique for modelling complex landfill history. Can Geotech J 32(4): 660-676.
- Rowe RK, Caers CJ, Barone F (1988) Laboratory determination of diffusion and distribution coefficients of contaminants using undisturbed clayey soil. Can Geotech J 25(1): 108-118.
- Hasan MF, Himika TA, Molla MM (2017) Lattice boltzmann simulation of airflow and heat transfer in a model ward of a hospital. J Thermal Sci Eng 9(1).
- Himika TA, Hasan MF, Molla MM (2016) Lattice boltzmann simulation of airflow and mixed convection in a general ward of hospital. Journal of Computational Engineering 2016: 1-15.
- (2000) Australian and New Zealand guidelines for fresh and marine water quality. National Water Quality Management Strategy 1: 1-314.
- Rowe RK (1998) Geosynthetics and the minimization of contaminant migration through barrier systems beneath solid waste. 6th International conference on geosynthetics 1: 27-103.
- Hasan MF, Naga HA, Broadbridge P, Leong EC (2018) Series-parallel structure-oriented electrical conductivity model of saturated clays. Applied Clay Science 162: 239-251.
- Carignan M (2005) Assessment of thermally treated drilling mud waste as value-added material for liner systems.
- Rowe RK, Islam MZ (2009) Impact of landfill liner time-temperature history on the service life of HDPE geomembranes. Waste Management 29(10) 2689-2699.
© 2019 Md Farhad Hasan. This is an open access article distributed under the terms of the Creative Commons Attribution License , which permits unrestricted use, distribution, and build upon your work non-commercially.
Editor In Chief


.jpg)


Signup for Newsletter

Quick Links
 Editorial Board Registrations
 Submit your Article
 Refer a Friend
 Advertise With Us
Our Recent Edition

.jpg)


Top Editors


.jpg)


.bmp)
.jpg)
.png)
.jpg)


.jpg)


.png)

.png)


.png)


Financial Support

Sponsors

Latest e-Books

Latest Video

 a Creative Commons Attribution 4.0 International License. Based on a work at www.crimsonpublishers.com.
Best viewed in
a Creative Commons Attribution 4.0 International License. Based on a work at www.crimsonpublishers.com.
Best viewed in