- Submissions

Full Text
Research & Development in Material Science
Indoor and Outdoor Temperature Impact on Residential Consumption - A Study in Greece
Asimina Dimara*, Christos Timplalexis, Stelios Krinidis and Dimitris Tzovaras
Information Technologies Institute, Centre for Research and Technology - Hellas, Thessaloniki, Greece
*Corresponding author: Asimina Dimara, Information Technologies Institute, Centre for Research and Technology - Hellas, Thessaloniki, Greece
Submission: September 09, 2019;Published: September 19, 2019

ISSN: 2576-8840 Volume11 Issue5
Opinion
Global warming and energy demand are two of the most significant factors that affect the standard of living. The temperature deviations affect energy consumed for heating or cooling a place and the emissions produced by the means used to heat and cool a building affect the climate change. This bidirectional relationship between energy and temperature needs to be examined as the demand for energy is increasing and as a result there will be a supply shortage [1]. In addition, the effects from the temperature increase are getting worse by the year [2]. The visibility provided to the consumers by the information delivered from daily consumption metering can help them to save energy and money. Consumption information can be provided by smart meters as they are easy to install, they send real time energy consumption both to the energy supplier and the consumers [3].
Smart meters were installed to residential electric central panels to monitor the energy consumption, indoor temperature sensors were used to collect indoor temperature and a weather API was exploited to gather outdoor temperature (Figure 1).
Figure 1:System abbreviated architecture..

Table 1:Experiment information.

To study the variations of the residential consumption patterns both indoor and outdoor temperature need to be taken into account in order to analyze the degree that temperature alternations influence the consumption patterns. Using the monitored consumption data and temperature data, consumption deviations can be interpreted. The consumption patterns have changes similar to the outside temperature alterations and appear to have seasonal adjustments [4] (Table 1).
Table 2:Average temperature information.

Typical daily average household consumptions from a month with low temperatures (January) and high temperatures (June) were compared to daily average outdoor and indoor temperatures (Table 2).
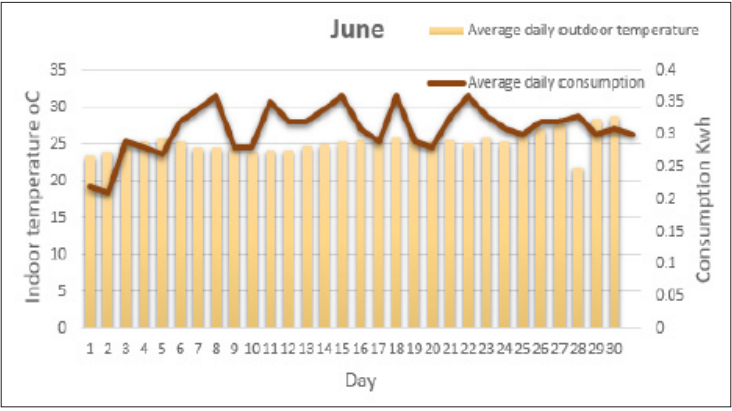
The increase of outdoor temperature in June has a prompt impact on the amount of the energy used which is proportional to the temperature rise as depicted in Figure 2. The maximum energy consumed is 0.36KWh and it is spent during the time the temperature is at its largest value which was 35 ˚C for June. Furthermore, the minimum energy used is 0.21Kwh and is consumed when the temperature is at its lowest value which was 25 ˚C. There is a direct correlation between outdoor temperature and load trend [5].
Figure 2:Average outdoor temperature and consumption in June.

The indoor temperature in June has not the same influence on energy consumption as the outdoor temperature. The increase or decrease of the monitored indoor temperature does not seem to have an equivalent change to the average consumption (Figure 3). Maximum and minimum values of consumption are irrelevant to the increase and decrease of indoor temperature.
Figure 3:Average indoor temperature and consumption in June.

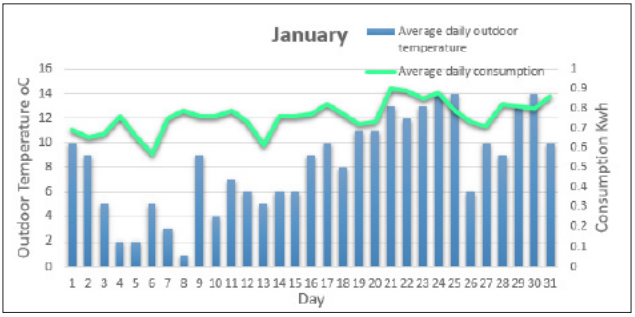
The findings of the energy used during the winter and low outdoor temperatures are not equivalent to the high temperatures during the summer. The deviations of the temperature are not according to consumption fluctuations. During the coldest day (1 ˚C) the consumption was not the maximum. The maximum consumption appears during a day that was almost the hottest of January (Figure 4).
Figure 4:Average outdoor temperature and consumption in January.

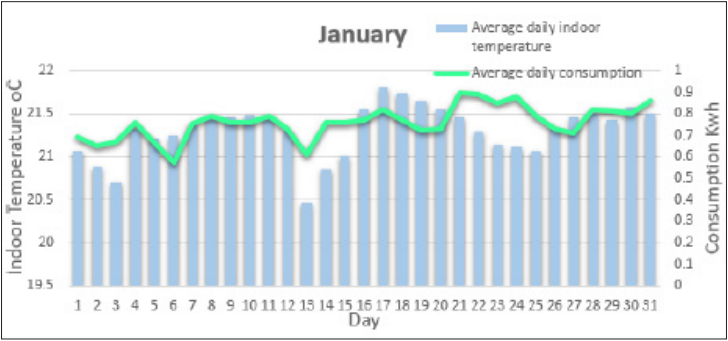
On the contrary, the consumption patterns of indoor temperature during the winter follow almost the same trend. The hotter the temperature is in the room the more energy is used (Figure 5). It may be concluded that outdoor temperature impacts more on consumption needed to cold a building and indoor temperature influences more the consumption needed to heat it.
Figure 5:Average indoor temperature and consumption in January.

Acknowledgement
This work is partially supported by the “enCOMPASScollaborative recommendations and adaptive control for personalized energy saving” project funded by the EU H2020 Programme grant agreement no.723059.
References
- Amin SM, Bruce FW (2005) Toward a smart grid: power delivery for the 21st IEEE Power and energy magazine 3(5): 34-41.
- Reddy TL, Thomson RJ (2014) Environmental, social and economic sustainability: implications for actuarial science. School of Statistics and Actuarial Science, University of the Witwatersrand, South Africa.
- Zheng, Jixuan, David WG, Li L (2013) Smart meters in smart grid: An overview. 2013 IEEE Green Technologies Conference (Green Tech).
- Yi-Ling H, Hai-Zhen M, Guang-Tao D, Shi Jun (2014) Influences of urban temperature on the electricity consumption of Shanghai. Advances in Climate Change Research 5(2): 74-80.
- Salehizade, Ali Akbar (2015) Analysis of temperature changes on electricity consumption in fars province. Mediterranean Journal of Social Sciences 6(3): 610.
© 2019 Christos Timplalexis. This is an open access article distributed under the terms of the Creative Commons Attribution License , which permits unrestricted use, distribution, and build upon your work non-commercially.
 a Creative Commons Attribution 4.0 International License. Based on a work at www.crimsonpublishers.com.
Best viewed in


.jpg)


 Editorial Board Registrations
 Submit your Article
 Refer a Friend
 Advertise With Us
.jpg)


.jpg)


.bmp)
.jpg)
.png)
.jpg)


.jpg)


.png)

.png)


.png)


