
- About Us
- Information
-

The Author ensures that the research has been conducted responsibly and ethically with adherence to all relevant regulations. read more..
- For Authors
- For Reviewer
- Manuscript Guidelines
- Membership
- Publication Ethics
-
- Journals
- Reprints
- e-Books
- Videos
- Policies
- Contact Us
 COVID-19
- Submissions


Full Text
Research & Development in Material Science
Thermal Comfort and Visual Comfort Inference for Residential Users
Christos Timplalexis*, Asimina Dimara, Stelios Krinidis and Dimitris Tzovaras
Information Technologies Institute, Centre for Research and Technology - Hellas, Thessaloniki, Greece
*Corresponding author: Christos Timplalexis, Information Technologies Institute, Centre for Research and Technology - Hellas, Thessaloniki, Greece
Submission: September 09, 2019;Published: September 16, 2019

ISSN: 2576-8840 Volume11 Issue5
Opinion
Indoor comfort can be described as a situation where building occupants are at a state of physical ease and well-being. Comfort is determined from the occupants’ perception of the environmental conditions according to their needs and objective senses. For indoor environments it is mainly defined by two factors, thermal and visual comfort. The proper regulation of thermal and visual conditions results in the elimination of any negative impact on the occupants’ execution of physical and cognitive activities [1]. The aim of the current study is the personalized estimation of the thermal and visual comfort for household occupants with the minimum level of intrusiveness as only a temperature/humidity and a luminance sensor are utilized. Both thermal and visual comfort are measured on the Ashrae 7-point range [2] (Table 1).
Table 1:ASHRAE 7-point scale.

Thermal comfort is the state of mind that expresses satisfaction with the thermal environment, it is calculated using Fanger’s equation [3] which uses the Predicted Mean Vote index to quantify the degree of thermal discomfort on the scale of Table 1:
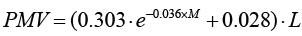
Where L is defined as:

Where M(W/m2) is the internal energy production, W(W/m2) is the external work, C(W/ m2) is the heat loss by convection, R(W/m2) is the heat loss by thermal radiation Esk (W/m2) is the heat loss by evaporation of the skin, Cres(W/m2) and Eres(W/m2) are the sensible and the evaporation heat loss due to respiration respectively.
PMV calculation is based on four variables: Temperature (T) and Humidity (H) are obtained from sensor measurements, while Clothing Insulation Icl and Metabolic Rate M are initialized from Ashrae tables [2] and are constantly revised according to feedback regarding the thermal sensation which is provided by the occupants (PMV_feedback). Updating those values results in creating a personalized profile for each user, in terms of dressing habits and indoor daily activities routine. The prediction of Icl and M is formulated as a multi-target regression problem, where T, H and PMV_feedback is utilized as inputs and Icl and M are predicted using Extremely Randomized Tree regression [4]. Figure 1 presents the thermal comfort inference algorithm flow chart.
Figure 1:Thermal comfort inference flow chart.

Visual comfort describes certain characteristics of the light environment such as amount of light, uniformity and quality in rendering colors. The current study uses an ensemble of two methods for the calculation of visual comfort. The first one is Hviid’s simplification of the Discomfort Glare Probability index [5] which depends only on the vertical illuminance of the eye level. The values of DGP correspond to degrees of glare sensation, which in our case are converted to the Ashrae scale expressing the perception of indoor luminance.

The second method is based on the European Standard EN12464-1 scale of illuminances, referring to indoor lighting of work places [6]. According to it, when the visual conditions differ from the normal assumptions, the luminance value is adjusted by one step in the suggested scale of illuminances (Figure 2).
Figure 2:EN12464-1 scale of illuminancies.

This non-linear scale is then fitted into a curve, corresponding to the [-3,3] Ashrae scale. Finally, the combination of the two methods results in the following equation:
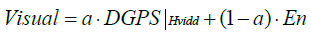
Where coefficient a defines the weight of each method to the calculation of the final result.
Experimental observations of the visual comfort perception of building occupants led to the conclusion that the human perception of the luminous environment differs throughout the day. More specifically, the perception of brightness differentiates during dark hours, as lower levels of luminance are enough for the execution of indoor activities, comparing to the luminance that those activities would require during daytime. This led to the discrimination of day and night model for the inference of visual comfort. The night model is implemented taking into consideration the pilot location and the time of the year, in order to estimate the exact sunrise and sunset times. Finally, the night model implements a coefficient that provides a more accurate approach to the inference of visual comfort. The flow chart describing the execution of the visual comfort inference algorithm is shown in Figure 3.
Figure 3:Visual comfort inference flow chart.

A typical daily curve of the thermal and visual comfort conditions of a residential user is presented in Figure 4.
Figure 4:Typical residential daily thermal and visual comfort.

The proposed method utilizes input provided by sensor measurements that are installed causing a minimum level of disturbance and intrusiveness to the residential user. In return, they provide a complete model regarding the room’s thermal and visual comfort customized to the occupant’s preferences. Monitoring of the indoor comfort conditions may result in improving the occupants’ well-being while optimizing their behavior with respect to household energy consumption.
Acknowledgement
This work is partially supported by the “enCOMPASS - Collaborative Recommendations and Adaptive Control for Personalized Energy Saving” project funded by the EU H2020 Programme, grant agreement no.723059.
References
- Djongyang N, Tchinda R, Njomo D (2010) Thermal comfort: A review paper. Renewable and sustainable energy reviews 14(9): 2626- 2640.
- Ansi/Ashrae (2004) Standard 55-Thermal environment conditions for human occupancy.
- Fanger PO (1970) Thermal comfort, analysis and application in environmental engineering: Danish Technical Press, Copenhagen, Denmark.
- Geurts P, Ernst D, Wehenkel L (2006) Extremely randomized trees. Machine learning 63(1): 3-42.
- Hviid C, T Nielsen, Svendsen S (2008) Simple tool to evaluate the impact of daylight on building energy consumption. Solar Energy 82(9): 787-798.
- (2002) European committee for standardization, -EN12464-1.
© 2019 Christos Timplalexis. This is an open access article distributed under the terms of the Creative Commons Attribution License , which permits unrestricted use, distribution, and build upon your work non-commercially.
Editor In Chief


.jpg)


Signup for Newsletter

Quick Links
 Editorial Board Registrations
 Submit your Article
 Refer a Friend
 Advertise With Us
Our Recent Edition

.jpg)


Top Editors


.jpg)


.bmp)
.jpg)
.png)
.jpg)


.jpg)


.png)

.png)


.png)


Financial Support

Sponsors

Latest e-Books

Latest Video

 a Creative Commons Attribution 4.0 International License. Based on a work at www.crimsonpublishers.com.
Best viewed in
a Creative Commons Attribution 4.0 International License. Based on a work at www.crimsonpublishers.com.
Best viewed in