
- About Us
- Information
-

The Author ensures that the research has been conducted responsibly and ethically with adherence to all relevant regulations. read more..
- For Authors
- For Reviewer
- Manuscript Guidelines
- Membership
- Publication Ethics
-
- Journals
- Reprints
- e-Books
- Videos
- Policies
- Contact Us
 COVID-19
- Submissions


Full Text
Research & Development in Material Science
Computer-Aided Porous Materials Description Based on Morphological Spectra
Juliusz L Kulikowski*
Nalecz Institute of Biocybernetics and Biomedical Engineering PAS, Poland
*Corresponding author:Juliusz L Kulikowski, Nalecz Institute of Biocybernetics and Biomedical Engineering PAS, Warsaw, Poland
Submission: August 30, 2019;Published: September 10, 2019

ISSN: 2576-8840 Volume11 Issue4
Summary
A new approach to porous materials features evaluation is proposed in the paper. The method consists in computer analysis of microscope images of porous material sections. Instead of individual pores analysis, in this approach global morphological spectra (MS) of the images are examined. It is shown that MS contain full information about the morphological structure of the porous material section. Porosity evaluation is then formulated as a statistical MS classification task and a method of its solution is proposed.
Keywords: Porous materials; Porosity evaluation; Morphological spectra; Computer-aided image analysis
Opinion
Synthetic porous materials, e.g. based on polyamide, polyether sulfone, polyvinylpyrrolidone etc. compounds, have numerous and important medical applications. They are used as filtering membranes in hemodialysis [1], micro-capsules for cells or drugs encapsulation and delivery [2], scaffolds for biological tissue cultivation [3], etc. Usefulness of porous materials in medical applications directly depends on their biochemical and mechanical properties, in particular, on porosity characteristics. The last should thus be carefully controlled within a production process and kept stable for exploitation period. For this purpose, numerical parameters describing size and shape of pores as well as global material porosity characteristics (porosity factor, material’s permeability, multi-layer architecture of porous membranes etc.) have been proposed [4,5]. In fact, the parameters don’t describe the pores directly but their planar cross-sections visible in SEM (Scanning Electron Microscope) images. Moreover, such geometrical parameters like pore section’s spread, surface, length of contour etc. are by computer systems interpreted in a discrete geometry sense, not quite consistent with the widely known Euclidean geometry. The differences are particularly clear in case of small (consisting of several pixels) geometrical objects analysis.
Figure 1 shows z typical SEM image of a cross-section of a sample of porous material: a) in original form and b) after image enhancement procedures, visualizing selected (deep) pores as white objects.
Figure 1:SEM image of a sample of porous material: a) original, b) prepared for computer analysis.

The image in the transformed and enhanced form can then be subjected to next steps of computer analysis consisting of evaluation the size, extension and form of selected objects, their, statistical analysis etc. [4,5]. This work can be performed by commercial (like Matlab [6]) or more effective, specialized (like Memo Explorer [7]) computer programs. In any case, the calculation of geometrical parameters of pores is based on the results of counting pixels belonging to the considered objects or constituting their contours or inner areas. However, the number of pixels strongly depends on the results of preliminary image enhancement procedures. For example, in the case presented by Figure 1 some hollows have not been qualified as pores despite the fact that they may be shallow bottoms of cut away larger pores. In this paper an alternative approach to porous materials assessment is proposed. The approach is based on global analysis of SEM images of porous material cross-section without segmentation and analysis of individual pores. The approach is based on the assumption that both, spatial structure of a porous material and images of its planar cross-sections are some statistically dependent, respectively 3-dimensional and 2-dimensional, random fields. Porous materials should thus be evaluated and/or classified on the basis of their 3-dimensional statistical properties, available only through the instances of their observable 2-dimensional cross-sections. Mining information by extrapolation of available data is one of important artificial intelligence (AI) problems [8]; in this case it is limited to one, specific type of random objects. For global image description morphological spectra (MS), based on a modification of 2-dimensional Walsh functions are proposed [9,10]. The utility of MS to description and analysis of textures was presented in [11,12]; in fact, the images of porous materials crosssections can be considered as textures as well. In the paper MS of artificial patterns of porous materials cross-sections are presented. Porous materials characterization consists then in calculation of the MS of its cross-section and in matching it to pattern MS simulating the previously established size- and/or shape-classes of porosity. Such approach works thus on whole images instead of analysis of individual pores. The paper is organized as follows: in Sec 2 basic information about MS is shortly presented. Sec 3 contains examples of MS of typical porous patterns. Principles of porosity evaluation based on higher order MS are described in Sec 4. Conclusions are summarized in Sec 5.
Basic information about morphological spectra
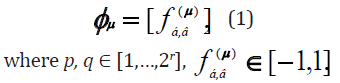
Morphological spectra (more exactly, 2-dimensional morphological spectra, MS2) are the effect of expansion of a monochromatic image described on a discrete plane into a series of basic morphological functions Φ(r) = { Φ(m) } of a fixed natural order r [13]. The basic rth order morphological functions, in some publications, due to their graphical interpretation called also masks, are binary modifications of discrete Walsh functions [10]. The set Φ(r) consists of 2r binary functions Φμ described on a 2r×2rsize discrete square:
For r =1 the functions have the form shown below in tabular form:
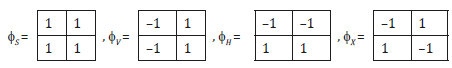
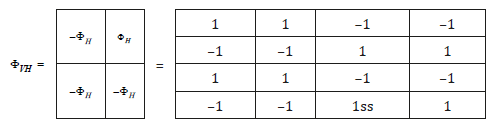
The indices S, V, H and X, when written in bold, can be interpreted as symbols of operators used to generation of higher order basic functions, as it will be shown below. For r =2 we obtain 22×22=16 2nd order basic functions denoted by φSS, φVS, φHS, …, φXX, The functions are described on 4×4 discrete squares and can be generated by subjecting the lower-order functions φS, φV, φH, , φX to the operations S, V, H or X as illustrated by the following example:
V(φH) ≡ φVH (2)
or in a more extended form:
In similar way, the higher, r-th order basic morphological functions can be composed of the lower, (r–1)-th order functions [12]. Increasing of the order r by 1 causes extension of the working window size to (r+1)×(r+1) and a corresponding increasing of the number of the MS components. Let U=[ui,j] denote a digitalized form (a bitmap) of an I×J size monochromatic image consisting of pixels ui,j∈[0,1,…,2k-1], k being a natural number characterizing the gradation of pixel value brightness. Additionally, it will be assumed that the numbers I of rows and J of columns of the image satisfy the conditions: I = k⋅2r, J = l⋅2r, k and l being some natural numbers. Then U can be partitioned into k × l sub-arrays:
U = [ U( ê,ë )] (3)
described on 2r×2r- size working windows. The sub-arrays have thus the form:
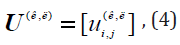
and the subsets of admissible indices i, j is limited to those corresponding to the given sub-array.
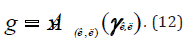
For any rth order basic morphological function φμ and conformable to it (being of the same size) working sub-array U(κ,λ) their scalar product:
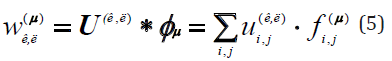
can be calculated. The coefficient w(μ)ê ë, is called an rth order μth MS component of U(κ,λ). The set =[w(μ)ê ë] arranged in a 2r×2r-size table of MS components is called an rth order MS of U(κ,λ). It should be remarked that due to a specific binary structure of the functions φμ calculation of Wκ,λ is reduced to adding and subtracting some combinations of the components u(ê ë) i,j.
A table consisting of rth order μth MS components of all U(κ,λ):
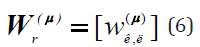
is called a rth order μth MS component of U. For a fixed order r there are 2r×2r μth MS components of all U(κ,λ), constituting a full rth order MS of U:
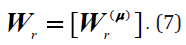
It can be shown that Wr contains full information about U. Really, it consists totally, like U, of k⋅l⋅2r⋅2r real components of w(μ)ê ë type and U can be reconstructed if Wr is given. The properties of U are then hidden in the features of Wr.
MS of selected porosity patterns
In this Section it will be shown that to some typical porosity patterns the corresponding morphological spectra can be assigned. For this purpose, exemplary porosity patterns in 22×22-size working windows have been generated and for their characterization the 2nd order MS will be used. It also will be assumed that the porosity patterns in the form of binary images, as white pores (ui,j=1) on black background (ui,j =1) are presented. In a 4×4-size working window in general 216=65536 different binary images can be described, only some of them presenting typical porosity patterns. For example, a class C1 of porosity patterns consisting of 1 “white” pixel (corresponding to a small pore) within 15 “black” pixels (representing a background) contains 16 instances of porosity patterns. Below, for exemplary purposes, the following classes of porosity patterns will be taken into consideration:
A. C0: no pixels representing pores in a working window;
B. C1: 1 single pixel representing a pore in the working window;
C. C1+1: 2 single pixels representing 2 separate pores in the working window;
D. C21: 2 adjacent pixels representing 1 pore in the working window;
E. C2+2: 2 pairs of adjacent pixels representing 2 separate pores in the working window.
In practice, if necessary, the number of classes can be increased. An object is called compact if it consists of more than 1 pixel and each of the pixels is adjacent to at least one other pixel of the object; the 8-connectivity of pixels (each central pixel surrounded by 8 adjacent pixels) on a rectangular greed is assumed. Pores, by definition, are represented by compact sets of white pixels. For description of the above-mentioned classes the following 2nd order basic morphological functions will be used:
Φ(2) ={φSS, φSV, φSH, φSX, φVS, φVV, φVH, φVX, φHS, φHV, φHH, φHX, φXS, φXV, φXH, φXX}. (8)
In case of higher image magnification, when the smallest pores by compact groups of up to 4 white pixels are presented, the set Φ(2) can be replaced by a set Φ(3) ={φSSS, φSVS,… , φXXS} of basic morphological functions described on the 2×2-size squares. According to formula (5), the following 2nd order MS components will then describe the classes of porosity patterns:
V(2) = {vSS, vSV, vSH, vSX, vVS, vVV, vVH, vVX, vHS, vHV, vHH, vHX, vXS, vXV, vXH, vXX}. (9)
For the above-defined porosity classes two groups of conditions satisfied by the corresponding MS can be mentioned:
a) Conditions determining the size of objects.
The size of objects is described by the value of vSS. Therefore, 1) vSS=0 for C0; 2) vSS=1 for C1; 3) vSS=2 for C1+1 and C2; 4) vSS=4 for C2+2, etc.
b) Conditions determining the compactness of objects.
First, a hypothesis that morphological spectra of separate and compact pairs of pixels representing pores are different should be proven. For this purpose, all different instances of separate and compact pairs of white pixels in a 4×4-size working window have been generated and subjected to analysis. The number of the pairs of separate pixels equals 78, the number of the compact pairs equals 41. For the sake of simplicity the pixels in a 4×4-size working window will be addressed as shown in Table 1. Moreover, the indices κ,λ identifying the working window in this Section will be omitted. We denote by Ω = {ωp,q} the set of pattern compositions of pairs of pixels in a working window; the indices p, q denoting the addresses of “white” pixels. The set is a sum of disjoint subsets:
Ω = ΩI ∪ ΩII (10)
Table 1:Addresses of pixels in a 2×2-size working window.

where ΩI denotes a subset of patterns consisting of disjoint pixels (78 possible cases), ΩII stands for a subset of patterns consisting of adjacent pixels (41 possible cases). For example, in Figure 2 the patterns ω1,11 and ω5,7 belonging to ΩI and ω6,7 and ω6,11 belonging to ΩII are shown. For the instances of images presenting typical pores the corresponding MS can be calculated. The MS2 components of the exemplary images shown in Figure 2 are given in Table 2. It is remarkable that the MS2 components have the form of series composed of three values: -2, 0 and 2. The component vSS characterizes the size of pores. The components vSV , vSX and vXX strongly discriminate the pairs of separate and adjacent pixels. On the other hand, the discriminating power of vSH and vHH seems to be rather negligible.
Figure 2:Examples of pattern pixels allocation in a working window.

Table 2:MS2 components’ values of pairs of pixels’ compositions shown in Figure 2.

The above-presented results have been related to only 2 (out of 78) pairs of separate and to 2 (out of 41) pairs of adjacent pixels. The problem thus arises of possible determination of the criteria for discrimination in a more general case the separate and adjacent pairs of pores presenting pixels. For this purpose, the percentage of the values of MS2 components’ for all combinations of the pairs of “white” pixels have been calculated. The results are presented in Table 3. The signs of components with higher probability being assigned to one of the alternative types of pairs are marked in bold. Assume that for the U(κ,λ) working sub-array its MS2 according to formula (5) has been calculated. It consists of 4×4=16 components w(μ)ê ë constituting a vector (the indices κ,λ for simplicity being neglected): W(κ,λ) = [w(SS), w(SV), w(SH), …, w(XH), w(XX)]. Assume, for instance, that the values (signs of values) of the components of Wκ,λ are as follows:
W(κ,λ) =[2,+,+,0,+,–,0,+, +,–,–,0,0,+,+,–].
Table 3:Percentage of positive, null and negative MS2 components in the spectra of the objects of class C1+1 or C2.

The interpretation of the above-given result can be as follows:
a) w(SS) = 2, therefore, the object belongs to class C1+1 or C2;
b) According to Table 3, the recommendations for assigning W(κ,λ) to C1+1 or to C2 are as presented in the Table 4. Therefore, in most (10 of 15) cases the signs of the W(κ,λ) components suggest its belonging to the class C2. The suggestion doesn’t take into account exact numerical values of the components. However, if it is doubtful it can be verified by finding among the spectra V(2of pattern pore images the most to W(κ,λ) similar one.
Table 4:Recommendations for classification of W(κ,λ).

Porosity evaluation based on higher-order MS
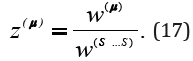
Description of large pores needs using adequately increased working windows and higher order MS. Standard sizes of working windows are 2×2, 4×4, 8×8, 16×16, etc. The corresponding numbers of MS components are then 4, 16, 64, 256, etc. The ratio:
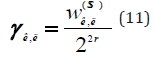
can be used as a local porosity factor of a working window. A global porosity factor of a material then can be defined as an average of local porosity factors over the set of all working windows:
Pores’ shape classification based on evaluation of porous material section similarity to the sets of pore patterns (as illustrated in the former Section) in the case of large working windows seems to be rather unrealistic because of large numbers of pore shape instances. Assuming that each class Cε of pores as a random field is by its proper statistical characteristics described, the problem of pores classification can be formulated as a statistical pattern recognition problem [14]. For this purpose, a statistical model Mε of each class Cε should be established. In practice, simplified models can be used like, in particular, a model consisting of a set of pairs:
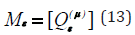
where
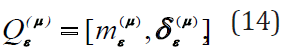
m(μ)ε, δ(μ)ε denote, respectively, the mean value and standard deviation of the μth MS component normalized by division by vSS; μ being standing for the rth order MS2 component indices. Let, like in Sec 5, U(κ,λ) be a given rth order working sub-array and W(κ,λ) - its rth order 2-dimensional MS2 (consisting in this case of 22r components):
W(κ,λ) = [ w(SS…S), w(SS…V),…, w(XX…H), w(XX…X)]. (15)
Before classification of U(κ,λ), in order to make it independent of the brightness level, the spectral components should be normalized according to the formula:
Classification of U(κ,λ) then can be based on evaluation Euclidean distances between the normalized spectrum Wê,ë and the porosity models Mε, ε = 1,2,…, e, according to the formula:
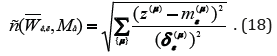
A decision:
U(κ,λ)∈ Cε (19)
is maid if  is minimal for a given Cε. Similar decisions
made in all working windows of an examined image are a basis of
global porosity assessment in a given sample of porous material.
is minimal for a given Cε. Similar decisions
made in all working windows of an examined image are a basis of
global porosity assessment in a given sample of porous material.
Conclusion
Computer-aided analysis of microscope images of porous material sections is a typical approach to evaluate basic parameters characterizing the materials’ porosity. However, it needs segmentation of individual pores, measuring their geometrical parameters and evaluation of secondary pore characteristics. In this paper an alternative approach is proposed. It is based on partition of the porous material section image into regular (square) working windows, computer calculation of morphological spectra (MS) components of sub-images in an established order working windows and assigning the spectra to previously established similarity classes corresponding to various types of porosity. Such approach spares calculation costs because MS components calculation consists only of adding and/or subtracting pixel values, the number of working windows being also strongly limited. The above-proposed method of porosity evaluation is still in the state of development.
References
- Drukker W (1989) Haemodialysis: A historical review. Replacement of renal functions by dialysis, Kluwer Academic Publishers. Dordrecht, Netherlands, 20-86.
- Chwojnowski A, Wojciechowski C, Dudziński K, Łukowska E, Granicka L (2009) New type of hollow fiber membrane for cell and microorganism’s cultivation and encapsulation. Desalination 240(1-3): 9-13.
- Kinasiewicz A, Dudziński K, Chwojnowski A, Weryński A, Kawiak J (2007) Three-dimensional culture of hepatocytes on spongy polyethersulfone membrane developed for cell transplantation. Transplant Proc 39(9): 2914-2916.
- Przytulska M, Kulikowski JL, Lewińska D, Grzeczkowicz M, Kupikowska SB (2015) Computer-aided image analysis for microcapsules’ quality assessment. Biocybernetics and Biomedical Engineering 35(4): 342-350.
- Przytulska M, Kruk A, Kulikowski JL, Wojciechowski C, Gadomska GA, et al. (2017) Comparative assessment of polyvinylpyrrolidone type of membranes based on porosity analysis. Desalination and Water Treat 75: 18-25.
- Pratap R (2006) Getting started with MATLAB 7. Oxford University Press, UK.
- Piętka D (2017) The MeMo Explorer™. An advanced membrane morphology software, version 17.10.24.0, User Guide, Inner Rep IBBE PAS, Warsaw, Poland.
- Russell S, Norvig P (2003) Artificial intelligence. A modern approach, (2nd edn), Pearson Education International, Upper Saddle River NJ, USA.
- Walsh JL (1923) A closed set of orthogonal functions. Am J Math 45(1): 5-24.
- Lazaridis G, Petrou M (2006) Image registration using the walsh transform. IEEE Trans Image Process 15(8): 2343-2357.
- Kulikowski JL, Przytulska M, Wierzbicka D (2007) Morphological spectra as tools for texture analysis. In: Kurzynski M (Ed.), Computer Recognition Systems 2. ASC 45, Springer-Verlag, Berlin, Germany, pp. 510-517.
- Kulikowski JL, Przytulska M, Wierzbicka D (2010) Description of biomedical textures by statistical properties of morphological spectra. Biocybernetics and Biomed Eng 30(3): 19-34.
- Przytulska M, Kulikowski JL, Wierzbicka D (2011) Discrimination of poorly distinguishable random textures by statistical analysis of morphological spectra. Machine Graphics and Vision 20(4): 455-477.
- Russ JC (2011) The image processing handbook, (6th edn), CRC Press, Boca Raton, USA.
© 2019 Juliusz L Kulikowski. This is an open access article distributed under the terms of the Creative Commons Attribution License , which permits unrestricted use, distribution, and build upon your work non-commercially.
Editor In Chief


.jpg)


Signup for Newsletter

Quick Links
 Editorial Board Registrations
 Submit your Article
 Refer a Friend
 Advertise With Us
Our Recent Edition

.jpg)


Top Editors


.jpg)


.bmp)
.jpg)
.png)
.jpg)


.jpg)


.png)

.png)


.png)


Financial Support

Sponsors

Latest e-Books

Latest Video

 a Creative Commons Attribution 4.0 International License. Based on a work at www.crimsonpublishers.com.
Best viewed in
a Creative Commons Attribution 4.0 International License. Based on a work at www.crimsonpublishers.com.
Best viewed in