
- About Us
- Information
-

The Author ensures that the research has been conducted responsibly and ethically with adherence to all relevant regulations. read more..
- For Authors
- For Reviewer
- Manuscript Guidelines
- Membership
- Publication Ethics
-
- Journals
- Reprints
- e-Books
- Videos
- Policies
- Contact Us
 COVID-19
- Submissions


Full Text
Research & Development in Material Science
Determination of Heavy Metals in Tomato and its Support Soil Samples from Horticulture and Floriculture Industrial area, Ziway, Ethiopia
Mulat Anagaw1, Enyew Amare Zereffa2*, Dawit Firmechale3 and Ananda Murthy HC2*
1 Department of Chemistry, College of Computational and Natural Sciences, Dilla University, Ethiopia
2 Department of Applied Chemistry, School of Applied Natural Science, Adama Science and Technology University, Ethiopia
3 Department of Environmental Science, College Computational and Natural Sciences, Addis Ababa University, Ethiopia
*1Corresponding author:Enyew Amare Zereffa, Department of Applied Chemistry, School of Applied Natural Science, Adama Science and Technology University, Ethiopia
*2Corresponding author:Ananda Murthy HC, Department of Applied Chemistry, School of Applied Natural Science, Adama Science and Technology University, Ethiopia
Submission: February 11, 2019Published: March 01, 2019

ISSN: 2576-8840 Volume10 Issue1
Abstract
The present study investigated the level of toxic heavy metals such as Pb, Cd, Cr, and Cu in tomato and in support soil samples at the flower garden in Ziway horticulture and industrial area, Ethiopia. The obtained values of reagents volume, temperature, and time for optimal procedure are the mixture of 6mL of HNO3, and 2mL of H2O2, 210 ℃, 150min and 6mL of aquaregia (1HNO3:3HCl) and 2mL of H2O2, 270 ℃, 180min to mineralize powdered samples of tomato and its support soils during wet digestion, respectively. The concentrations of four selected metal in the tomato and its supporting soil samples were determined by flame atomic absorption spectrophotometer. The mean concentration of heavy metals in tomato sample near the flower garden exhibited decreased trend in the order of Pb (0.48±0.02ppm) > Cu (0.39±0.002ppm) > Cr (0.32±0.014ppm) > Cd (0.025±0.001ppm). While, the mean concentration of heavy metals in tomato sample far from the flower garden exhibited decreased trend in the order of Pb (0.399±0.009ppm > Cu (0.16±0.011ppm) > Cr (0.11±0.08ppm)> Cd (0.013±0.0007ppm). This indicates that the tomato vegetables grown near the industrial area contain the higher level of heavy metals than those grown far from it, which could be attributed to the addition of fertilizers, herbicides, pesticides, and other chemical repeatedly to the soils to enhance the agriculture crops. The similar trend was also observed for soil samples but with slightly higher concentrations of heavy metals. In the precision test, %RSD (relative standard deviation) for selected metals in tomato sample was in the range between 0.51% and 4.2% for tomato near the flower garden and between 2.26% and 6.9% for far from the flower garden. A significant difference was observed between the mean concentrations of all metals in tomato and its support soil samples.
Keywords: Heavy metals; Tomato soil; Horticulture; Fertilizers; FAAS
Introduction
The tomato, Solanum lycopersicum, syn. Lycopersicon lycopersicum & Lycopersicon esculentum, commonly known as a tomato plant, the species originated in the South American Andes and its use as a food originated in Mexico and spread throughout the world by Spanish conquistadors [1]. In the human diet, it is an important source of micronutrients, anti-oxidants and secondary metabolites such as vitamins C and E, b-carotene, lycopene, flavonoids, organic acids, phenolics and chlorophyll. Tomato fruits are usually eaten whole in salads, cooked in sauces, soup and meat, fish dishes. Tomato consumption has been found to reduce the risks of cardiovascular disease and certain types of cancer, such as prostrate, lung and stomach [2]. The quality of tomato depends on factors such as, choice of cultivar, cultural practices, harvest time and method, storage, and handling procedures. Tomatoes grown on contaminated soils may lead to the uptake of elevated heavy concentration of metals producing adverse effect [3- 5]. The presence of heavy metals reduces the nutritional value of the tomato.
Excessive use of chemical fertilizers in agriculture results in a large number of environmental problems. The levels of cadmium, lead, copper and chromium in tomato are of interest as these metals are generally considered as toxic to human beings. Plants take up heavy metals by absorbing them from airborne deposits on the parts of the plants exposed to the air from the polluted environments as well as from contaminated soils and water through root system [6]. Heavy metals are non-biodegradable and bio-accumulate in living tissues through the food chain causing serious environmental and health problems [7]. The consumers’ concern over food safety and quality arises from globalization of trade in food and intensive agricultural pollution arising from both natural (geological) and anthropogenic activities (mechanization and agrochemicals application).
Ziway is one of the most important industrial areas in Ethiopia for the production of fruits and vegetables. Among these fruits and vegetables, onion and tomato are the biggest farm product in the area [8]. Ziway area is highly contaminated with the domestic and industrial wastes from the nearby flower industry. These large quantities of untreated municipal sewage and industrial effluents are directly discharged to the river hare demble through water canals. The farm workers usually divert the polluted water for growing tomato fruit during the dry seasons. Studies show that city effluents (sewage and industrial) are one of the potential sources of metal pollution [9].
Therefore, analysis of heavy and toxic metals concentration in tomato grown in and around Ziway industrial area is important for the evaluation of risk related to human health. This analysis will be helpful to farmers as well as agricultural researchers so that they can adopt a wise strategy which will help in saving mankind from different kinds of health problems including cancer and other critical diseases.
The present study is aimed to determine the levels of Cr, Cu, Cd and Pb in tomato and supporting soil samples from different areas of flower garden in Ziway horticulture and floriculture industrial area. Atomic Absorption Spectrometry (AAS) is the most widely recommended instrument utilized in analytical procedures for trace heavy metal analysis [10]. The present study investigated the levels of toxic heavy metals such as Pb, Cd, Cr, and Cu in tomato and in supporting soil samples from different areas of the flower garden in Ziway industrial area.
Materials and Methods
Chemicals and instruments
Nitric acid, (69%, Merck, France), 37% HCl (Fine Chem. Industries Mumbai, France) and extra pure hydrogen peroxide 30% H2O2, (Scharlau, European Union) were used for digestion of tomato and its supporting soil samples. Other reagents and chemicals used in the study were of analytical grade. An atomic absorption spectrometer (Analytik Jena ZEE nit 700p) equipped with deuterium lamps as background corrector and hollow cathode lamps with air-acetylene flame was used for the analysis of the analytes metals. The working standard solutions were prepared freshly by diluting the stock and intermediate standard solutions (10mg/L). The working standards were as follows: Cr-1,2,3 & 4mg/l, Pb-1, 2, 3 & 4mg/l, Cu-0.25, 0.5, 1 & 2mg/l. and Cd-0.25, 0.5, 1 & 2mg/l diluted in nitric & HCl in the presence of 30% H2O2.
Study area
The study area is situated in southern Oromia Region of Ethiopia. Ziway is located in the Rift valley 160 Km from the capital on the road junction to Hawassa in the East- Showa-Zone of the Oromia Region, Ethiopia. Ziway town has a latitude and longitude of 7°56′N38°43′E with an elevation of 1643 meters above sea level (Figure 1). The economy of the town is based on fishing and horticulture. The choice of the study area was made on the basis of major vegetable producing potential of the region. Ziway and the swampy areas around the lake are mainly composed of coarse pumice material. Most parts of the islands are covered by volcanic rocks, mainly basalt and pumice. Ash is commonly found in the soils of volcanic origin. Generally, the soil is shallow, sandy, and characterized by low organic matter. The color of the soil is mostly grey, whitish or brown depending on location [11].
Figure 1:Map of Ziway showing the study area.

Sampling collection and design
Purposive sampling approach was followed for the selection of sample location. Two sampling sites were identified, one site near the flower garden and the other one site 4-5km away from away from the flower garden. The sampling layout composed of six pot zigzag lines on a near level surface form was set to encompass the sampling area.
Collection of tomato samples
The sample collection time period was from March to April 2016. The samples were collected from four agriculture fields near to and far from the flower garden at two areas namely BoChesa and Kontole. The two samples were taken near the flower garden (horticulture) or BoChesa area where as other two were picked from flower garden at Kontole area. Composite sampling methods were followed for sample collection (Zigzag sample) [12]. The tomato samples were collected from the six sample plots (three tomato samples per plot) were taken representing each farm land. The tomato samples were sub-sampled and thoroughly mixed to form a composite sample. All samples were packed, labeled and transported to the Addis Ababa University for laboratory analysis.
Collection of soil samples
Following similar sampling design, as described in section 2.3.2. Six composited soil samples were collected from March-April 2016. The soil sample (about 2Kg) were collected from 0-20cm depth from the same site where the tomatoes plants were collected using soil auger. The farmland is conventionally tilled where the samples 0-20cm were collected [13]. The top 0-20cm depth of soil layer was considered as most of the soil’s chemical interactions with the atmosphere are expected to take place. About 335gm of soil sample was taken from each 6 sub sampling points and then mixed together to form two kg of composite sample. The collected samples were kept in plastic material and properly labeled and then transported to Environmental science laboratory, Addis Ababa university.
Sample preparation
Preparation of tomato samples: The tomato samples were washed with tap water followed by deionized water to eliminate soil particles and dust. The edible parts were also separated from the other portions and rinsed with deionized water so as to remove surface contaminants like soil, dust and spray residues. The samples were chopped by scissor in to small pieces and packed in aluminum foil and the samples were dried in an oven at 70 ℃ for 96hrs [14]. The dried tomato samples were ground and homogenized into fine powder with a grinding device and then stored in plastic bags for further chemical analysis.
Preparation of soil samples: About 2kg composite soil samples were collected from the sites, dried for seven days at room temperature, labeled, packed, and transported to the laboratory. Then, the samples were ground and homogenized into fine powder with a grinding device and sieved to pass through a 500μm mesh. The homogenized soil sample was divided in to four parts and oven dried. Finally, the dry 125g homogenized soil sample was stored in clean and dry pocket till digestion and analysis.
Optimization of the working procedure
In this study, sample digestion was carried out using wet digestion with Kjeldhal apparatus for both tomato and its supporting soil samples, to prepare a clear colorless sample solution suitable for the analysis. The mixture used for the digestion contains nitric acid, hydrochloric acid, and hydrogen peroxide. Before the samples were digested for analysis the parameters, acid ratio, temperature, and duration of time for complete digestion were carefully optimized. Optimum procedure of sample dissolution is required to give at most result with minimum reagents, time and temperature, simple procedure and in an environment friendly manner. A mixture of nitric acid, and hydrogen peroxide was used for tomatoes sample decomposition whereas hydrogen peroxide was added to aquaregia solution (3HCl: 1HNO3) in the case of soil sample.
Digestion conditions for the samples using HNO3, HCl, and H2O2 mixtures were assessed by varying volume of acid mixtures, digestion temperature and digestion time. Optimization of the digestion conditions for the composite samples of tomato powder and the Support soil samples are presented in Table 1 & 2, respectively.
Two different HNO3:H2O2 ratios yielded clear and colorless solution during volume optimization for the digestion of 0.5g of tomato sample (Table 1). But trail No. 3 was taken as optimum condition of volume reagent for fixing other parameters of temperature, and time. The obtained optimum temperatures are 210 ℃ and 240 ℃ at which clear and colorless digestion solution were obtained as indicated in Table 3 (Trial No. 8 & 9).
Table 1:Optimization result for wet digestion of 0.5g of tomato powder.

But the optimized time was 150min at the temperature of 210 ℃. Therefore, the selected optimized conditions for the digestion of tomato samples were 6mL HNO3, 2mL H2O2, 210 ℃ of temperature and 150 min of digestion time were presented in Table 1.
In volume optimization for the digestion of 0.5g of soil sample (Table 2) clear and colorless solution was obtained by using two different mixtures such as aquaregia (1HNO3:3HCl) and H2O2 ratios. The optimized volume of the reagent was taken from trial No 3 keeping temperature, and time of optimization constant. The optimized temperature for clear and colorless digestion solution was obtained at 270 ℃ and 300 ℃ as presented in Table 2. But for the other parameter optimization 270 ℃ temperature was taken. Finally, to optimize the time, clear and colorless digestion was obtained at 180min. Therefore, the selected optimized conditions for the soil sample are the acid ratio 6mL (1HNO3:3HCl) and 2ml H2O2, the temperature 270 ℃ and the time 180min were taken for the final analysis of soil samples.
Table 2:Optimization results for wet digestion of 0.5g of support soil.

Analysis of tomato and its support soil samples for metal levels
Metal standard solutions for calibration were prepared from an intermediate standard solution containing 10mg/L which was prepared from the atomic absorption spectroscopy standard stock solutions that contained 1000mg/L for each of the metals. Secondary standards for instrument calibration were prepared by diluting with de-ionized water to obtain four working standards for each metal included in this work. Cr, Cu, Cd, and Pb were analyzed with FAAS (Analytik Jena ZEE nit 700p) equipped with deuterium arc background corrector and standard air-acetylene flame system using external calibration curve after the parameters: burner and lamp alignment, slit width and wavelength adjustment were optimized for maximum signal intensity of the instrument. The hallow cathode lamp for each metal operated at the manufacturers recommended conditions were used at its respective primary source line. The acetylene and air flow rates were managed to ensure suitable flame conditions. Three replicate determinations were carried out on each sample. The concentration of all the four metals were determined by absorption mode and the instrument readout was recorded for each solution manually. The same analytical procedure was employed for the determination of elements in digested blank solutions. The operating parameters for FAAS employed for each analyte are given in Table 3.
Table 3:Operational parameters of the FAAS instrument.

Method performance and method validation
Method validation is the process used to confirm that the analytical procedure employed for a specific test is suitable for its intended use. Results from method validation can be used to judge the quality, reliability and consistency of analytical results; it is an integral part of any good analytical practice. The parameters such as precision, limit of detection and limit of quantification are used in this process.
Precision
Precision is a measure of the random error associated with a series of repeated measurements of the same parameter with in a sample. Precision of the analytical procedure is usually expressed as the mean and standard deviation (mean±SD). And in this study the precision of the percentage of relative deviation was evaluated
Method detection limit
Method detection limit is the lowest concentration level that can be determined to be statistically different from an analyte blank or is the minimum concentration that can be detected by the analytical method with a given confidence limit [15]. There are numerous ways of determining detection limits of a given measurement. According to EPA, Environmental Protection Agency of America, it is the minimum concentration of a substance that can be measured and reported with 99% confidence level that the analytical concentration is greater than zero. The generally accepted and common definition of method detection limit is the concentration that gives a signal three times the standard deviation of the blank or background signal. In this work, after digestion of 6 blank solutions (a mixture of 6mL HNO3 and 2 mL H2O2) were used for wet digestion of tomato samples) and 6 blank solutions (a mixture of aquaregia and hydrogen peroxide) for digestion of soil samples. The method detection limit and limit of quantification for each metal were calculated from the standard deviation of the replicate analysis of six blanks prepared by the optimized procedure by using the equations 1 and 2;
MDL = 3×S of blank (1)
LOQ = 10×S of blank (2)
Six blank samples were digested following the same procedure as the samples and each of the samples were determined for the elements of interest (Cr, Cu, Cd, and Pb) by atomic absorption spectrophotometer. The standard deviation for each element was calculated from the six blank measurements to determine method detection limit.
Validation of optimized procedure
The optimized procedure was validated by determining metal concentration of a sample spiked with a known amount of each metal [16]. Then the percent recovery (%R) of the method was evaluated. The procedure followed is the spiking of both the tomato and soil samples. In each triplicate tomato and soil sample, known concentration of the metal standard added using a pipette. The spiked sample were digested in optimized procedure and analyzed by FAAS (for Cd, Cu, Pb and Cr). Then, the percent recovery of the method was evaluated by calculating percent recovery (% R) as per the equation 3, given below,
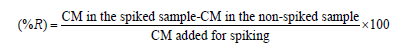
Where, CM = concentration of metal.
Statistical evaluation
Descriptive statistical analysis including F test followed by t-test, the data were statistically analyzed using the statistical package, the means and standard deviations of the metal concentrations in tomato were calculated. Mean and standard deviation of each heavy metal were calculated for tomato and soil samples were presented as mean±SD of triplicate measurements. Mean and SD of each sample were used to compute the calculated t-value. Thus differences between the critical t-value and calculated values of the metals concentration of tomato and soil samples near and far from the flower garden were analyzed by using a probability factor of p< 0.05.
Results and Discussions
Level of some selected heavy metals in tomato and its support soil samples
The tomato fruits and its support soil samples collected in the study area were digested and analyzed for some heavy metals. The results obtained revealed that all the metals analyzed were detected and there was variation in the values obtained in tomato fruits and support soil respectively. The metal concentrations obtained in the aforementioned samples are presented in Table 4 & 5 respectively.
The concentrations of four metals (Cr, Cu, Cd and Pb) in tomato and Support soil samples were determined by FAAS. The concentration of the four metals analyzed in tomato and soil samples from all the sample sites were found to be above the method detection limit. The average concentration of the metals was expressed as mean±standard deviation (SD) in Table 4 & 5.
Levels of some selected heavy metals in tomato samples
The study assessed that the concentration of the four metals from tomato samples near and far the horticulture. In addition to that, the concentration the four metals (Pb, Cd, Cu and Cr) in tomato samples were determined using flame atomic absorption spectroscopy (FAAS). The results are presented as average of the determination of triplicate recording for each of the four sample solution. Therefore, the level of concentration of the selected heavy metals such as Pb, Cd, Cr, and Cu was determined in the samples of tomato are reported for each metal as the mean of six measurements along with the corresponding total standard deviation and percent relative standard deviation for the given sample.
All the values obtained for the metal contents in analyzed tomato sample were expressed in ppm on dry weight the results (Table 4) indicated that in the tomato sample all heavy metals were detected and the mean concentration of four metals are shown above the detection limit.
Table 4:Level some heavy metals (Cd, Cr, Pb &, Cu) in tomato sample NFG and FFG is given by mean±SD and % RSD.

a Near flower garden
b Far flower garden
The concentration of metals determined in tomato samples revealed the fact that lead was present in higher concentration than the other heavy metals on both sites in the present study while cadmium concentration was found to be least in all the tomato samples near and far from the flower garden as shown in Table 4. The mean concentration of lead is above the other three metals. This is due to excess amount of pesticides like, keratin, palatine, pairs green and endosulphine and fungus frequently used, this pesticide also contains the compounds of lead.
The results showed that the mean concentration of metals (ppm) in tomato samples near the flower garden decrease in the order of Pb (0.48±0.02) >Cu (0.39±0.002) >Cr (0.32±0.014) > Cd (0.025±0.0013) while mean concentration for the samples for away from the flower garden found to follow the decreasing order, Pb (0.39±0.009)> Cu (0.16±0.011) > Cr (0.11±0.007) > Cd (0.013±0.0007). The order of metal concentrations (ppm) in soil near the flower garden showed Pb (1.57±0.01) >Cr (1.52±0.03) > Cu (1.21±0.009) >Cd (0.032±0.002) ppm. This indicates that the tomato vegetables grown near the industrial area contain the higher level of heavy metals than that of far from it. This is due to the addition of fertilizers, herbicides, pesticides, and other chemical repeatedly to enhance the agriculture crops.
Comparing these two sample sites, tomatoes samples near the flower garden contain more concentration of heavy metals than that of tomato samples taken from far away to flower garden (Figure 2). It is because the tomato sucks heavy metal found in the soil with the minerals needed for its growth. There for contamination of the tomato fruits is an indication that the soil is polluting the vegetable.
Figure 2:The mean concentration of heavy metals in tomato samples.

Levels of selected heavy metals in soil samples
The soil samples were also collected from two sites that originated the tomato plants near and far form the flower garden with soil auger. The amounts of analyzed metals in the soil sample were expressed in ppm on dry weight (Table 5). In the soil sample all heavy metals were detected. The concentration of metals in soil samples almost follow the same trend as that of tomato samples but with little deviation in the case of copper and chromium. Since the mean concentration of chromium is greater than the mean concentration of copper in the soil sample. The higher amounts of metals were determined in samples collected near the flower garden than that for far away from the flower garden.
Table 5:The level heavy metals (Cd, Cr, Pb & Cu) in soil sample NFG and FFG and % RSD.

The highest metal concentration level obtained from this study was determined for lead as 1.57 and 0.93ppm, near and far from the horticulture, respectively. This indicates that the agricultural soil contains different pesticides that include the lead compounds such as pair green and fungus. While the lowest concentration of cadmium was observed with the values of 0.032 and 0.027ppm near and far from the flower garden respectively. The level of metals in soil samples collected from the two site and taken from the four farmland generally observed to follow decreasing trend, in the order of Pb (1.57±0.011ppm) > Cr (1.52±0.03ppm) > Cu (1.21±0.009ppm) > Cd (0.032±0.002ppm). The mean concentration of heavy metals in soil samples far from the flower garden are decreased in the order of Pb (0.93±0.006ppm) > Cr (0.88±0.004ppm) > Cu (0.69±0.03ppm) > Cd (0.027±0.001ppm).
Method of validation
Method of validation is the process used to confirm that the analytical procedure employed for specific test is suitable for its intended use. Results from method validation can be used to judge the quality, reliability and consistency of analytical results. It is an integral part of any good analytical practice.
Precision
The reproducibility of the analytical procedure was checked by carrying out a triplicate analysis and calculating the relative standard deviation (%RSD) for each metal. The recommended value of %RSD is less than 10% [17]. The precision of the tomato results was evaluated from % RSD of the samples and triplicate readings for each sample making total of six measurements for a given sample. In the precision test, %RSD for selected metals in tomato sample was in the range between 0.51% and 4.2% for tomato near the flower garden and between 2.26% and 6.9% for far from the flower garden. The precision test %RSD for the selected metals in soil sample was in the range between 0.64 % and 6.25 % near the flower garden and between 0.45% - 4.35% far from the flower garden. In this study % RSD was below 7% the mean which indicated that the analytical method used is precise and reliable. Therefore, the results obtained by this method are in good agreement or accepted with each other. The mean value and % RSD of each metal in tomato and soil samples were given in Table 5 & 6 respectively.
Method detection limit
Detection limit of an analyte is the smallest quantity (concentration) of analyte which can be detected but not quantified at a given confidence level.
In this study method detection limit for each metal was estimated by digesting six analytical blanks with the optimized procedure for the tomato and its support soil samples respectively. Each blank solution was run with AAS for the metals level in similar manner as the samples and standard deviations of the blanks’ concentration were calculated. The method detection limits determined for tomato and soil samples were enough to detect the presence of interested metals at trace levels. The standard deviation for each element was calculated from the six blank measurements to determine method detection limit shown in Table 6. Therefore, the method detection limits estimated were higher for all metals (Cr, Cu, Pb, and Cd) in soil sample than in tomato sample. In addition to that, the methods of detection limit of the tomato and its soil samples obtained from the above data were higher than the instrumental detection limit. Therefore, it is a good acceptance for the metal analyzed.
Table 6:Instrument detection limit, method detection limit, and lower limit of quantification for the assayed in soil and tomatoes sample.

Recovery test
The efficiency of the optimized procedure was checked by adding known concentration of each metal in 0.5g sample of tomato and soil samples. 1ppm of chromium and 1ppm of copper, 2ppm of lead and 0.5ppm of cadmium from stock solution (1000mg / L) were taken and spiked at once in to 250mL of round bottom flask with the same digestion process as sample followed. Then the samples were digested with the optimized procedures for both tomato and soil samples. After diluting the digested samples with de-ionized water, they were analyzed by the same procedure followed for the analysis of tomato and soil samples. As used for original samples triplicate spiked samples were recorded. From these determinations, the precision and accuracy of the procedure were determined. The recovery values for the tomato and its support soil samples are given in Table 7 & 8.
Table 7 shows that the recovery results lie within the acceptable range of 91.8%-98.1% for, Cd, Cu, Pb and Cr in the tomato sample. The recovery test for the supporting soil samples is given in Table 8 showed that the recovery results lie within the acceptable range from of 89.4%-104% for Cd, Cu, Pb and Cr respectively.
Table 7:Recovery test for the optimized procedure of Tomato samples.

Table 8:Recovery test for the optimized procedure of Support soil samples.

So, good recoveries were obtained for the metals analysis in both types of samples validation that the optimized procedure had good accuracy. The calculated percentage recovery for cadmium has the least value 91.14% and the highest value 98.1% for chromium on the tomato sample as shown in Table 7.
Besides, the least percentage recovery value for Cadmium is 89.4% and the highest the percent recovery for Chromium is 104 % in the soil samples, which were in the acceptable range as shown in Table 8. Therefore, the optimized procedure for the metal analysis of both tomato and soil samples were validated.
Statistical evaluation
All analysis was performed in triplicates. Results were expressed by mean±S. The means and standard deviations of the metals concentration in tomato and soil samples were calculated. F-test was used to identify statistical difference among the two sample variance of the metal concentration of tomato and soil sample near and far from the flower garden. In addition to that t-test was also used to identify statistical difference between the two mean concentration of the metal in tomato and soil sample near and far from the flower garden respectively. Therefore, using t- test statistical analyses, the results were made to verify whether there were significant differences in concentration of the heavy metals in the tomato sample and soil samples assayed with the sampling sites.
For the present study, the significance of variation within tomato sample near and far from the flower garden has been studied using t-test. At 95% confidence level, for the tomato samples significant difference, P< 0.05 was observed for all the metals near and far from the flower garden. Similarly, for the case of soil samples significant difference, P< 0.05 was observed for all the metals near and far from the flower garden. The result indicated that significant differences were obtained (p< 0.05) at 95% confidence levels for Cr, Cu, Pb, and Cd in tomato and soil sample near and far the horticulture collected in the study area. By using the application of statistical t- test, the t-calculated value greater than the t-critical value (Tcalc > Tcrti). This implies that there was significant difference between the level of metals in tomato and in soil samples near and far the flower garden. This significant difference indicates that the farm land that can be found near the horticulture is more contaminated than the farm land that can be found far from the horticulture.
Conclusion
The metals such as lead, copper, cadmium, chromium were analyzed by using atomic absorption spectroscopy in the tomato and soil samples around the flower garden in Ziway horticulture and industrial area, Ethiopia. The concentrations of heavy metals in tomato samples collected near the horticulture were found to be higher than that of the sample collected far from it. The level of lead (Pb) has the highest concentration in the tomato sample and found within the permissible limit. While cadmium had lower concentration near and far from the flower garden respectively. Although, the level of Copper, chromium and cadmium in tomato sample near and far the horticulture below the permissible limit set by WHO /FAO. Besides, the optimized procedure was efficient which gave good recovery results for all the metals (91.14% - 98.1%) for tomato samples and (89.4% - 104%) for the soil samples. The level of heavy metals in tomato and soil samples near the horticulture area was higher than those of samples far from the horticulture. More over the level of heavy metals in the soil sample was found to be greater than those in tomato samples on both sites due to pollution as a result of modern farming methods.
Acknowledgement
The authors gratefully acknowledge Adama science and Technology University and Addis Ababa University for financial support and laboratory facility to conduct this research work.
References
- Etem O, Ibrahim IO, Zeliha L, Goksel D, Memduh S (2012) Determination of heavy metal concentrations in Tomato (Lycopersicon esculentum miller) grown in different station types. Romanian Biotechnological Letters 17: 6962 -6974.
- Zoran SI, Nikolas K, Ljubomir S, Dragoljub B, Natasa M (2014) Heavy metals and nitrate contents in tomato fruit grown in organic and conventional production systems. Poland Journal of Environmental Studies 23: 2027-2032.
- Marga AT (2016) Assessment of selected trace elements in fruits and vegetables cultivated around mojo meki and zeway irrigation farms. Ethiopian International Journal of Science and Research 5: 1-25
- Lugwisha EH, Othman CO (2014) Levels of selected heavy metals in soil, tomato and selected vegetables from lesotho district, Tanzania. International Journal of Environment Monitoring Analysis 2(6): 313- 319.
- Jimoh WLO, Mahmud I (2012) Assessment of cadmium and lead in soil and tomatoes grown in irrigated farmland of the kaduna metropolis nigeria. Research Journal of Environmental Earth Science 4: 55-59.
- Deribachew B, Amde M, Nigussie-Dechassa R, Taddesse AM (2015) Selected heavy metals in some vegetable produced through waste water irrigation and their toxicological implication in Eastern Ethiopia. African Journal of Food and Agricultural Nutrition Development 15(3): 98-112.
- Kachenko A G, Singh B (2006) Heavy metals contamination in vegetables grown in urban and metal smelter contaminated sites in Australia. Water, Air and Soil Pollution 169(1-4): 101-123.
- Cairns MA, Lackey RF (1992) Biodiversity and management of natural resources: The issues fisheries. Bulletin of American fisheries society 17: 4-25.
- Saiful I, Hoque MF (2014) Concentrations of heavy metals in vegetables around the industrial area of Dhaka city Bangladesh and health risk assessment. International Food Research Journal 21: 2121-2126.
- Pandey R, Shubhashish K, Pandey J (2012) Dietary intake of pollutant aerosols via vegetables tmospheric deposition and wastewater irrigation. Ecotoxicol Environ Saf 76(2): 200-208.
- Zegeye H, Demel T, Ensermu K (2014) Socio-economic factors affecting conservation and sustainable utilization of the vegetation resources on the islands of lake ziway, south-central Ethiopia. Natural Resources 5: 864-875.
- Duressa T F, Seyoum L (2015) Determination of levels of as, cd, cr, hg and pb in soils and some vegetables taken from river mojo water irrigated farmland at koka village, oromia state, east Ethiopia. International Journal of Sciences: Basic and Applied Research (IJSBAR) 21: 352-372.
- Renu T, Kalpana S (2014) Determination of heavy metal accumulation in Lycopersicon esculentum grown in contaminated sites. International Journal of Chemical Sciences 12: 39-44.
- Chaitali V (2015) A review on the concentration of the heavy metals in vegetable shamp like spinach and tomato grown near the area of Amba Nalla of American city. International Journal of Innovation Research Science Engineering and Technology 4: 2788-2792.
- Gebre A, B Singh Chandravanshi (2011) Level of essential and nonessential metals in gesho (Rhamnus Prinoides) cultivated in ethiopia. Bulletin of Chemical Society of Ethiopia 26: 329-342.
- Sharma R J, Agrawal M, Marshall F M (2009) Heavy metals in vegetables collected from production and market items of a tropical urban area of Indian. Food Chem Toxicol 47(3): 583-591.
- Gouthami B, Nageswara RR (2015) An overview of applications of atomic absorption spectroscopy in determination of inorganic impurities in drugs anplants and its extracts. International Journal of Basic and Applied Sciences 1(2): 37-45.
© 2019 Enyew Amare Zereffa and Ananda Murthy HC . This is an open access article distributed under the terms of the Creative Commons Attribution License , which permits unrestricted use, distribution, and build upon your work non-commercially.
Editor In Chief


.jpg)


Signup for Newsletter

Quick Links
 Editorial Board Registrations
 Submit your Article
 Refer a Friend
 Advertise With Us
Our Recent Edition

.jpg)


Top Editors


.jpg)


.bmp)
.jpg)
.png)
.jpg)


.jpg)


.png)

.png)


.png)


Financial Support

Sponsors

Latest e-Books

Latest Video

 a Creative Commons Attribution 4.0 International License. Based on a work at www.crimsonpublishers.com.
Best viewed in
a Creative Commons Attribution 4.0 International License. Based on a work at www.crimsonpublishers.com.
Best viewed in