- Submissions

Full Text
Research & Development in Material Science
Thin Film Production and Characterization Ba1-xSrxTiO3 (x = 0.9) for Capacitor Applications
Rahmi Dewi1*, TS Luqman Husain S1 , Krisman1, Zuhdi2 and Hamdi1
1Department of Physics, Pekanbaru, Indonesia
2Faculty of Teacher Training and Education, Pekanbaru, Indonesia
*Corresponding author: Rahmi Dewi, Department of Physics, Indonesia
Submission: January 16, 2019; Published: January 24, 2019

ISSN: 2576-8840 Volume9 Issue4
Abstract
The thin films of Barium Strontium Titanate (BST) material of Ba0.1Sr0.9TiO3 were fabricated using sol-gel method and annealed at temperature 600 °C, 650 °C and 700 °C in order to obtain its crystalline structure. The thin films of BST were characterized using FESEM, XRD and Impedanceof Spectroscopy. The results of characterization use FESEM at temperature of 600 °C, 650 °C and 700 °C to obtainin thickness such as 51,36nm; 53,59nm and 87,09nm. The results of characterization use XRD with the temperature annealing. its angle 10,26° at temperature 600 °C, 650 °C and 700 °C to obtain the intensity 244, 280 and 300. The characterization uses Spectroscopy Impedance to obtain the values complex capacitance and dielectric constant are inversely proportional to the frequency and while the loss of dielectric values areproportional to the frequency. At frequency 100Hz with of the temperature 600 °C, 650 °C and 700 °C obtaining the complex capacitance of values which are 5.59481x10⁻¹¹F; 7.73048x10⁻¹¹F and 9.38054x10⁻¹¹F. The dielectric constant values are 6.3215; 8.7350 and 10.5994. The loss of dielectric values is 0.0234; 0.0069 and 0.0066. The increasing temperature annealing the thickness value, the complex capacitance, the constant of dielectrics and the losses of dielectrics are increasing.
Keywords: Barium strontium titanite; Sol-gel method; XRD; FESEM; Impedance spectroscopy
Introduction
The development of the era of many changes that occurs in materials is often studied by scientists of science. Ferroelectric is one of the unique materials to be studied and researched. Commonly used ferroelectric thin film materials include Barium Strontium Titanate (BST), Barium Titanate (BaTiO3) and Strontium Titanate (SrTiO3). The BaSrTiO3 material in the last year is highly reviewed and developed, from the above-mentioned ferroelectric thin films Ba0.8Sr0.2TiO3 which acts as a dielectric to increase the capacitance value of the capacitor [1]. This study is a study for the manufacture of BST thin film from a mixture of Barium Carbonate, Strontium Carbonate and Titanium Isopropoxide with a composition ratio of Ba and Sr 0.1: 0.9 or can be written Ba0,1Sr0,9TiO3. The treatment is made by sol gel method or with CSD model, then continuous spin coating and annealing process at temperature 600 °C, 650 °C and 700 °C. Light sensor made of thin film material Ba0,5Sr0,5TiO3 above Si substrate (100) p-type by means of chemical-assisted chemical solution deposition (CSD) method [2].The capacitor is one of the electronic devices that play an important role in the electronics circuit. The value of the capacitor depends on how much charge can be stored. This dependence leads to a capacity already limited to the capacitor. The capacitance of a capacitor can be increased by a dielectric material in the capacitor [3]. BST is a perovskite material based on Barium Titanate (BaTiO3) [4]. Figure 1 shows the perovskite crystal structure of the BST ferroelectric material [5].
Figure 1:The perovskite structure of ferroelectric material [5].
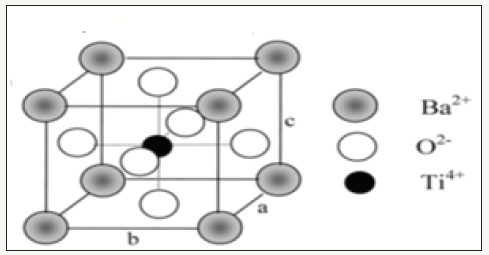
The nature of the perovskite structure of the BST is due to a form with a concomitant with 3,951Å. This situation coincides with the BaTiO3 crystalline structure (a = 3.991Å and c = 4.0108Å) and SrTiO3 (a = 3.897Å) with Ba tau Sr being at zero. The Ti ion is at the center and the three oxygen atoms are at the center of the face. This structure will cause the Ba2 + ions in BaTiO3 to be replaced by Sr2 + ions. Ti4+ ions and O2+ ions in BaTiO3 will exchange places at the c-pipe where the Ba2+ ion is in an almost symmetrical position. Sr2+ ions, Ti4+ and O2+ ions in SrTiO3 remain unchanged in the structure SrTiO3 estimates [6]. CSD or sol gel techniques are one of the simplest and easiest ways of making nanoparticles. The usefulness of this method allows us to design the desired material at low temperatures and as an alternative to conventional methods [7].
These thin films will be characterized using X-ray Diffraction, FESEM and Impedance Spectroscopy, where the characterization using FESEM to obtain the thickness of the sample and characterization using impedance spectroscopy to obtain the value of the dielectric constant can be calculated using the equation:

The dielectric constant ɛ’ is a measure of the ability of a material to store a relative charge in a vacuum chamber [8]. The value of complex capacitance (C*) at a given frequency is obtained through the relationship:

Research Methodology
This research is done by using some step experimental method. The sample was prepared using a sol-gel method placed on a glass substrate using a spin coater and annealing at temperatures of 600 °C, 650 °C and 700 °C while for BST capacitor characterization using XRD, FESEM and Impedance Spectroscopy. Figure 2 shows the flow diagram of the research conducted in the manufacture of BST capacitors. The structure of thin film of BST is shown in Figure 3.
Figure 2:BST capacity building diagram.
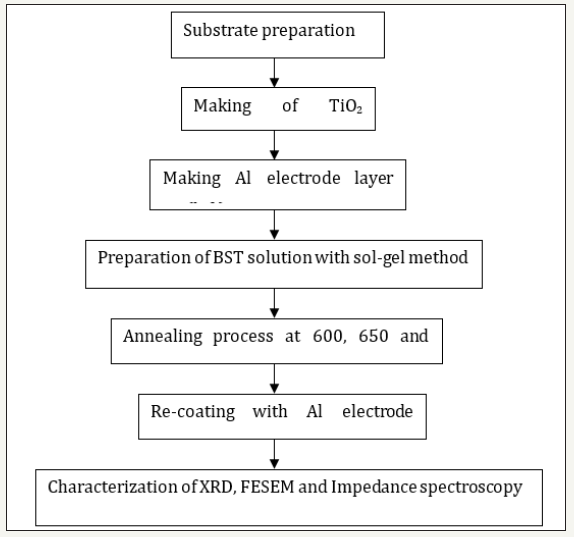
Figure 3:Thin film structure BST.

Results and Discussion
XRD characterization results can be seen in Figure 4 (a) shows the absence of the resulting diffraction peak against the 2θ angle. Without the temperature treatment the annealing structures can be amorphous. The sample has no crystal field but is amorphous [9]. The orientations (010) and (110) contained in the thin film PbZr0,625Ti0,375O3 (PZT) were lost by treatment without annealing [10]. Figure 4b shows the resulting diffraction peak at a 2θ angle. Samples subjected to annealing temperature treatments have a crystal structure. Annealing temperature increases cause the atomic radius to increase in size so that the density becomes increased [11]. The intensity is proportional to the annealing temperature [12].
Figure 4:XRD characterization charts a.300 ; b.600, c.650 and d.700 °C temperatures.
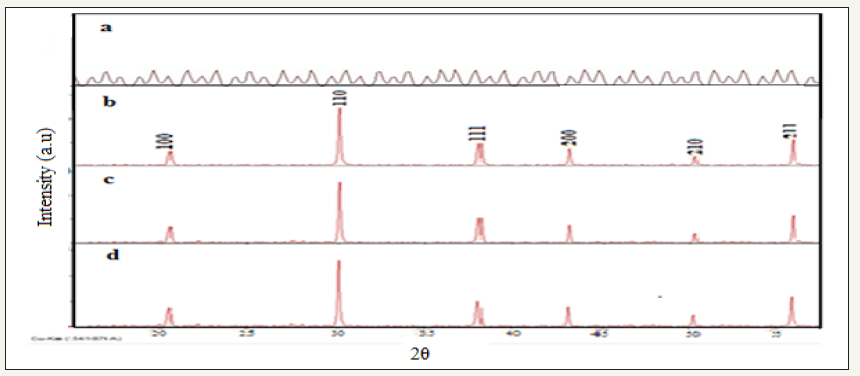
Figure 5:The magnification of the diffraction peak range (110).
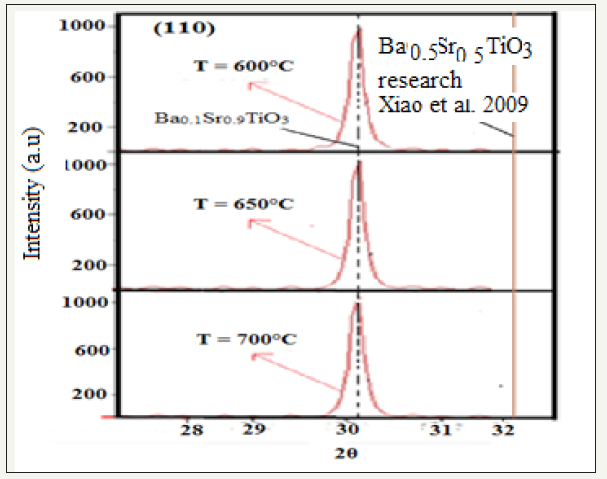
Figure 5 represents the magnification of the range at the diffraction peak 110 against the angle 2θ. the image shows a angular distance difference due to the different compositions where (a) is the result of the study of thin film Ba0.1Sr0.9TiO3 having an angle value of 2θ at the diffraction peak 110 (110) ie 30.1° with annealing temperature 600 °C, 650 °C and 700 °C, while (b) is the result of the study of the thin film Ba0.5Sr0.5TiO3 having an angle value of 2θ at the diffraction peak (110) i.e., 32.1° with annealing temperature of 650 °C 700 °C and 800 °C [13]. The composition difference of x=0.4 resulted in an angle of 2θ having a difference of 2.1°. The result of data calculation using match3! shown in Table 1. Characterization using FESEM can be seen in the following Figure 6(a-c).
Table 1:Effect of annealing temperature on intensity at 2 theta.

Figure 6:BST film thickness annealed at temperatures (a) 600 0C, (b) 650 0C and (c) 700 0C.
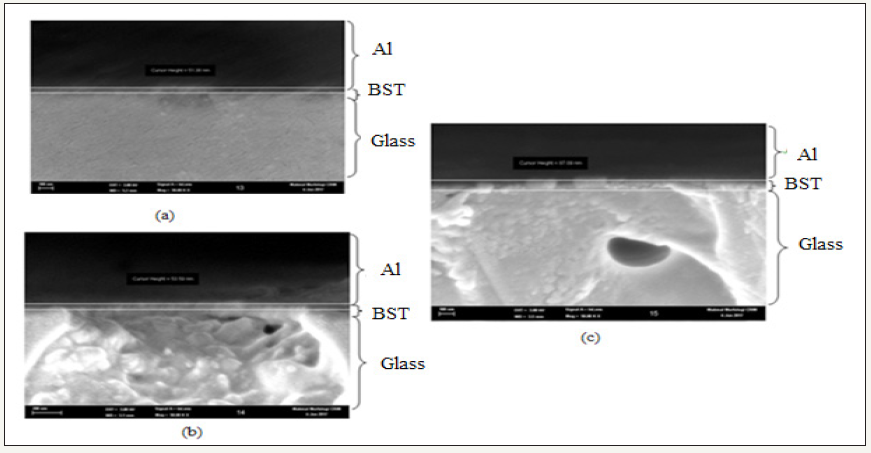
Figure 7:Graph of bode plot complex capacitance to frequency.
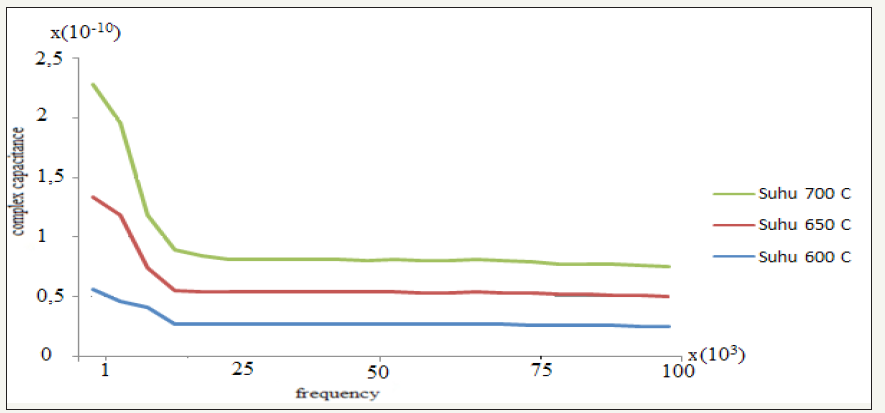
Figure 8:Graph of bode plot dielectric constant to frequency.
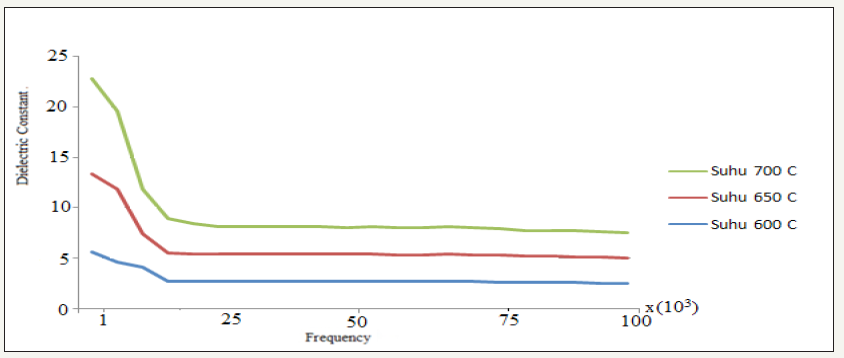
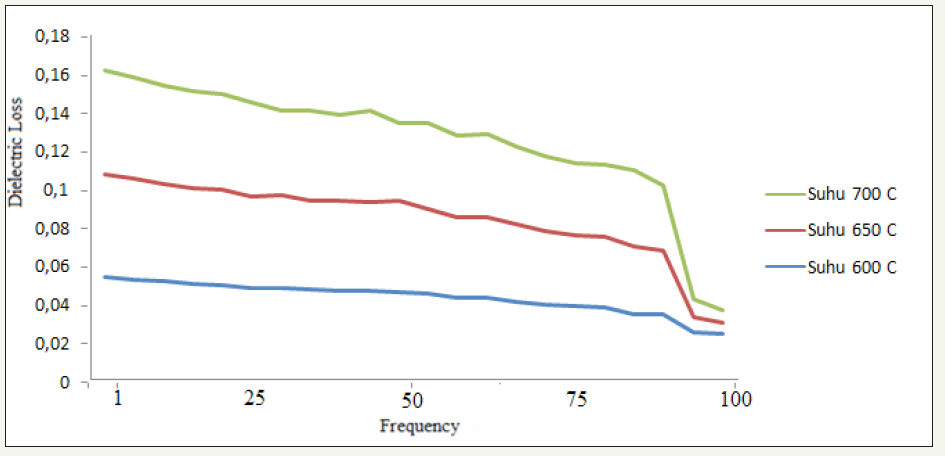
FESEM characterization of annealed samples at temperatures of 600 C, 650 °C and 700 °C produces thicknesses of Ba0.1Sr0.9TiO3 capacitors. Figure 6(a-c) samples of BST annealing at temperatures of 600, m; 53.59nm and 87.09nm. Enhancement temperature annealing causes the size of BST layer thickness to be greater [14]. Annealing temperature increases cause the size of the BST constituent particles to be larger so that the atoms in it are more orderly and solid [15]. Characterization using Impedance Spectroscopy in order to know the value of complex capacitance, dielectric constant and dielectric loss. Values obtained at temperatures of 600 °C, 650 °C and 700 °C are shown in Figures 7-9 which are bode plot graphs ie the relationship between complex capacitance, dielectric constant and dielectric loss to frequency. Figures 7-9 are graphs of complex capacitance bode plot, dielectric constant and dielectric loss to frequency. Temperature 600 °C, 650 °C and 700 °C at 100Hz frequency of complex capacitance of 5.59x10⁻¹¹F, 15x10-11F and 25 x10-11F. The dielectric constant value is 6.32, 14.73 and 23.59. Dielectric loss value is 0.045; 0.11 and 016. The same frequency of complex capacitance values increases as a result of annealing temperature increases [16]. The dielectric constant increases with increasing annealing temperature from 550 °C to 800 °C [17]. The frequency rises from 100 Hz to 1MHz, dielectric decreases and dielectric losses increase sharply [18].
Figure 9:Graph of bode plot dielectric loss to frequency.
Conclusion
The XRD characterization shows intensity value increases with increasing annealing temperature and the resulting structure is cubic. FESEM characterization produces thickness. The thickness is directly proportional to the temperature. The characterization of impedance spectroscopy results in the value of complex capacitance, the dielectric constant inversely proportional to the frequency. Dielectric loss is directly proportional to frequency.
Acknowledgment
The author would like to thank to Universitas Riau (UNRI) and members of materials group at Universitas Riau for their advice and help.
References
- Siskandar R, Irmansyahdan Irzaman (2013) Temperature sensorsbased material film ferroelectric Ba0.55Sr0.45TiO3 (BST) Assisted Azmega 8535 Microcontroller. Journal of Biophysics 9(2): 1-12.
- Huriawati F, Erawan K, Irzaman (2016) Pengujian film tipis Ba0,5Sr0,5TiO3 (BST) as an electronic circuit assisted light sensor. JPFK 2(2): 61-64.
- Tipler A, Paul (2001) (3rd edn), basic physics. Erlangga, Jakarta, Indonesia.
- Tukimin (2012) Perovskite (Ba, Sr) TiO3 material impedance spectroscopy study at high temperature. Thesis of the Faculty of Mathematics and Natural Sciences, University of Indonesia, Indonesia.
- Jona F, dan Shirane G (1993) Ferroelectric crystals. Dover Publication, Inc., New York, USA.
- Samantaray CB, Sim H, dan Hwang (2005) first-principles study of electronic structure and optical properties of barium strontium titanates (BaxSr1-xTiO3). Applied Surface Science 250: 146-151.
- Dharmawan, W dan DiahSusanti (2012) Measurement of co gas sensitivity from wo3 material results of sol gel and calcination process against variation in concentration and operational temperature. POMITS Technical Journal 1(1): 1-5.
- Rahmi D, Krisman, Khaironiati, Fauziana (2014) Characterization of ferroelectric material microstructure Ba0,8Sr0,2TiO3 (BST) with variation in temperature annealing. Indonesian Journal of Physics 53(18): 70-71.
- Dorris M (2013) Effect of grain size on perovkite BaTiO3 impedance material spectroscopy. Universitas Indonesia. Depok, Indonesia.
- Umiati NAK, Irzaman, Maman B, Barmawi M (2001) Annealing effect on growth of ferroelectric thin films PbZr0.625Ti0.375O3 (PZT). Indonesian Physical Contributions 12(4): 96-98.
- Liman J, Budi H, Tantan TR, Umi T, Muhammad K, et al. (2015) Thin film characteristics test Ba0.55Sr0.45TiO3 on corning glass substrates 7059. Indonesian Physics Journal 55: 45-48.
- Waseda Y, Eiichiro M, Kozo Shinoda (2011) X-ray diffraction crystallography. Introduction example and solved problems. Sendai: Springer.
- Xiao B, Vitaliy A, Hongrui L, Emmanuel R, Jacob L, et al. (2009) Effect of large strain on dielectric and ferroelectric properties of Ba0.5Sr0.5TiO3 thin film. Applied Physics Letters, pp. 95-98.
- Zhu X, Lu S, Chan HLW, Choy CI, Wong KH (2003) Microstructural And dielectric properties of compositionally graded (Ba1-xSrx) TiO3 thin films prepared by pulsed layer deposition. Applied Physics A Material Science and Processing 76(2): 225-229.
- Gridharan NV, Jayavel R, Ramasami P (2001) Structural, morphological and electrical studies on barium strontium titanate thin films prepared by sol-gel technique. Crystal Research Technology 36(1): 65-72.
- Macdonald JR (1987) Impedance spectroscopy. John Wiley and Sons, Inc., New Jersey, USA.
- Fu C, Chuanren Y, Hongwei C, Liye H, Yingxin W (2005) Ferroelectric properties of Ba0.6Sr0.4TiO3 thin film with different grain size. Materials Letters 59(2-3): 330-333.
- Wu Di, Aidong L, Huiqin L, Xiaobo Y, Chuanzhen G, et al. (2000) Preparation of (Ba0.5Sr0.5) TiO3 thin film by sol-gel method with rapid thermal annealing. Applied Surface Science 165(4): 309-331.
© 2019 Rahmi Dewi . This is an open access article distributed under the terms of the Creative Commons Attribution License , which permits unrestricted use, distribution, and build upon your work non-commercially.
 a Creative Commons Attribution 4.0 International License. Based on a work at www.crimsonpublishers.com.
Best viewed in


.jpg)


 Editorial Board Registrations
 Submit your Article
 Refer a Friend
 Advertise With Us
.jpg)


.jpg)


.bmp)
.jpg)
.png)
.jpg)


.jpg)


.png)

.png)


.png)


