- Submissions

Full Text
Research & Development in Material Science
Metal Oxide Nanomaterials as Photo-Catalyst for Dye Degradation
Sayed M Saleh1,2*
1 Chemistry Department, KSA
2 Chemistry Branch, Department of Science and Mathematics, Egypt
*Corresponding author: Sayed M Saleh, Chemistry Branch, Department of Science and Mathematics, Egypt
Submission: January 02, 2019; Published: January 16, 2019

ISSN: 2576-8840 Volume9 Issue2
Abstract
One of the most important metal oxide nanoparticles, zinc oxide (ZnO) nanoparticles, were synthesized by a simple hydrothermal method. The synthesis ZnO nanorods were carried out using an organic solvent (methanol) and in the presence of hexadecyltrimethylammonium bromide (CTAB) as an organic additive. The size of the synthesized ZnO nanorods (around 100 nm in length and 10-15nm diameter). The main point of this study is to investigate the influence of the ZnO nanocatalysts on the photocatalytic degradation of methylene blue (MB) dye. As-synthesized ZnO nanorods were characterized utilizing Transmission Electron Microscope (TEM), X-ray diffraction (XRD), Brunauer, Emmett, and Teller, (BET) and UV-Visible spectroscopic techniques. The XRD data analyses provide that ZnO nanorods have hexagonal crystalline structure. ZnO nanorods provide high photocatalytic activity on the degradation process of MB, a widespread water contaminant. The photocatalytic process was carried out under UV radiation. The influences of significant parameters as the adsorption efficiency of nanorods to MB molecules in dark, the nanocatalysts load, the initial concentration load of MB, calcination of the nanocatalysts, and stirring the solution were studied. The degradation of methylene blue decrease within dye concentration range of 10 to 50mg/L, the maximum efficiency of the photocatalytic degradation process of the dye achieved with nanocatalyst load of 100mg/L in order to reach 98.28% of dye degradation after one hour. Moreover, the kinetics of photocatalytic reaction process based on ZnO nanorods follow pseudo-first-order with a rate constant of 58.6 x10⁻³ min-1.
Keywords: Metal oxide; ZnO; Nanorods; Photocatalysts; Methylene blue; Photo-degradation
Introduction
Nowadays, Dyes and pigments are the most significant pollutants cause an extremely dangerous effect on water resources. Moreover, these organic materials, even with minimum concentration, cause substantial harm in the aquatic environment [1-3]. Also, these compounds cause color changes in the fresh water. Thus, the contamination can be detected easily as an indication for the existence of dye molecules in fresh water. These pollutant molecules prevent sunlight reach the aquatic plant and animal species and quenches the Photo-synthetically active radiation (PSA) in the ecosystem [4-7]. Methylene blue (MB) is one of the most applied dyes in industry. Additionally, this dye has been utilized in many manufactured products such as plastics, textile, paper and in many toxicology studies. Also, it has been provided as an indicator in clinical medicine and as an antidote in the treatment of methemoglobinemia. MB is an insignificant hazard material causes many dangerous effects such as eye irritation, anemia, nausea and vomiting [8]. Thus, treatment of contaminated water with MB dye is of noteworthy importance.
The wastes rising from textile manufacture, especially the dying process, have a substantial influence on the ecosystem, which change the physical properties of water and the sunlight access, and consequently, change the activity of photosynthetic processes and the gases solubility in water. Most of the water contamination based dye wastes may be attributed to the dyeing processes in textile manufacture [9,10]. Recently, several treatment routes were utilized in order to treat wastewater containing pigment or dye molecules as incineration, bio-treatment, ozonation, and adsorption processes based on solid adsorbents [11-14]. However, these methods show some disadvantages such as (i) production of toxic volatile constituents in incineration process; (ii) evolution of bad smell in biological treatment; and (iii) influence of significant parameters in the medium as pH, salt ions content, and temperature in ozonation process. For these important reasons, the metal oxide photocatalysis introduces an appropriate substitute for pigments and dye degradation. This developed technique has several advantages over other conventional techniques such as the dye degradation process ends with harmless final products [15,16]. However, biological decolorization is not a commonly effective technique for most of the azo dyes. Recently, metal oxide photocatalysis utilizing semiconductors such as zinc dioxide has provided much attention cause its capability for dye degradation from wastewater [17,18]. This process helps to convert the composition of organic dyes entirely into H2O, CO2, and other non toxic compounds without conveying other consequent pollution [19].
Among various photocatalysts, the semiconductor metal oxides, TiO2 and ZnO are widely used in the degradation of organic pollutants because of their environmental feasibility, extreme photocatalytic activity, and simplicity of production [20,21]. The ZnO nanocatalysts have 3.37eV band gap energy extreme exciton binding energy of approximately 60meV [22]. at room temperature. Thus, these type of semiconductor nanoparticles shows higher photocatalytic degradation proficiency with respect to other materials such as TiO2 [23-25]. Additionally, ZnO nanomaterials are simply prepared, abundant and eco-friendly material. Therefore, these nanocatalysts were developed as a significant treatment tool in many environmental applications [26]. In the dye photocatalytic degradation process based ZnO nanomaterials, the energy of incident photons is higher than that of the energy of the band gap energy of the ZnO metal oxide. This energy has the attendance to generate photo-induced electron-hole pairs [27].
Several methodologies were developed in order to prepare ZnO nanomaterials with different shapes. we have obtained bundled nanowires grown on ZnO hexagonal disks, well-aligned ZnO whisker arrays. Many types of research have discussed the usage of organic additives to synthesis controlled and tuned nano-sized ZnO photocatalysis. Also, this can provide a smart tool for improving the adsorption efficiency of the as-synthesized nanomaterials and for controlling the removal of organic spices at interfaces. Recently, several methods were developed to obtain hierarchical ZnO nanorod with hollow super-structures for Applying in many photocatalysis and photoluminescence applications based on a hydrothermal method using water-soluble biopolymer sodium carboxymethylcellulose (CMC) [28]. Moreover, Researchers used a hydrothermal route to prepare ZnO with a facile amino acid histidine to yield hierarchical architectures, such as prism-like, flowerlike structures and hollow microspheres. The resulting nanomaterials show precious photocatalytic activities [29]. These studies provided significant routes for controlling the morphology of ZnO nanomaterials.
In this work, we provide a simple route for synthesizing hierarchical ZnO nanostructure via methanol solvent based on the hydrothermal method and their significant application a photocatalyst. Solvent plays important roles in the formation and self-assembly of ZnO architectures. we have studied the photocatalytic degradation process of significant dye solution MB. The photocatalytic reaction is depending on the adsorption process of the UV radiation by the nanocatalysts, typically a semiconductor, which is zinc oxide ZnO. The benefit of this route is that no chemical compounds other than ZnO were presented in the medium solution to be treated after the degradation process of the MB dye pollutant. The Photocatalytic dye degradation process based ZnO nanomaterials is gradually providing an unconventional technology for the treatment of water pollution. The purpose of the current work is to introduce a fast, economical and eco-friendly solution to water treatment. Moreover, this study investigates the photocatalytic degradation of MB dye molecules using ZnO nanorods and their performance based on various parameters.
Materials and Methods
Chemicals and reagents
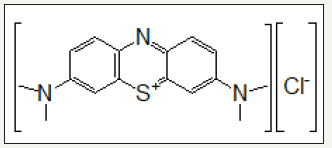
Zinc nitrate Zn (NO3)2.6H2O, potassium hydroxide (KOH), methanol (CH3OH), hydrochloric acid (HCl), sodium hydroxide (NaOH), methylene blue (C14H14N3O3SNa) as shown in Figure 1. and hexadecyltrimethylammonium bromide (CTAB), were purchased from Sigma Aldrich and with the highest purity and used as obtained.
Figure 1:Chemical structure of methylene blue.
Instruments
A JEOL instrument (TEM, JEOL Inc., Tokyo, Japan) was utilized for collecting TEM images of the ZnO nanorods with adjustment of an acceleration voltage of 200kV. The powder XRD patterns were executed using a Philips” diffractometer (type PW 1730) with Nifiltered, Co radiation (l = 1.79) at 30kV and 20mA. The specific area of the as-synthesized nanorods was determined utilizing, Brunauer, Emmett, and Teller, nitrogen adsorption method. This measurement was carried out using a Micrometrics instrument model ASAP 2010. The UV-visible recording spectrophotometer Shimadzu-Japan was used to detect the absorbance of light wavelengths.
Synthesis of ZnO nanorods
Synthesis of the ZnO nanorods was executed according to the following procedure, 20mL of 1M KOH was mixed with 100mL of CH3OH and the mixture was stirred for 10min using magnetic stirrer, and then, 20 mL of 0.4 M Zn(NO3)2.6H2O solution was mixed with the above solution. The mixture was stirred for 10min, and then, 20mL of the mixed solution was transferred to a Teflon-lined stainless-steel autoclave (25mL capacity). The autoclave was firmly blocked. The autoclave transferred to furnace and the temperature was adjusted at 120 0C for 5hrs. CTAB as an organic precursor was added to the resulting solution in order to monitor the morphology of the ZnO particles. After the reaction was finished, the autoclave was cooled down in the air, and the white ZnO nanorods powder was centrifuged and washed several times with water and ethanol respectively.
Photocatalytic degradation process
The stock solution of MB dye aqueous solution 100mL of given concentration was added to a definite amount of ZnO nanorods catalysts in a reaction tube manufactured from quartz. The mixture solution was kept in dark for 30min in order to reach adsorption equilibrium. The tube was exposed to a UV radiation lamp. The mixture of photocatalysts and dye was stirred and concurrently purged with a current of air. A solution portions were withdrawn at consistent intervals of 5min. Before investigation of dye degradation process, the collected portions were centrifuged at 4000 rpm for 10min to remove all nanocatalysts from solution. The UV-spectra of the clear supernatants were measured at 669nm [30].
Results and Discussion
Characterization of nanomaterials
Figure 2:TEM image of the ZnO nanospheres synthesized using methanol as solvent.
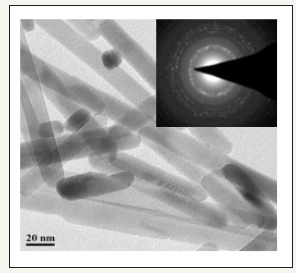
The morphology of zinc oxide nanorods structure is acquired by using methanol as solvent. Figure 2 provides the distinctive TEM images of the synthesized ZnO nanorods. The particles are lucent with a length of 100nm and an approximate diameter of ZnO nanorods is about 10-15nm. the typical SAED pattern with intense rounded circles related to the (100), (002), (101), (102), (110), (103), (200), (112) and (201) planes confirm that the resulting ZnO nanorods are extremely hexagonal crystalline. Moreover, the small particle size and the large surface area to volume ratio of the ZnO nanorods, these could promote the aggregation of ZnO nanorods. Thereby, they are applied in the photocatalytic degradation of Methylene Blue (MB). The BET analysis was applied to measure the specific surface area of the synthesized nanorods. Data of the BET analysis provided a specific surface area of surface area of 62.8m2/g and total pore volume 0.18cm3/g [31].
X-ray powder diffraction patterns of ZnO nanorods
The ZnO nanorods were characterized using in term of crystal structure using X-ray diffraction (XRD). The patterns were detected within a 2θ range of 20-80° with a scanning step of 0.01° (Figure 3). the XRD data analyses show high coincidence with the JCPDS file of ZnO, which can be referred to as a hexagonal phase. The absence of any impurities peak indicates the high purity of the nanoparticles. Furthermore, the sharpness of the diffraction peaks indicates that the synthesized nanorods have an extraordinary crystal structure. The sharp peaks related to the planes (100), (002) and (101), showing a clear randomness orientation of ZnO nanorods [32].
Figure 3:XRD patterns of the ZnO nanorods.

Absorption spectra measurements
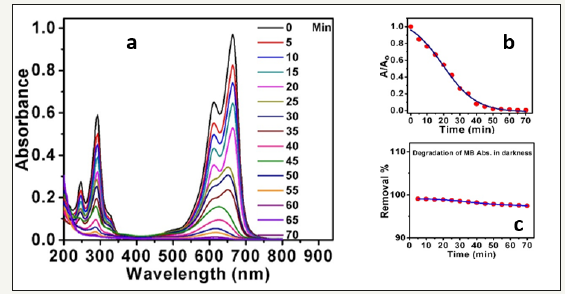
Methylene blue exhibit characteristic absorption peaks. These peaks centered at 292 and 664nm respectively. In the presence of the nanocatalysts (ZnO nanorods), a considerable dramatic decrement in 664nm band is detected under UV radiation. This attributes to the photocatalytic degradation of MB based on the ZnO nanorods as an efficient photocatalyst (as shown in Figure 4a). Also, the ratiometric absorbance of the MB versus time was plotted in Figure 4b and indicated that the degradation process of MB dye professionally carried out in presence of ZnO nanorods within only 1 hour. For more investigations, the absorption spectra of MB with time was collected at 664nm using ZnO nanorods in darkness. The dye shows high stability in absence of UV radiation, and the degradation process doesn’t take place efficiently (see Figure 4c). the data analysis exhibited that the surface adsorption of the MB to the surface of the ZnO nanorods is stabilized after 5min under regular stirring of the mixture in darkness and no more degradation occurs. So, in all degradations experiments to confirm achievement of adsorption equilibrium, the mixture was stirred in darkness for 10min.
Figure 4:a: Absorbance spectra of methylene blue in the presence of ZnO photocatalyst nanorods using 100mg/L ZnO nanospheres, MB 20mg/L;
b: Ratiometric absorption spectra versus time at a wavelength of 664nm under UV radiation;
c: Degradation of MB in presence of ZnO nanorods and in darkness.
Influence of ZnO nanorods load on the degradation process
The influence of the concentration of photocatalyst was investigated. Firstly, the photo-degradation process of the dye was studied in presence of ZnO nanorods in dark as shown in Figure 5a. The percent of the dye adsorption in presence of different concentrations of ZnO nanorods within a time range of (0 to 70min) was detected. Thus, this will investigate the adsorption effect of the dye molecules (adsorbate) to the surface of the ZnO nanorods (adsorbent). Secondly, the same experiment was carried out under such conditions but under UV radiation (Figure 5b). Memorable, the degradation percent of the MB dye molecules were calculated by subtracting the degradation (adsorption) percent in dark at the same exposure time. In both cases, the degradation percent is directly proportional to the ZnO nanorods load within the range of (25-150mg) and then decreases with increment the photocatalysts load. This may be attributed to increasing the active sites of the photocatalyst nanorods with increasing the concentration where the carriers easily reach the surface to participate in photoactivity. Also, the small the crystallite size enhances the probability of charge recombination outside the barrier region [33]. But, with the further increment of photocatalyst concentration (100-150mg), the aggregation of the nanomaterials takes place. Thus, the photons can’t find their way to the surface of the nanorods and most of the active surface suites are blocked.
Figure 5:Plots of removal percent as a function of MB degradation versus Time (min).
(a) degradation process in presence of ZnO nanorods and absence of UV radiation;
(b) in presence of ZnO and under UV radiation.

Effect of methylene blue concentration
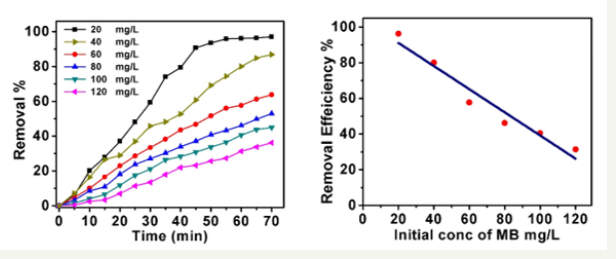
In order to investigate the initial concentration of methylene blue dye on the photodegradation process, the degradation process was carried out in presence of a definite amount of ZnO nanocatalysts with varying the initial concentration of MB within range of (20 to 120mg/L) during a time of (70min). The results are given in Figure 6a. The data analysis proved that the degradation of MB was significantly affected by enhancing the initial concentration of MB dye. This can be referred to the decreasing of the active sites densities on the surface of the nanorods. Thereby, the amount of produced hydroxyl radicals decreases and this could decrease the performance of the photocatalytic process. On the other hand, increase the number of MB dye molecules also reduce the photon path length that entering the MB stock solution. Figure 6b exhibits the relation between the removal efficiency of the degradation process against the initial concentrations of methylene blue after 60min exposure time. while increase the initial concentration of MB, the dye particles can absorb a significant extent of light radiation larger than the nanocatalysts [34] and this can also affect the proficiency of the degradation process [35,36], Thus, the proper initial concentration of MB dye concentration was selected to be 20 mg/L for all experiments.
Figure 6:(a) Initial concentration influence on dye degradation process, the concentration of ZnO nanospheres of 100mg/L and time 70min,
(b) effect of initial concentrations of MB on the removal efficiency at time 60min.
Influence of stirring
Figure 7:Influence of stirring effect on the efficiency of MB degradation during time 70min, the initial dye concentration of 10mg/mL and 100mg/L ZnO nanorods concentration.
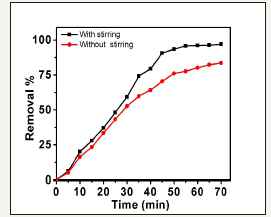
In order to investigate the effect of stirring on the rate of degradation of the MB dye based ZnO nanorods photocatalysts, some experiments were investigated under optimum conditions such as 100mg/L ZnO nanorods, 20mg/L Mb and of time 70min. The data introduced in Figure 7. The data show that the rate of degradation of MB in presence of nanocatalysts increases in presence of stirring the reaction mixture. Firstly, the increase in stirring solution increases the total dissolved oxygen exists between the solution layers. Hence, the additional dissolved oxygen has an important influence on the production of hydroxyl radicals. Memorable, stirring the solution to quench the equilibrium time by enhancing the rate of diffusion of the MB molecules to the nanocatalysts surface [37].
Influence of calcination on the optical activity of ZnO nanorods
Figure 8:Effect of calcination temperatures on the degradation of MB dye. 100mg/L photocatalysts, MB 10mg/L, time 40min.
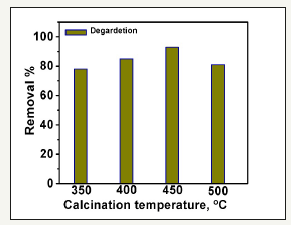
Different temperatures within the range of 300 to 500 were applied to investigate the influence of calcination temperature on the photoactivity of the ZnO nanorods. The data was introduced in Figure 8. The results analysis show that increasing the calcination temperature enhances the photoactivity of the nanorods on MB degradation process. The maximum activity was shown at 450 0C. Moreover, after this calcination point, the photoactivity of the calcined ZnO nanorods starts to quench. This could be attributed to the presence of organic additives residual carbon on the surface of the nanorods which decreases the photoactivity process [38]. At 450 0C, the complete burning takes place, and the percent of ZnO in the sample reached a maximum value.
Kinetic study of the photocatalytic degradation of MB based on ZnO nanorods
The kinetics of photocatalytic degradation of MB under UV irradiation was investigated. It is found that the degradation kinetics pursues the pseudo-first-order reaction and follows the following equation [39]:

Where
k: rate constant of the dye degradation,
Co: initial concentration of the MB dye solution
Ct: concentration of MB at equilibrium time t.
Using MB initial concentration of 20mg/L and varying photocatalysts loads, plots of ln (Co/Ct) versus t (min) offered in Figure 9. The data analysis provides linear relations with R2 (correlation coefficients) with an average value of 0.978 for the ZnO nanorods photocatalysts. This proves the confirmatory of the pseudo-first-order reaction kinetic model form ethylene blue photocatalytic degradation. The pseudo-first-order reaction postulated that one reactant should exist in large excess, thus the participation of this reactants remains unchanged during the kinetic detection process. Therefore, the deviation exists in Figure 9 refers to one of the reactants doesn’t exist inadequately large excess.
Figure 9:The relation of ln(Co/Ct) as a function of time utilizing MB of 20mg/L and monitoring catalyst load concentration within range (25 to 150mg/L).
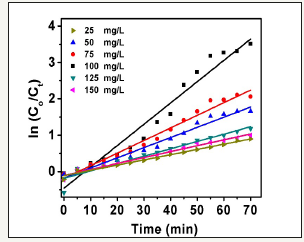
Moreover, the as-prepared ZnO nanorods are not extremely monodisperse in size. The rate constant was calculated based on the slope value of the linear relation ln (Co/Ct) versus t (min) and given in Table 1. The greatest rate constant was observed with optimum ZnO nanorods load of 100mg/L with a value of 58.6 x 10⁻³min-1. This could be attributed to the extreme electron deficient sites produced through the hydrothermal process that could deceive photo-generated electrons and decrease undesired recombination process. Therefore, the improvement of the dye degradation activity increase.
Table 1:Photocatalytic degradation rate constant (k) for methylene blue under UV radiation.

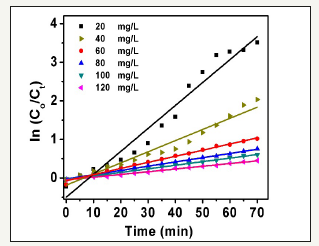
The photocatalytic process shows highest activity with 100mg/L ZnO nanorods load, thereby ln (Co/Ct) versus time (min) was plotted with varying the initial concentrations of methylene blue dye in order to study the effect of the second reactants (MB) on the degradation process Figure 10. The data analysis provides linear relations with a correlation coefficient (R2) of 0.98. It was noticed that photocatalytic degradation rate of dye quenches with the increasing the dye concentration within a range of (20 to 120mg/L). The rate constant values of the degradation process were calculated and presented in Table 1 as well as figured out in Figure 10.
Figure 10:The relation of ln(Co/Ct) as a function of time utilizing nanocatalyst concentration of 20mg/L and monitoring MB initial concentration within range (25 to 150mg/L).
Conclusion
Herein, ZnO nanorods photocatalyst were synthesized by hydrothermal methods and were characterized in terms of morphology and size by utilizing XRD, TEM, and BET. Photocatalyst synthesized by hydrothermal method had hexagonal crystalline structure. The photocatalytic activity of ZnO nanorods was investigated utilizing degradation of MB dye. The efficiency of the MB degradation process enhances with an increase in the amount of ZnO photocatalyst up to 100mg/L and then decreases with an over-loading concentration of photocatalyst than 100mg/L. However, with a constant photocatalyst concentration, the efficiency of the degradation process decreases with increase MB dye concentration. By utilizing an initial concentration MB of 20mg/L, maximum degradations of MB under UV radiation at 1h was 98.28 % under stirring in the air atmosphere. The degradation process follows pseudo-first-order reaction kinetics, this resembled a rate constant of 58.6 × 10⁻³. This study provides an economy eco-friendly solution to water treatment problem.
References
- Robinson T, McMullan G, Marchant R, Nigam P (2001) Remediation of dyes in textile effluent: A critical review on current treatment technologies with a proposed alternative. Bioresource Technology 77(3): 247-255.
- Pearce C I, Lloyd J R, Guthrie J T (2003) The removal of colour from textile wastewater using whole bacterial cells: A review. Dyes and Pigments 58(3): 179-196.
- Talarposhti AM, Donnelly, T, Anderson, G K (2001) Colour removal from a simulated dye wastewater using a two-phase Anaerobic packed bed reactor. Water Reserch 35(2): 425-432.
- Prado AGS, Torres JD, Faria EA, Dias SCL (2004) Comparative adsorption studies of indigo carmine dye on chitin and chitosan. Journal of Colloid and Interface Science 277(1): 43-47.
- Chiou MS, Li HY (2002) Equilibrium and kinetic modeling of adsorption of reactive dye on cross-linked chitosan beads. Journal of Hazardous Materials 93(2): 233-248.
- Prado AGS, Costa LL (2009) Photocatalytic decouloration of malachite green dye by application of TiO2 nanotubes. Journal of Hazardous Materials 169(1-3): 297-301.
- Clifton JII, Leikin JB (2003) Methylene Blue. American Journal of Therapeutics 10: 289-291.
- Balcha A, Yadav OP, Dey T (2016) Photocatalytic degradation of methylene blue dye by zinc oxide nanoparticles obtained from precipitation and sol-gel methods. Environmental Science and Pollution Research 23(24): 25485-25493.
- Koyuncu I (2003) Influence of dyes, salts and auxiliary chemicals on the nanofiltration of reactive dye baths: Experimental observations and model verification. Desalination 154(1): 79-88.
- Bergamini RBM, Azevedo EB (2009) Araujo LR Heterogeneous photocatalytic degradation of reactive dyes in aqueous TiO2 suspensions: Decolorization kinetics. Chemical Engineering Journal 14: 9215-220.
- Lee JK, Gu JH, Kim MR, Chun HS (2001) Incineration characteristics of dye sludge in a fluidized bed incinerator. Journal of Chemical Engineering of Japan 34(2): 171-175.
- García-Montaño J, Domenech X, García-Hortal JA, Torrades F, Peral J (2008) The testing of several biological and chemical coupled treatments for Cibacron Red FN-R azo dye removal. Journal of Hazardous Materials 154(1-3): 484-490.
- Chu W, Ma CW (2000) Quantitative prediction of direct and indirect dye ozonation kinetics. Water Research 34(12): 3153-3160.
- Prado AGS, Miranda BS, Jacintho GVM (2003) Interaction of indigo carmine dye with silica modified with humic acids at solid/liquid interface. Surface Science 542(3): 276-282.
- Prado AGS, Faria EA, SouzaDe JR, Torres JD (2005) Ammonium complex of niobium as a precursor for the hydrothermal preparation of cellulose acetate/Nb2O5 photocatalyst. Journal of Molecular Catalysis A: Chemical 237(1-2): 115-119.
- Torres JD, Faria EA, SouzaDe JR, Prado AGS (2006) Preparation of photoactive chitosan-niobium (V) oxide composites for dye degradation. Journal of Photochemistry and Photobiology A: Chemistry 182(2): 202- 206.
- Akpan UG, Hameed BH (2009) Parameters affecting the photocatalytic degradation of dyes using TiO2-based photocatalysts: A review. Journal of Hazardous Materials 170(2-3): 520-529.
- Makita M, Harata A (2008) Photocatalytic decolorization of rhodamine B dye as a model of dissolved organic compounds: Influence of dissolved inorganic chloride salts in seawater of the Sea of Japan. Chemical Engineering and Processing 47(5): 859-863.
- Zhu H, Jiang R, Fu Y, Guan Y, Yao J, Xiao L, Zeng G (2012) Effective photocatalytic decolorization of methyl orange utilizing TiO2/ZnO/ chitosan nanocomposite films under simulated solar irradiation. Desalination 286: 41-48.
- Ashai R, Marikawa T, Ohwaki T, Aoki K and Taga Y (2001) Visible light photocatalysis in Nitrogen -doepd Titanium oxides. Science 293: 269- 271.
- Sakthivel S, Neppolian B, Shankar MV, Arabindoo B, Palanichamy M, et al. (2003) Solar photocatalytic degradation of azo dye: comparison of photocatalytic efficiency of ZnO and TiO2. Solar Energy Materials & Solar Cells 77(1): 65-82.
- Babita B, Kumar DK, Manorama SV (2006) Hydrothermal synthesis of highly crystalline ZnO nanoparticles: A competitive sensor for LPG and EtOH. Sensors and Actuators B: Chemical 119(2): 676-682.
- Lee KM, Lai CW, Ngai KS, Juan JC (2016) Recent developments of zinc oxide based photocatalyst in water treatment technology: a review. Water Research 88: 428-448.
- Xia Y, Wang J, Chen R, Zhou D, Xiang L (2016) A review on the fabrication of hierarchical ZnO nanostructures for photocatalysis application. Crystals 6(11): 148.
- Muruganandham M, Zhang Y, Suri R, Lee GJ, Chen PK, Hsieh SH, et al. (2015) Environmental applications of ZnO materials. Journal of Nanoscience and Nanotechnology 15(9): 6900-6913
- Yoo DH, Cuong TV, Luan VH, Khoa NT, Kim EJ, Hur SH, et al. (2010) Photocatalytic performance of Ag/ZnO/CCG multidimensional heterostructure prepared by a solution-Based method. The Journal of Physical Chemistry C 116(12): 7180-7184.
- Kudo A, Miseki Y (2009) Heterogeneous Photocatalyst materials for water splitting. Chemical Society Reviews 38(1): 253-278.
- Yin J, Lu Q, Yu Z, Wang J, Pang H, Gao F (2009) Hierarchical ZnO nanorodassembled hollow superstructures for catalytic and photoluminescence applications. Crystal Growth and Design 10(1): 40-43.
- Wu Q, Chen X, Zhang P, Han Y, Chen X, et al. (2008) Amino acid-assisted synthesis of ZnO hierarchical architectures and their novel photocatalytic activities. Crystal Growth and Design 8(8): 3010-3018.
- Kwon CH, Shin H, Kim JH, Choi WS, Yoon KH (2004) Degradation of methylene blue via photocatalysis of titanium dioxide. Materials Chemistry and Physics 86(1): 78-82.
- Kruk M, Jaronie M (2001) Adsorption characterization of ordered organic-Inorganic nanocomposite materials. Chemistry of Materials 13(10): 3169-3183.
- Kang SZ, Wu T, Li X, Mu J (2010) A facile gelatin-assisted preparation and photocatalytic activity of zinc oxide nanosheets. Colloids and Surfaces A: Physicochemistry and Engineering Aspects 369(1-3): 268-271.
- Ong CB, Ng LY, Mohammad AW (2018) A review of ZnO nanoparticles as solar photocatalysts: synthesis, mechanisms and applications. Renewable and Sustainable Energy Reviews 81(1): 536-551.
- Shanthi M, Kuzhalosai V (2012) Photocatalytic degradation of an azo dye, acid red 27, in aqueous solution using nano ZnO. Indian Journal of Chemistry 51A: 428-434.
- Zhang L, Cheng H, Zong R, Zhu Y (2009) Photo corrosion suppression of ZnO nanoparticles via hybridization with graphite-like carbon and enhanced photocatalytic activity. Journal of Physical Chemistry C113(6): 2368-2374.
- Ahmad M, Ahmed E, Hong ZL, Ahmed W, Elhissi A, et al. (2014) Photocatalytic, sonocatalytic and sonophotocatalytic degradation of Rhodamine B using ZnO/CNTs composites photocatalysts. Ultrasonics Sonochemistry 21(2):761-773.
- Bagheri AR, Ghaedi M, Asfaram A, Jannesar R, Goudarzi A (2017) Design and construction of nanoscale material for ultrasonic assisted adsorption of dyes: application of derivative spectrophotometry and experimental design methodology. Ultrasonics Sonochemistry 35: 112-123.
- Nasrollahzadeh MS, Hadavifar M, Ghasemi SS, Chamjangali MA (2018) Synthesis of ZnO nanostructure using activated carbon for photocatalytic degradation of methyl orange from aqueous solutions. Applied Water Science 8(4): 104.
- Yuh-Shan H (2004) Citation review of Lagergren kinetic rate equation on adsorption reactions. Scientometrics 59(1): 171-177.
© 2018 Sayed M Saleh . This is an open access article distributed under the terms of the Creative Commons Attribution License , which permits unrestricted use, distribution, and build upon your work non-commercially.
 a Creative Commons Attribution 4.0 International License. Based on a work at www.crimsonpublishers.com.
Best viewed in


.jpg)


 Editorial Board Registrations
 Submit your Article
 Refer a Friend
 Advertise With Us
.jpg)


.jpg)


.bmp)
.jpg)
.png)
.jpg)


.jpg)


.png)

.png)


.png)


