- Submissions

Full Text
Research & Development in Material Science
Study on the Influence of the Springback on the Hole Expansion Ratio Characterization
B Zubia*, J Agirre, E Saenz de Argandoña, L Galdos and J Mendiguren
Department of Mechanical and Industrial Production, Mondragon University, Spain
*Corresponding author: B Zubia, Department of Mechanical and Industrial Production, Mondragon University, Loramendi 4, Mondragon 20500, Gipuzkoa, Spain
Submission: February 09, 2018;Published: April 17, 2018

ISSN: 2576-8840
Volume5 Issue3
Abstract
Material formability has become one of the main problems, together with the springback, when stamping high added-value components for the automotive industry. The pursuit of weight reduction has led to higher strength alloys which show a lower formability. Among the different formability criteria (e.g. necking, edge strain, fracture and radius cracks) the edge strain is starting to be a critical aspect on the process planning stage. In order to characterise this criteria, the hole expansion ratio (HER) is conducted under the ISO 16630 standard. In the last years, multiple authors have analysed the HER of different alloys and its dependency on different process variables i.e. cutting method, test speed, material strength. However, the influence of the springback phenomenon on the test result has not been previously analysed. In this work, the influence of the springback on the HER values has been analysed for a mild steel DX54D and a third generation steel Fortiform1050 with a novel measuring technique. From the obtained results, it can be stated that the springback has a critical influence on the characterised HER value, mainly for the third generation steel, leading to differences of about 40% on the HER limits.
Keywords: Formability; Hole expansion test; Hole expansion ratio; Fortiform 1050; Spring back
Introduction
In the automotive industry, the steel is the primary material used, being approximately 60% of the weight of the vehicle [1,2]. To reduce the fuel consumption, the reduction in weight of the car body structure is intensively required in industry and with this aim, higher strength materials are being introduced [3-5]. However, it has been shown that these materials lead to higher springback and early fracture problems [6,7].
In order to reduce these disadvantages, mainly the one related with formability, steel makers are developing new alloys [8]. Firstly, after initial Martensitic steels MSS, TWIP steels were developed. These alloys present a similar strength compared to high or advanced high strength steels (ultimate strength >500MPa), but with greater formability of about 40%. These new alloys were of high interest for the stamping industry [9,10]. However, in order to reduce the high cost and improve the low weldability of these TWIP materials, recently, third generation steels were presented [11], where lower formability is obtained but at a lower cost.
Modern methods of manufacture of car body components such as wheels, suspension parts and structural components using sheet metal, mainly steel, involve, primarily, shearing, bending and stretch drawing operations. Included with these processes are the bending up (plunging) of flanges around punched holes, and this can result in rupture of the material. Various test methods are available to establish the suitability of the sheet metal and the hole expanding test is one of the most common methods for evaluating the edge strain limit of a specific material [12]. The hole expansion test is a deep drawing operation of a flat circular sheet with a hole in the centre. In order to perform the test, a conical punch is used and during the drawing operation the inner hole of a blank expands and the edge strain increases until the first crack appears. In this test, the limiting hole expansion ratio (HER) is obtained, which quantifies the amount of hole expansion obtained in a circular punched hole of a test piece when an expanding tool is forced into the hole. This information is critical in all deep drawing operations where a precut hole is expanded as well as on secondary operations where an edge is stretched.
Previous authors have analysed the HER of different automotive alloys. Larour et al. [13] and Yoon et al. [14] analysed the widely used Dual Phase steels (DP), Krempaszky et al. [15] and Dünckelmeyer et al. [16] analysed the fatigue resistant Complex Phase steels (CP), Pauli et al. [13], Krawczyk et al. [17] and Choi et al. [18] analysed the high formability Transformation-Induced Plasticity steels (TRIP), other authors such as Xu et al. [19] analysed the second generation steels Twinning-Induced Plasticity (TWIP) [20-22], up to the really high strength Martensitic steels (MS) analysed by Chen et al. [23]. In addition, lower strength automotive steels such as stainless steels and Extra Deep Drawing (EDD) steels were also investigated by Li et al. [24] and Stachoswicz [25]. Regarding the mechanical properties, Narayanasamy et al. [26] reported that with higher ultimate tensile strengths lower HERs are obtained. Similarly, Yoon et al. [21] stated that increasing the fracture toughness, crack initiation at the hole edge surface can be delayed, which delays the crack propagation along the thickness direction and leads to increased HERs [17]. Analysing the influence of the chemical composition and the microstructure, in 2009, Narayanasamy et al. [26] showed that smaller amount of boron and manganese aids to have better HER and less amount of carbides enhance the HER. In 2014, Paul et al. [27] showed that higher strength differences among phases resulted in inferior HER.
Aimed at studying the robustness of the hole expansion test, the most affecting parameters of the test have been also investigated by various authors. It has been proved that the initial hole diameter does not significantly influence the hole expansion results [18,25,28]. In addition, increasing the thickness of the specimen HER increases [29]. It has been shown that the failure direction depends on the rolling direction and anisotropy of the material [15]. For specimens with laser cutting, the first primary crack initiated at the start position of the laser cutting process [30]. The manufacturing process and the surface quality of the initial hole have been determined as the two critical parameters that affect HER. Punched holes present damaged surfaces and the lowest HER [15]. Smoothing of the sheared edge is effective in improving HER [3]. Although the load of the forming punch does not affect the HER, its geometry is important [24,31]. The highest HERs are obtained with a conical punch whereas the smallest ones with a cylindrical punch [21,25,29]. It has been also shown that HER increases significantly with increasing speed [13].
Aimed at predicting the HER without having to perform dedicated experimental tests, some authors worked the prediction using the simulations and equations based on mechanical properties [4,20,22,32]. In 1986, Adamczyk & Michal [33] presented an equation to predict HER from the total elongation and the plastic strain ratio. In 2006, Comstock [28] improved the predictive capability of the relationship of Adamczyk & Michal [33] by including the thickness and the work-hardening ratio to the equation [28]. Other authors such as Sadagopan et al. [34], Chen et al. [35] and Chung et al. [36] have presented expressions to predict HER from the mechanical properties. In some works, comparing the experimental HER values with predicted ones, the predictions are observed to correctly match the experimental values [15,20,27].
Although the influence of many parameters could be analysed in the experimental results, there is an International Standard ISO 16630 [12] that establishes the procedure and parameters to perform the hole expansion test. It specifies to stop the movement of the punch the instance a crack appears through the full thickness of the test piece and measure the inside diameter of the ruptured hole in the test piece with slide calipers, or another suitable instrument (e.g. calibrated profile projector), to the nearest 0.05mm. As the ISO 16630 does not determine how to identify the first throughthickness crack, several methods have been used in the last years.
In 2008 and 2009, Uthaisangsuk et al. [4] and Dünckelmeyer et al. [16] used the maximum load recorded in the load-displacement curve to identify the first crack. However, in 2014 and 2015, Kremspaszky et al. [15] and Hu et al. [37] stated that the firstobserved through-thickness crack does not correspond with the maximum load and that the characteristics of the force-displacement curve near the maximum punch force strongly depends on the edge condition, the hole expansion geometry and the material behaviour (strain hardening, damage evolution and fracture toughness). In order to avoid the errors introduced by this force technique, some authors used artificial vision methods to identify the first crack, recording the test with cameras [13,18,37] or 3D DIC techniques [16,29]. This 3D DIC improves the test results in two aspects. Firstly, as it is an amplified image, it is much easier to determine when the first through thickness crack occurs. Secondly, 3D DIC is capable to obtain the deformation on the surface of the specimen despite the deformation happens in a 3D space due to the large rotation and out-of-plane displacement. This gives the capability of checking images frame by frame to specify the exact time when first through thickness crack happens and calculating HER at that time.
Under the knowledge of the authors, no study has been performed to analyse the influence the post cracking springback has on the HER measurement. Due to the springback, the diameter of the hole at the crack moment is reduced when the punch is moved out and therefore an error is introduced when the diameter is measured after the test. It is important to take into consideration this error due to the springback. In the hole expansion test, elastic recovery is caused mainly by two parameters: the own springback of the material and the effect the crack has on it. This complexity, leads to have difficulties in performing the inverse simulation by means of simulation code. Furthermore, it is known that the prediction of the HER depends on the accuracy of the FEM model. Therefore, in this work the effect of the springback is directly analysed experimentally.
The main objective of the present work has been to analyse the influence of the springback on the HER determination. Although several authors [16,29] have moved to using image analysis several years ago to stop the tests and calculate HER, that method involves using 2 cameras, a DIC system and a mirror. However, the new online method presented in this work, enables to obtain the same results in a simple way using a straightforward method that needs a simple. Two different materials have been analysed, the mild steel DX54D which has low tensile strength as well as low springback and a Third Generation steel Fortiform1050 in which the springback is high due to its high strength. Then the influence of these differences at different tests velocities on the obtained HER values has been analysed. The diameter of the hole has been measured using online techniques and compared to the post-test measured value.
Materials and Equipment
In this work, two steels were analysed: a Fortiform 1050 and DX54D. On the one hand, the Fortiform 1050 is a Third Generation Ultra High Strength Steel and it is used to provide additional weight reduction thanks to its higher mechanical properties compared to that of conventional Advanced High Strength Steels (AHSS) while keeping the same formability (similar formability to a DP780). This steel allows the realization of lightweight structural elements by a cold forming method such as stamping. On the other hand, the DX54D is a high formability steel used for deep drawing operations usually for body panels. The Fortiform 1050 has a low deformation and a high springback while the DX54D has high deformation and low springback. Table 1 lists each material’s thickness and mechanical properties.
Table 1: Thickness and main mechanical properties of the analysed materials.

In order to assure the repeatability of the hole expansion test, ten circular specimens of each material were laser cut. The outer diameters were 95mm and the inner holes were 10mm.
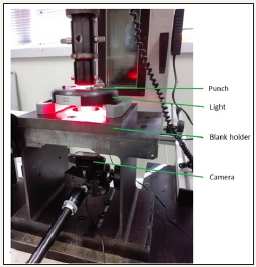
EquipmentIn order to perform the hole expansion test, an Instron4206- 100kN universal testing machine was used. The necessary tooling for the test (Figure 1) was installed in the universal testing machine. The main components of the tooling are the main frame, the blank holder and the conical punch with an angle of 60°. The punch has a machined cylinder (10mm) at the end to achieve online measurements of the final diameter. The machined cylinder was of vital importance because it was used as a reference diameter in the calibration for the online measurements. After a calibration process, measuring the reference diameter and the final diameter of the hole in pixels enabled to obtain the online diameter in millimetres. Aimed at identifying the occurrence of cracks accurately and recording the test in order to obtain online images, a Logitech Carl Zeiss Tessar HD 1080p camera was used.
Figure 1: Hole expansion test equipment.
Methodology
Hole expansion test: The edge strain was evaluated from the hole expansion test as specified in the ISO 16630 [12]. The laser cut holes of the sheet were expanded with the conical punch having an angle of 60°. In order to be able to analyse the influence of the strain rate on the crack behaviour, two different velocities were tested: 0.1mm/s and 1mm/s. For each material and velocity five blanks were tested.
According to ISO 16630, the test must be stopped when a first crack through the full thickness appears. It was observed that the maximum load criteria is not a suitable method to detect the crack instant [16,37]. For that reason, in this work the on-line camera has been used to identify the crack point.
Once the test is stopped and the final diameters measured, the hole expansion ratio λ, is computed using the following equation:
λ = (Dh−Do)×100/Do (1)
Where Do is the original hole diameter and Dh is the average hole diameter after rupture [12].
λ = (Dh−Do)×100/Do (1)
Usually, once the crack is identified and the test stopped, the sample is taken out and the inner hole diameter is measured. However, when removing the punch, the springback of the sample occurs modifying the limit diameter of the test.
In order to be able to evaluate this phenomenon, two different methods were used in each test: the conventional offline method and the online method where the diameter is measured during the test.
Offline measurements
After each hole expansion test, the final diameter has been measured using an inside micrometre. Two measurements in perpendicular directions were made in each specimen and the data measured in each specimen was averaged. Finally, the average diameter of all blanks of each test was calculated and the HER was computed.
Online measurement
Regarding the online measurements, the images of the camera that was used to detect the first crack enabled us to measure the final diameters without springback. As we used a 2D camera, what we could see in the screen was a circumference (Figure 2a). Once the test is finished, frames near the failure instant are analysed one by one and the frame in which the crack is through the full thickness is identified. In that frame, the hole diameter and the punch diameter are measured in pixels. Finally, those pixels are converted to millimetres using the calibration curves.
Figure 2: 2a: 2D image
2b: Conical punch with a cylinder in its tip
2c: Punch for the calibration
2d: Figure for the calibration.
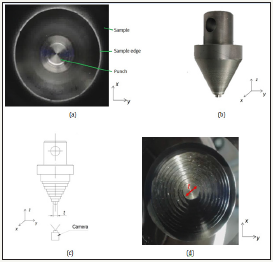
There are two main problems when using a 2D camera. On the one hand, it is necessary to calibrate the image in order to be able to convert it from pixels to millimetres. In that regard, the used conical punch has a 10mm diameter grow on the tip (Figure 2b). This diameter was the reference for converting pixels to mm.
On the other hand, even with the calibrated image, it is not possible to directly determine the diameter of the sheet at the moment of the crack as that is happening in a different z plane compared to the 10mm diameter tip (supposing x and y the axes of the image).
The procedure that has been followed in this work to be able to identify the diameter of the sheet goes through a second calibration of the conical punch. As it can be shown in Figure 2c & Figure 2d, a conical punch (same angle as the test punch) has been machined with different diameters at different depths (z planes). Then, the stroke of that calibration punch (without sheet sample) has been recorded with the camera. Next, from each image captured during that stroke, the diameter in pixels of the 10mm diameter of the tip (t) as well as of every diameter of the calibration punch has been measured.
All these measurements allow the construction of a calibration graph (Figure 3) where the relation between the tip diameter in pixels (t) and the diameter of each cylinder (p) (terrace of the calibration punch) both in pixels and in mm (Dh) is drawn.
Figure 3: Calibration curves.
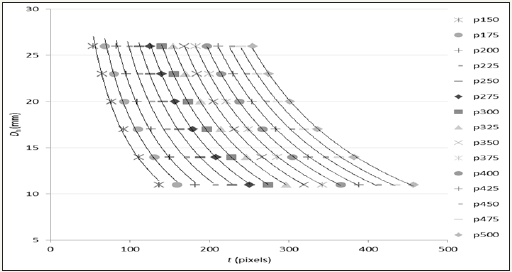
Figure 4: Online measuring methodology.
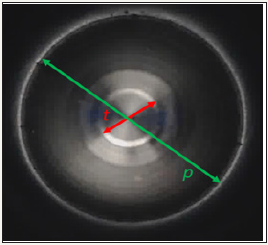
This abacus type graph allows the identification of the online diameter of the sheet. When the crack occurs, first, the diameter of the tip is measured in pixels (t). Next, the diameter of the sheet hole is also measured (p) in pixels (Figure 4).
Then, using the previously calibrated abacus type graph the correct diameter of the hole Dh can be identified. In order to facilitate the use of the abacus, in this work, an analytical expression has been fitted to the data
Dh=ktn=f(p)tg(p) (2)
Where Dh is the average hole diameter after rupture in millimeters, t is the value of the reference diameter measured in pixels and k and n are parameters depending on p which is the value of the final diameter measured in pixels.
Results and Discussion
Figure 5: Diameter of the final holes.

Figure 6: Hole expansion ratio.
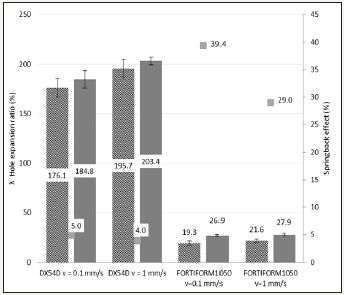
After conducting the hole expansion tests for different materials and velocities, the critical crack diameter (Figure 5) and the HER (Figure 6) were evaluated both online and offline. The following figures show the average value (with the standard deviation on the error bar) of both measuring methodologies as well as the % of difference between them.
It can be seen that in the case of the DX54D diameters between 27mm and 30mm can be found and that the measurement error introduced due to springback is of about 3%. This difference increases up to a 5-6% in the case of the Fortiform 1050 material. This is due to the high stress state achieved in this material which leads to high post forming springback. The high stress state in the Fortiform 1050 also results in smaller final diameter. Figure 6 shows the results in terms of HER.
From Figure 6 it can be appreciated that when converting the limit diameters to HER values (equation 1), differences up to 39% can be found on the Fortiform 1050 due to its low edge stretchability. In addition, one of the main characteristics of the hole expansion test, is the high variability between samples [15,27]. It can be noted from the above shown results, that variability is reduced when using the online method compared to the conventional offline method and more importantly at high test velocities.
Regarding the testing speed, higher punch speed substantially increases the HER values for both materials. In the case of DX54D the absolute HER value increases up to 10% from 0.1mm/s to 1mm/s. Larour et al. [13] also claimed in their work that increasing the testing speed, resulted in greater HER. They stated that the slower the test, lower the HER-value because the operator has more time to recognize the crack through the edge visually. The faster the hole expansion test, the more reaction time of operator as well as from the testing machine play a dominant role. However, as we are capturing 10 images per second (10Hz), when the velocities of the punch are 0.1mm/s and 1mm/s, we have resolutions of 1.15x10- 2mm and 1.15x10⁻¹mm in the diameter respectively. As far as Fortiform 1050 blanks are concerned, being the difference between diameters 0.1mm could lead to think that this difference is due to the resolution. Nevertheless, in DX54D the difference between diameters (1.8mm) is bigger than the resolution, so achieving greater diameters with greater velocities is not a matter of the measurement method. One of the influencing factors it could be the strain rate sensitivity of the hardening behaviour. As the edge of the hole has higher strain rate compared to the surrounding material, due to the hardening difference, this can pull the “soft” material of the area increasing the HER. However, this hypostasis should be further analysed using a larger range of materials to be able verify its impact (Figure 7a & 7b).
Figure 7: Tested blanks
7a: Fortiform 1050 and
7b: DX54D.

Xu et al. [19] stated that in the laser cut blanks the crack always started at the start point of the cutting process. However, in this study only in 7 out of 20 samples the crack appeared in the laser starting point.
Conclusion
The conclusions summarized from the test results are as follows:
1. The springback phenomenon has been found to be relevant on the hole expansion ratio characterization.
2. Springback is mandatory to accurately measure HER, otherwise it will introduce 40% error in the case of the third generation Fortiform 1050 where springback is high.
3. The proposed new method has been proved to be suitable for taking into account the springback phenomenon with a simple set-up.
4. Contrary to previous authors, the observed influence of the test speed on the mild steel HER is not related with the crack identification methodology. This effect remains as an open question for further investigation.
References
- Hilditch TB, de Souza T, Hodgson PD (2015) Properties and automotive applications of advanced high-strength steels (AHSS). Welding and Joining of Advanced High Strength Steels (AHSS), pp. 9-28.
- Pla-Ferrando R, Sánchez-Caballero S, Reig MJ, Pla R, Sellés MA, et al. (2012) Advanced high strength steel (AHSS) TWIP: A door to the future in metal forming, in The 4th Manufacturing Engineering Society International Conference, pp. 65-73.
- Mori K, Abe Y, Suzui Y (2010) Improvement of stretch flangeability of ultra high strength steel sheet by smoothing of sheared edge. J Mater Process Technol 210(4): 653-659.
- Uthaisangsuk V, Prahl U, Bleck W (2009) Stretch-flangeability characterisation of multiphase steel using a microstructure based failure modeling. Comput Mater Sci 45(3): 617-623.
- Silvestre E, Mendiguren J, Galdos L, De Argandoña ES (2015) Comparison of the hardening behaviour of different steel families : From mild and stainless steel to advanced high strength steels. Int J Mech Sci 101(102): 10-20.
- Matsuoka S, Hasegawa K, Tanaka Y (2007) Newly-developed ultra-high tensile strength steels with excellent formability and weldability. JFE Tech Rep 10: 13-18.
- Gil I, Mendiguren J, Galdos, Mugarra E, Argandoña SDE (2106) Influence of the pressure dependent coefficient of friction on deep drawing springback predictions. Tribol Int 103: 266-273.
- Grajcar A, Kuziak R, Zalecki W (2012) Third generation of AHSS with increased fraction of retained austenite for the automotive industry. Arch Civ Mech Eng 12(3): 334-341.
- De Cooman BC, Chin KG, Kim J (2011) High Mn TWIP steels for automotive applications. In New Trends and Developments in Automotive System Engineering, pp. 101-128.
- Matlock DK, Speer JG, De Moor E, Gibbs PJ (2012) Recent developments in advanced high strength sheet steels for automotive applications: an overview. JESTECH 15(1): 1-12.
- Tamarelli CM (2000) The evolving use of advanced high-strength steels for automotive applications.
- ISO 16630 (2009) Metallic materials-Sheet and strip-Hole expanding test.
- Larour P, Pauli H, Freudenthaler J, Lackner J, Leomann F, et al. (2016) Experimental artefacts on ISO 16630 hole expansion ratio in IDDRG 2016 International Conference, pp. 480-498.
- Hashimoto K, Kuwabara T, Iizuka E, Yoon J (2010) Hole expansion simulation of high strength steel sheet. Int J Mater Form 3(1): 259-262.
- Krempaszky C, Larour P, Freudenthaler J, Werner E (2014) Towards more efficient hole expansion testing. IDDRG 2014 Conference, pp. 204- 209.
- Dünckelmeyer AKM, Krempaszky C, Werner E (2009) Instrumented hole expansion test. Proceeding of International Doctoral Seminar 2009: 411-419.
- Krawczyk J, Gronostajski Z, Polak S, Jaśkiewicz K, Chorzępa W, et al. (2016) The influence of the punch shape and the cutting method on the limit strain in the hole expansion test. Key Eng Mater 716: 129-137.
- Choi SH, Kim EY, Kim SI (2014) The micromechanical deformation behaviors of hot-rolled 590FB steel during hole-expansion test. Int J Plast 58: 184-200.
- https://www.witpress.com/elibrary/wit-transactions-on-the-built-environment/124/23457
- Wang K, Luo M, Wierzbicki T (2014) Experiments and modeling of edge fracture for an AHSS sheet. Int J Fract 187(2): 245-268.
- Yoon JI, Jung J, Hyun SJ, Song TJ, Geun KC, et al. (2016) Correlation between fracture toughness and stretch-flangeability of advanced high strength steels. Mater Lett 180: 322-326.
- Paul SK, Mukherjee M, Kundu S, Chandra S (2014) Prediction of hole expansion ratio for automotive grade steels. Comput Mater Sci 89: 189- 197.
- Chen X, Jiang H, Cui Z, Lian C, Lu C (2014) Hole expansion characteristics of ultra high strength steels. Procedia Engineering 81: 718-723.
- Li M, VanTyne CJ, Moon YH (2015) The effect of mechanical properties on hole flangeability of stainless steel sheets. J Mech Sci Technol 29(12): 5233-5239.
- Stachowicz F (2008) Estimation of hole-flange ability for deep drawing steel sheets. Arch Civ Mech Eng 8(2): 167-172.
- Narayanasamy R, Narayanan CS, Padmanabhan P, Venugopalan T (2010) Effect of mechanical and fractographic properties on hole expandability of various automobile steels during hole expansion test. Int J Adv Manuf Technol 47(1-4): 365-380.
- Paul SK (2014) Non-linear correlation between uniaxial tensile properties and shear-edge hole expansion ratio. J Mater Eng Perform 23(10): 3610-3619.
- Comstock RJ, Scherrer DK, Adamczyk RD (2006) Hole expansion in a variety of sheet steels. J Mater Eng Perform 15(6): pp. 675-683.
- Li J, Wang H, Yan DW (2016) Influence of experiment methods on limit hole expansion ratio. Advanced Manufacture Technology and Industrial Application.
- Xu L, Barlat F, Lee MG (2012) Hole expansion of twinning-induced plasticity steel. Scr Mater 66(12): 1012-1017.
- Le QB, Devries JA, Golovashchenko SF, Bonnen JJF (2014) Analysis of sheared edge formability of aluminum. J Mater Process Technol 214(4): 876-891.
- Kuwabara T, Mori T, Asano M, Hakoyama T, Barlat F (2016) Material modeling of 6016-O and 6016-T4 aluminum alloy sheets and application to hole expansion forming simulation. Int J Plast 93: 164-186.
- Adamczyk RD, Michal GM (1986) Shearen edge extension of highstrength cold-rolled steels. J Appl Met 4(2): 157-163.
- Sadagopan S, Wong C, Huang M, Yan B, Urban D (2003) Formability characterization of a new generation of high strength steels.
- Chen L, Kim J, Kim S, Chin G, De Cooman BC (2010) On the stretchflangeability of high mn twip steels. Mater Sci Forum 654: 278-281.
- Chung K, Ma N, Park T, Kim D, Yoo D, et al. (2011) A modified damage model for advanced high strength steel sheets. Int J Plast 27: 1485-1511.
- Hu XH, Sun X, Golovashchenko SF (2016) An integrated finite elementbased simulation framework: From hole piercing to hole expansion. Finite Elem Anal Des 109: 1-13.
© 2018 B Zubia. This is an open access article distributed under the terms of the Creative Commons Attribution License , which permits unrestricted use, distribution, and build upon your work non-commercially.
 a Creative Commons Attribution 4.0 International License. Based on a work at www.crimsonpublishers.com.
Best viewed in


.jpg)


 Editorial Board Registrations
 Submit your Article
 Refer a Friend
 Advertise With Us
.jpg)


.jpg)


.bmp)
.jpg)
.png)
.jpg)


.jpg)


.png)

.png)


.png)


