- Submissions

Full Text
Research & Development in Material Science
Plastic Waste and Carbon Footprint Generation Due to the Consumption of Bottled Waters in Saudi Arabia
Mohammad S Islam1*, Md Jobaer Uddin2 and Khaled Alshehri3
1Assistant Professor, University of Tabuk, Saudi Arabia
2Teaching Assistant, University of Asia Pacific, Bangladesh
3Research Assistant, University of Tabuk, Saudi Arabia
*Corresponding author: Mohammad S Islam, Assistant Professor, University of Tabuk, Tabuk, Saudi Arabia
Submission: March 24, 2018;Published: March 28, 2018

ISSN: 2576-8840
Volume5 Issue1
Abstract
Polyethylene Terephthalate (PET), a polyester based thermoplastic polymer, is used worldwide for packaging foods and beverages. The sharp rise of PET application has increased potential hazards on human health and environment. The main objective of the study was to determine the amount of plastic waste that was generated from bottled drinking water consumption in Kingdom of Saudi Arabia, and its impact on the carbon footprint (CO2 generation). An online random survey was conducted to estimate the daily consumption of bottled water in the province of KSA, Tabuk. The total generated plastic (PET) waste from drinking water bottles in Saudi Arabia was estimated at 8,27,114 tonnes each year, which produced 26,79,851 tonnes of CO2 per year. When considering the consumption of plastic in the food industries, the impact becomes more severe, and it exponentially increases for the developing countries as compared to the developed countries. These phenomena demand a compressive solution that ranges from governmental policies to engineering solution to lessen the use of plastic in minimizing global carbon emissions.
Keywords: Plastic waste generation; Carbon footprint; Drinking bottled water; Global warming; Survey
Introduction
The global population is consuming the ever-rising amount of plastic; this consumption is rising because of consuming more and more plastic packaged product. Plastic solid waste has become a serious problem when considering the disposal alternatives following the sequential hierarchy of sound solid waste management. The main dilemma is a high plastic generation without effective measures to treat this problem. For example, A survey was conducted in 60 cities of India, and estimated plastic waste to be over 15,342 tonnes per day while more than 6,000 tonnes remain uncollected and littered [1]. In another study, it was found out the average household plastic waste generation in Vietnam is 102.7kg each year [2]. This uncontrolled plastic waste might cause a severe environmental issue. In addition, the plastic water bottle is composed of a non-biodegradable material, and dumped waste may remain in nature for centuries. As presented, dealing with the dilemma is of great importance. Researchers around the globe looking for measures to cope up with this problem. However, due to lack of local waste generation data, this often becomes unviable to go for a strategical solution. In this study, the authors estimated the generation of plastic waste from drinking water bottle (i.e. PET bottle) in Kingdom of Saudi Arabia (KSA) by performing an online survey to estimate Carbon Footprint (CF) of PET bottle.
Materials and Methods
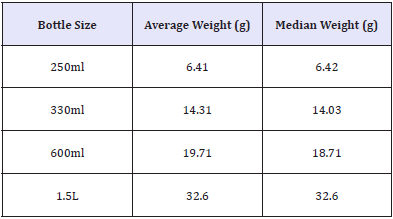
This study estimated the plastic water bottle waste generation, specifically PET bottle waste in the capital city of the north-western province of Kingdom of Saudi Arabia (KSA), Tabuk. To estimate the daily consumption of water bottle in Tabuk, an online random survey was carried out to gather data. Due to the availability of short time, a deductive approach was adopted to ascertain the survey result. In Tabuk, PET water bottled is produced by 7 companies, and mostly 4 sizes of water bottle are produced by them, such as 250mL, 330mL, 600mL and 1.5L. Initially, median weight of aforementioned bottles as shown in Table 1, was multiplied by the weighted average of survey responses to generate daily plastic water bottle consumption in Tabuk. It is noted that weight of bottles wasn’t constraint for a distinctive size of the bottle, and therefore the average dry weight of bottles was adopted in this study. Later, these average daily waste generation data were adopted to generate annual plastic waste generation in Kingdom of Saudi Arabia (KSA). The analysis was performed based on descriptive statistics. In addition, amount of recycled and un-recycled amount of plastic waste estimated. Finally, the carbon footprint of the plastic water bottle is assessed [3].
Table 1: Average and median weight of plastic Bottles.
Results and Discussion
Daily plastic bottle waste generation
Figure 1: Percentage of plastic bottle consumption.
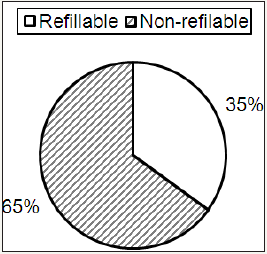
Figure 2: Percentile of plastic bottles consumption varying size;
2a: 250mL
2b: 330mL
2c: 600mL
2d: 1.5L.
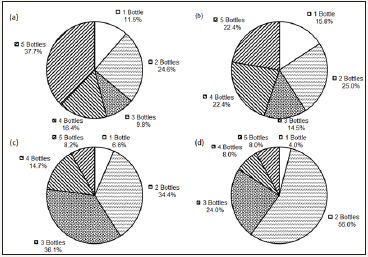
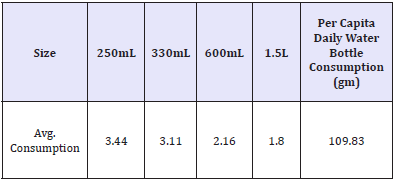
It was obtained from demographic data that among in total of 79 responses, only 35% of respondents used refillable water containers and rest of them, 65% consumed throwaway plastic bottles to drink water (Figure 1). In addition, it was revealed from the survey that the number of consumed water bottle for a unique size was decreasing with increase in the size of water bottle (Figure 2). Eventually, this was resulting in a higher weighted factor for smaller sized water bottles than larger sized bottles (Table 2).
Table 2: Per capita daily water bottle consumption.
Annual plastic waste generation
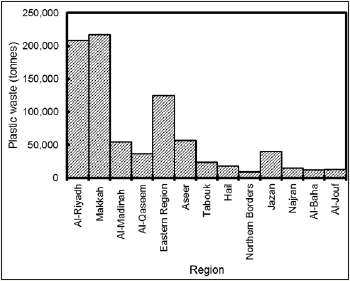
The region-wise annual plastic waste generation of KSA from non-refillable water bottles consumption was estimated by using demographic survey data of KSA, 2016 and is shown in Figure 3. To estimate annual plastic water bottle generation, it was assumed that the daily water bottle consumption was constraint throughout KSA. Over 8 hundred thousand tonnes of waste was produced in KSA merely from water bottles. A region-wise amount of recycled and unrecycled amount of waste is demonstrated in Figure 4.
Figure 3: Regionwise annually plastic bottle production in KSA.
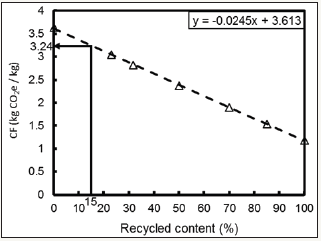
Khan & Kaneesamkandi [4] reported that only 10-15% waste in KSA was recycled and rest of it went for landfilling. Taking account this finding, it was estimated that below 3 hundred thousand tonnes of plastic bottle waste recycled annually in KSA while remaining went for landfilling. Dormer et al. [5] has proposed a model to correlate effect of unrecycled PET waste content on carbon footprint, see Figure 5. As shown in Figure 5, it is appraised that per kg of plastic bottle is producing approxiamtely 3.24 (kg CO2e) in KSA, which annually produced 26,79,851 tonnes of CO2.
Figure 4: Regionwise recycled and unrecycled plastic waste production per year.

Figure 5: Relationship between carbon footprint and recycled content [5].
Conclusion
The survey has been able to provide an idea of the prevailing plastic waste generation from water bottle alone in KSA and estimate the amount of carbon footprint from this source. KSA, alone produced more than 8 hundred thousand tonnes of waste from water bottle. Among which less than 3 hundred thousand tonnes only go for recycling and remaining go for dumping. Additionally, water bottles alone in KSA produced approximately 26 hundred thousand tonnes of CO2 annually
References
- CPCB (2015) Annual Report 2014-2015.
- Thanh NP, Matsui Y, Fujiwara T (2011) Assessment of plastic waste generation and its potential recycling of household solid waste in Can Tho City, Vietnam. Environmental Monitoring and Assessment 175(1- 4): 23-35.
- General Authority of Statistics (2016) Demographic Survey.
- Khan MSM, Kaneesamkandi Z (2013) Biodegradable waste to biogas: renewable energy option for the Kingdom of Saudi Arabia. Int J Innov Appl Stud 4(1): 101-113.
- Dormer A, Finn DP, Ward P, Cullen J (2013) Carbon footprint analysis in plastics manufacturing. Journal of cleaner production 51: 133-141.
© 2018 Mohammad S Islam. This is an open access article distributed under the terms of the Creative Commons Attribution License , which permits unrestricted use, distribution, and build upon your work non-commercially.
 a Creative Commons Attribution 4.0 International License. Based on a work at www.crimsonpublishers.com.
Best viewed in


.jpg)


 Editorial Board Registrations
 Submit your Article
 Refer a Friend
 Advertise With Us
.jpg)


.jpg)


.bmp)
.jpg)
.png)
.jpg)


.jpg)


.png)

.png)


.png)


