- Submissions
Full Text
Research & Development in Material Science
Image analysis and Laser Particle Diffraction study of ProRoot-MTA, Portland cement and Bismuth Oxide-A comparative study
MMA Rafique*
Department of Dentistry, Aarhus University, Denmark
*Corresponding author: MMA Rafique, Department of Dentistry, HEALTH, Aarhus University, Vennelyst Boulevard 9, DK, 8000 Aarhus C, Denmark
Submission: January 24, 2018; Published: February 16, 2018

ISSN: 2576-8840Volume3 Issue4
Abstract
Objectives: To describe the particle size of ProRoot MTA, Portland cement and bismuth oxide samples by using laser particle diffraction and scanning electron microscopic image analysis on the same samples in comparison and generate understanding of most commonly expected size ranges. Motivation of the study is to ascertain a size range of selected powders most suitable for root canal treatment. This is the first study of its kind in Scandinavia comparing local available powders for use in important and critical medical application.
Methods: Samples of white ProRoot MTA, Aalborg White Portland Cement and Bismuth oxide were examined twice using a laser diffraction technique and scanning electron microscopy, respectively, followed by SEM image analysis. A HELOS laser diffraction particle size analyzer was used. Each powder sample was dissolved in isopropanol briefly with ultrasound to make wet dispersions. Distribution of particle size was measured on volume basis. All particles with a diameter less than 1^m were excluded from size analysis, as the HELOS laser diffraction technique did not measure particles below this size. For image analysis, the specimens were prepared on glass mounted on metal stubs and sputter coating with carbon in some cases and studied in a CamScan scanning electron microscope. ProRoot MTA was further examined by backscatter SEM and x-ray analysis. Representative images from each powder sample were analyzed using a digital image analysis program. The particle diameter size was calculated after measurement on minimum and maximum particle diameter with a digital ruler.
Results: Statistical analysis shows that Portland cement contains larger amounts of large particles than ProRoot-MTA and Bismuth oxide. Similarly, the ProRoot-MTA contains a larger amount of smaller particles than Portland cement or Bismuth oxide. This difference is by 22%, 10% and 6% in Portland cement, Bismuth oxide and ProRoot-MTA respectively (laser diffraction method). Similar trend is observed in Image analysis. According to the laser diffraction method, 48% of the ProRoot-MTA, 25% of Portland and 19% of Bismuth oxide particles were under 5 μm. Both methods produced data concerning particle size relatively quickly.
Conclusion: The distribution of larger particle size is higher in Portland cement as compared to ProRoot MTA and Bismuth oxide. The distribution of smaller particle size is higher in ProRoot MTA in comparison to both Portland cement and Bismuth Oxide. This gives an idea as to what particle size is expected in different batch of materials, how they can be sorted out to know their exact size and how this can serve as measure of suitability for further cavity filling application (root canal treatment).
Introduction
Mineral trioxide aggregate (MTA) has a great potential in modern dentistry. Several investigations have shown its properties to be beneficial in a wide range of clinical uses. MTA materials are used clinically as a wound dressing material in pulp repair and as sealing material in root ends, canals, fractures, and furcation perforations. Several authors and studies have concluded that MTA has potential in these procedures, although further investigations are needed [1-3]. The MTA powder contains fine hydrophilic particles that set in the presence of moisture. Portland cement: the major constituent of MTA powder is responsible for the setting reaction after mixing with water, while bismuth oxide is added only for its radiopaque properties [2]. This is the only element found in excess in comparative analysis of MTA and Portland cement [1]. The properties of MTA compositions have been studied and compared with Portland cement. The physical, chemical, and biological properties of MTA depend critically on both the composition and structure of powder particles [4]. Various analytical techniques including (scanning electron microscopic methods) have been used to examine MTA structure and composition [5]. The major component, Portland cement, is finely particulated powder which is formed from clinkers [1]. There are four major components in Portland cement: tricalcium silicate [(CaO)3•SiO2; abbreviation C3S], dicalcium silicate [(CaO)2•SiO2; abbreviation C2S], tricalcium aluminate [(CaO)3•Al2O3; abbreviation C3A], and tetracalcium aluminoferrite [(CaO)4•Al2O3•Fe2O3; abbreviation C4AF] [1-3,6]. Today, various MTA products are available. Previously, differences in particle size have been reported [1-3] in all these constituents. It was observed that Portland cement is composed of particles with a wide particle size range, whereas ProRoot MTA showed a more uniform and smaller particle size [2,4] which is a contradiction. Similar trend is observed in another study where MTA exhibit smaller particle size than Portland cement but larger particle size than MTA-like material called calcium enriched mixture (CEM) cement [7,8]. The particles are mixed with water, and after hydration, MTA form a colloidal gel that solidifies to a hard structure in approximately 3-4h [1,4] which is a unique phenomenon observed. The setting process is described as hydration of tricalcium silicate (3CaO•SiO2), dicalcium silicate (2CaO•SiO2), and tricalcium aluminate (3CaO•Al2O3). The mechanical properties after making powder and mixing MTA paste have been studied regarding setting time, expansion, solubility, compressive and flexural strength, push out strength, bond strength, retentive strength, displacement, pH, radiopacity, microhardness and fracture resistance [5]. Changes in powder particle sizes may influence a wide range of mechanical properties. The finer the powder, larger the surface area, which requires more liquid for hydration, and it is experienced that the mechanical strength thereby normally decreases. It is not easy to control these factors [9].
The mechanical properties and outcome of the setting MTA mixture is influenced by several factors which include: powder composition, particle size distribution, surface area, powder to liquid ratio, method of mixing, air-entraining, humidity, type of storage media, pH of environment, length of time between mixing and evaluation, thickness of material, and temperature [5]. Testing of particle size analysis on dental cement materials, including more practical and easy methods seems relevant and plausible. Mechanical and biocompatibility characteristics of dental cements are attributed to the particle distribution, homogeneity, and morphology [4] to a very large extent which open an exciting area of research. The aim of this study was to explore this effect. It is systematically proposed to study the particle size of ProRoot MTA, Portland cement [10-12] and bismuth oxide using laser particle diffraction, scanning electron microscopy (SEM), and SEM image analysis. A correlation was aimed to be developed for achieving optimum results using all these techniques.
Materials and Methods
Samples of white ProRoot MTA, Aalborg White Portland Cement and Bismuth oxide (Bismuth Oxide powder, Sigma-Aldrich, Germany (prod. no. 223891)) were examined twice using a laser diffraction technique and scanning electron microscopy, respectively, followed by SEM image analysis.
For laser diffraction, A HELOS laser diffraction particle size analyzer (Sympatech GmbH 0.1μm-8750μm) was used. Each powder sample is dissolved in isopropanol to make wet dispersions. Parameters such as reference time, measurement time, time and power of ultrasonic vibration and mixture speed were recorded and saved. 1g sample was prepared with ultrasound (60 second intervals) to prevent particles from flocculation. The laser diffraction technique generates volume based particle size distributions.
For SEM image analysis, powder is carefully mixed in isopropanol and samples were dried on glass mounted on two metal stubs by using silver glue. Some samples were sputter-coated with carbon by standard evaporation technique. The specimens were studied in a CamScan scanning electron microscope (model MaXim 2040, EnVac, Cambridge, England). Further, backscatter electron detection measurements were performed on ProRoot MTA samples. Same samples were subjected to x-ray analysis as well. Representative images of each product were analyzed using a digital image analysis program (Axiovision LE, release 4.6.3). Digimarc, a plug-in for Adobe Photoshop CS2.was used initially as image analysis tool. This program can easily measure large amounts of data in relatively short time, after an initial calibration and preparation of the image to be analyzed. The image was a major problem in present case, since we had to try to threshold the image to make each pixel either black or white (8-bit binary conversion). This severely changes the size and shape of the particles containing different shades of grey and most of intricate details are lost. Thus, program could not distinguish single particles in a cluster, so each group of clustered particles is prepared manually with an eraser tool, to set up sharp boundaries that the program could measure on. (This could have been avoided by use of more sophisticated image analysis tools such ImageJ® but unfortunately could not be achieved due to resource and information limitation at the time of experimentation). Finally, it was concluded that this program was inappropriate for present case investigation. Thus, Axiovision LE was chosen for image analysis. In this program, it is necessary to estimate every single particle diameter manually, which is more time consuming but apparently also much more accurate, since individual particles in a cluster can be measured. This finely avoids loss of details incurred due to binary image conversion. After calibrating the scale, each particle diameter was obtained by estimation of the minimum and maximum diameter, with a digital ruler. In a way, it is similar to ASTM 562 method. However, the latter is specific to metallographic analysis. The data were collected in a data table. All particles with a diameter <1μm were excluded, as the laser diffraction technique did not measure particles below this size. The size distribution data from SEM image analysis was calculated in the following way. The raw data is a measure of the single particle's minimum and maximum diameter, and each particle area is estimated by using standard formula for area of sphere .
Results
The size distribution data from laser diffraction technique is based on particle volumes. The data was arranged in intervals of 2, 4, 5, 8, 10, 16, 20, 25, 32, 38, 45, 53, 63, 75, 90, 106, 125, 150, 180 and 212 μm and expressed as percentage cumulative distribution. The relative increase was thereafter calculated by subtracting lower values from the higher value.
The particle areas obtained from the SEM image analysis were subsequently divided into the same intervals as the laser diffraction data, and for each interval the individual and accumulated percentage values were calculated and presented as percentage cumulative distribution. The results are presented in the form of line (scatter) and bar graphs. The graphs represent the behaviour of material with the variation of particle size and give values of fractions which exist above or below certain size (d50 value) for a particular test. The average particle size (d50 (mass median diamter)) of three powders ProRoot MTA, Portland cement and Bismuth oxide is expressed as diameter at which 50% of sample's mass is comprised of smaller particles.
Similarly, scanning electron microscopy was carried out and micrographs were presented, identifying phases of required material and unwanted/impurity materials. The SEM images were also processed by image analysis tools and a corelation was developed with XRD graphs (indicating and confirming the presence of unwanted/foreign material(s)).
Figure 1a: Laser diffraction and Image Analysis patterns of ProRoot MTA, Portland cement and Bismuth oxide.
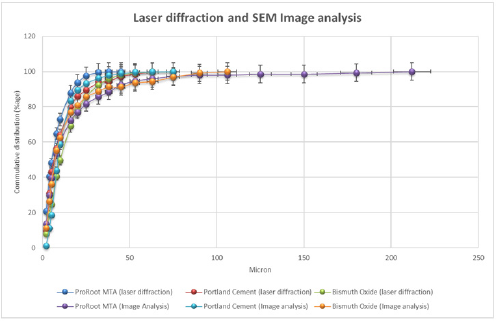
Table 1: Cumulative distribution of laser diffraction and image analysis for Proroot MTA, Portland cement and Bismuth oxide.
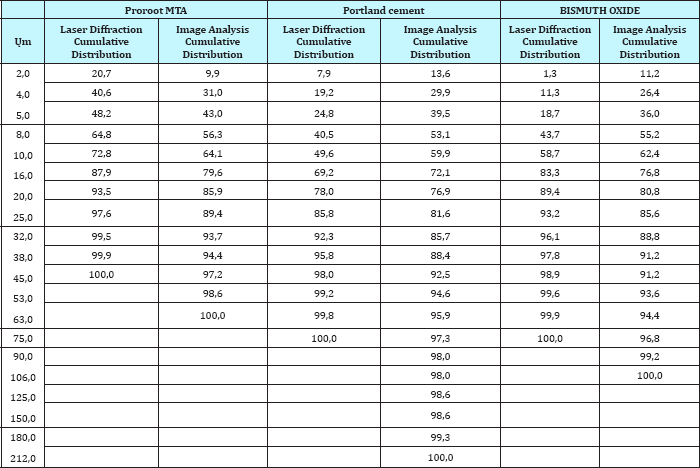
Table 2: Relative increase of laser diffraction and image analysis for Proroot MTA, Portland cement and Bismuth oxide.
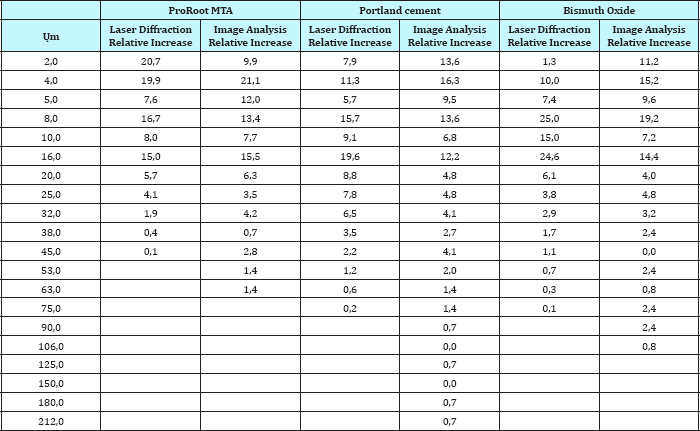
Figure 1b: Laser diffraction and Image Analysis bar graphs of ProRoot MTA, Portland cement and Bismuth oxide.
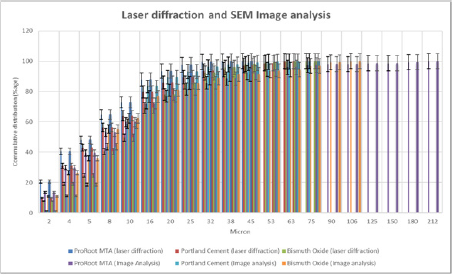
Portland cement contains larger amounts of large particles than ProRoot-MTA and Bismuth oxide. This is evident for the laser diffraction method (Figure 1a), as well as the image analysis method (Figure 1b). According to the laser diffraction method, 22% of the particles in Portland cement are over 20μm (Table 1 & 2). For Bismuth oxide the number is 10%, and for ProRoot-MTA the number is 6%. Image analysis method shows a similar tendency. This effect becomes more evident in statistical analysis. The ProRoot-MTA contains a larger number of smaller particles than Portland cement or Bismuth oxide (Figure 1a). The same tendency applies for the image analysis method, although it is less evident for the particles less then 10μm (Figure 1b). For Image analysis, the percentage of large particles in Portland cement and Bismuth Oxide is much higher as compared to laser diffraction. This is especially true for particles larger than 80μm where these can only be observed in Image analysis (Figure 1b). This is also because due to gravity, large particles tend to show higher aspect ratio and go towards bottom and can only be detected by Image analysis. This is a unique feature which is attributed only to image analysis as technique requires binary image conversion and then measurement on each and individual particles. In laser diffraction they are not observed as the method is particle distribution intensive. Also, gravity itself has strong effect on the evolving morphology of particles. Larger particles tend to assume flat shape under the effect of gravity.
Table 3: Average particle size (mass median diameter (d50)) values.

According to the laser diffraction method, 48% of the Proroot- MTA, 25% of Portland cement and 19% of Bismuth oxide particles were under 5μm. (Table 1). The d50 (mass median diameter) values of three powders ProRoot MTA, Portland cement and Bismuth Oxide are as follows (Table 3).
Figure 2a: Superimposed laser diffraction and image analy-sis patterns for ProRoot MTA (relative increase %).
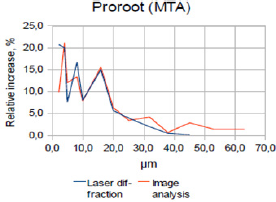
When comparing the relative increase in particle size for ProRoot-MTA, Portland cement and Bismuth oxide, using the laser diffraction method (Figure 1a), a positive correlation according to the increases and decreses are observed. The same is true for the image analysis method (Figure 1a), especially below 20μm.
Figure 2b: Superimposed laser diffraction and image analy-sis bar graphs for ProRoot MTA (relative increase %).
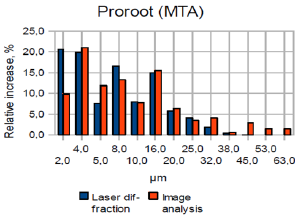
Figure 3: Comparison of Image analysis and laser diffrac-tion particle size analysis data obtained from measure-ments of MTA particle components.
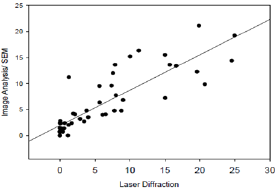
Graphs and charts were made for ProRoot-MTA comparing the laser diffraction method and image analysis method (Figure 2a & 2b). Figure 2b shows that for ProRoot MTA laser diffraction method shows larger amount of smaller particles as compared to image analysis. This is particularly true for particle size below 8μm (Figure 3). A plot was made of all the data from image analysis method and the laser diffraction method (r2=0, 84 n=42). It relates with information presented in Figure 1b and confirms that image analysis method shows more large particles than laser diffraction for powder analysis. It also shows a positive correlation between the data obtained from analysis of identical samples.
When the ProRoot MTA sample was subjected to back scatter electron measurement in scanning electron microscope, some very bright particles were seen. When examined with x-ray analysis, these particles were shown to be mainly of bismuth oxide. As a control, some of the darker grey particles were examined with x-ray analysis as well, showing high levels of calcium and silicon. This imparts a significance to the study that in depth analysis not only reveal the real nature of particles, but it is deemed necessary for separating their identity in bulk sample which cast direct reflection on properties and application as dental material.
Discussion
Laser diffraction and SEM image analysis of identical samples, produced comparable data with positive correlation. Both methods produced data concerning particle size relatively quickly. The results on average particle size (d50) looked relatively similar for the two methods. It has been recently reported that some particles of MTA are smaller than diameter of dentinal tubules. It has been hypothesized that this might affect the sealing ability of MTA particles.
The laser diffraction technique is a very standardized method for measurement on series of different samples. However, the method is dependent on dispersion of the particles, and it is important that the particles are evenly dispersed in the liquid to acquire accurate measurements. Flocculation of small particles will produce false measurements, seen as a peak in very large particle size measurement. This problem is counteracted by repeated ultrasonic vibration of the samples during measurements. Further, this method does not measure particles with very large diameter as due to the effect of gravity, they tend to show higher aspect ratio and move towards bottom in a sample and cannot be detected (gravity induced flocculation/sedimentation) (Figure 1b).
The image analysis technique is a more time-consuming method requiring both scanning electron microscopy and image analysis with measure of each particle individually because of intrinsic nature of image analysis. However, SEM image analysis makes it possible to asses each particle, concerning shape and possible flocculation with other particles, which cannot directly be measured or observed by other techniques. By using a digital measure tool, it is possible to estimate the periphery of each particle in the cluster, and make diameter measures on seemingly individual particles. The laser diffraction method may measure flocculating particles as one big particle.
Figure 4: SEM particle analysis
4a-4e: ProRoot MTA; bars: 20μm)
4a-4c: Backscatter X-ray SEM analysis of ProRoot MTA demonstrated a high content of Bi2O3
4d: SEM image of flocculating particle group
4f: Portland cement (bar: 20μm)
4g: Bismuth Oxide (bar: 200μm) of ProRoot MTA
4a-4e: Portland cement and Bismuth Oxide (a-e).
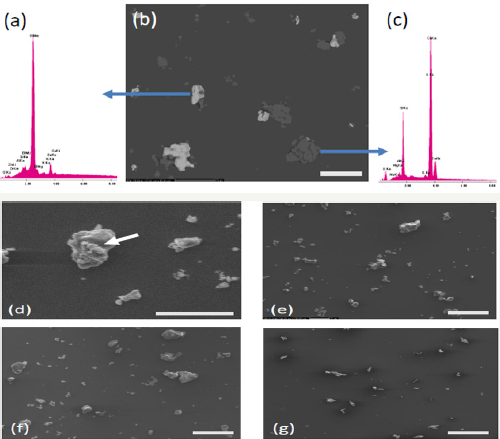
Geometrical figure suitable of representing the average shape of the particles is estimated. A circle was used since many spherical particles were seen. This is supported by earlier observations [13]. Representative images of ProRoot MTA, Portland cement and Bismuth oxide are shown in the following pictures (Figure 4a-4e).
As mentioned earlier when the results were presented, the laser diffraction data is volume based (3 dimensional) while the image analysis data is area based (2 dimensional), which may explain a part of the differences seen between the two methods [14-26].
Figure 4b shows back scatter x-ray scanning electron micrograph of ProRoot MTA. It shows small irregular particles of foreign materials scattered homogeneously all over the matrix. There are two kinds of particles; small light color particles show bismuth oxide while large dark particles are of klinker. The percentage of light color particles is clearly in excess (Figure 4e) showing high content of Bi2O3. This is also confirmed by X ray diffraction plot of both particles individually (Figure 4a: Bismuth oxide, Figure 4c: klinker). Presence of large flocculating particles is shown in Figure 4d. These arise as a result of incomplete and inhomogeneous mixing of particles in suspension under ultrasonic vibration as well as due to effect of gravity on large particles (gravity induced flocculation). These are particularly harmful for the mechanical properties of material. They cause decrease in strength by a) creation of notches around which fracture initiations points occur thus causes decrease in material's strength under the application of external loads and b) mismatching with matrix which result in overall decrease of strength specifically around these particles. Figure 4f shows SEM of Portland cement showing the presence of oxides distributed evenly as particles throughout the matrix. Figure 4g shows SEM of bismuth oxide. The oxide particles are shown to exist as sharp needles as compared to granular semi round particles in case of Portland cement which result in high strength as well as brittleness of this material. This could be removed by slight heat treatment of material causing change in particle’s shape from needle like to granular at the expense of strength. Although the SEM image analysis was quick on few represented images, the method show the same tendency with comparable values in positive correlation as demonstrated in the various diagrams [27-31].
Conclusion
Portland cement and Bismuth oxide are important constituents of ProRoot MTA. These show different laser diffraction and image analysis patterns under electron microscopy. Portland cement contains larger amounts of large particles than ProRoot-MTA and Bismuth oxide [32-35]. Similarly, the ProRoot-MTA contains a larger amount of smaller particles than Portland cement or Bismuth oxide. This difference is by 22%, 10% and 6% in Portland cement, Bismuth oxide and ProRoot-MTA respectively (laser diffraction method). Similar trend is observed in Image analysis. According to the laser diffraction method, 48% of the ProRoot-MTA, 25% of Portland and 19% of Bismuth oxide particles were under 5μm. The study gives an understanding as to what is suitable method for the sizing and comparison of different dental materials, how they can be used and what fractions could be expected in different batches of materials leading to quantification in their practical use specially in selection of materials for root canal treatment.
References
- Aeinehchi M, Eslami B, Ghanbariha M, Saffar AS (2002) Mineral trioxide aggregate (MTA) and calcium hydroxide as pulp-capping agents in human teeth: a preliminary report. Int Endod J 36(3): 225-231.
- Wang WH, Wang CY, Shyu YC,Liu CM, Lin FH, et al. (2010) Compositional characteristics and hydration behavior of mineral trioxide aggregates. J Dent Sci 5(2): 53-59.
- Iwamoto CE, Adachi E, Pameijer CH, Barnes D, Romberg EE, et al. (2006) Clinical and histological evaluation of white ProRoot MTA in direct pulp capping. Am J Dent 19(2): 85-90.
- Dammaschke T, Gerth HU, Zuechner H, Schaefer E (2005) Chemical and physical surface and bulk material characterization of white ProRoot MTA and two Portland cements. Dent Mater 21(8): 731-738.
- Parirokh M, Torabinejad M (2010) Mineral trioxide aggregate: a comprehensive literature review-part I: Chemical, physical and antibacterial properties. Journal of Endodontics 36(1): 16-27.
- Sarkar NK, Caidedo R, Tirwik P, Moiseyeva R, Kawashima I (2005) Physicochemical basis of the biologic properties of mineral trioxide aggregate. J Endod 31(2): 97-100.
- Asgary S, Kheirieh S, Sohilipour E (2011) Particle size of two endodontic biomaterials and Portland cement. Biointerface research in applied chemistry 1(3): 83-88.
- Soheilipour E, Kheirieh S, Madani M, Akbarzadeh Baghban A, Asgary S (2009) Particle size of new endodontic cement compared to Root MTA and calcium hydroxide. Iranian Endodontic Journal 4(3): 112-116.
- Fridland M, Rosado R (2003) Mineral trioxide aggregate (MTA) solubility and porosity with different water-to-powder ratios. J Endod 29: 814817.
- Ferraris CF, Hackley VA, Aviles AI (2004) Measurement of particle size distribution in Portland cement powder: analysis of ASTM round robin studies. Cement, Concrete and Aggregates 26(2): 1-11.
- Cyr M, Tagnit-Hamou A (2001) Particle size distribution of fine powders by LASER diffraction spectrometry. Case of cementitious materials. Materials and Structures 34(6): 342-350.
- Bowen P (2002) Particle size distribution measurement from millimeters to nanometers, and from Rods to Platelets. J Disp Sci Tech 23(5): 631-662.
- Komabayashi T, Spangberg LS (2008) Comparative analysis of the particle size and shape of commercially available mineral trioxide aggregates and portland cement: a study with a flow particle image analyzer. J Endod 34(1): 94-98.
- Camilleri J, Montesin FE, Brady K, Sweeney R, Curtis RV, et al. (2005) The constitution of mineral trioxide aggregate. Dent Mater 21(4): 297-303.
- Funteas UR, Wallace JA, Fochtman EW (2003) A comparative analysis of mineral trioxide aggregate and portland cement. Aust Endod J 29(1): 43-44.
- Asgary S, Parirokh M, Egbbal MJ, Brink F (2005) Chemical differences between white and gray mineral trioxide aggregate. J Endod 31(2): 101103.
- Asgary S, Parirokh M, Eghbal MJ, Stowe S, Brink F (2006) A qualitative X-ray analysis of white and grey mineral trioxide aggregate using compositional imaging. Journal of Materials Science: Materials in Medicine 17(2): 187-191.
- Camilleri J, Montesin FE, Brady K, Sweeney R, Curtis RV, et al. (2005) The constitution of mineral trioxide aggregate. Dent Mater 21(4): 297-303.
- Kogan P, He J, Glickman GN, Watanabe I (2006) The effects of various additives on setting properties of MTA. J Endod 32(6): 569-572.
- Kettering JD, Torabinejad M (1995) Investigation of mutagenicity of mineral trioxide aggregate and other commonly used root-end filling materials. J Endod 21(11): 537-539.
- Braz MG, Camargo EA, Salvadori DMF, Marques MEA, Ribeiro DA (2006) Evaluation of genetic damage in human peripheral lymphocytes exposed to mineral trioxide aggregate and Portland cement. J Oral Rehab 33(3): 234-239.
- Roberts HW, Toth JM, Berzins DW, Charlton DG (2008) Mineral trioxide aggregate material use in endodontic treatment: A review of the literature. Dent Mater 24: 149-164.
- Torabinejad M, Hong CU, Pitt Ford TR, Kettering JD (1995) Cytotoxicity of four root end filling materials. J Endod 21(10): 489-492.
- Balto HA (2003) Attachment and morphological behavior of human periodontal ligament fibroblasts to mineral trioxide aggregate: a scanning electron microscope study. J Endod 30: 25-28.
- Haglund R, He J, Safavi KE, Spangberg LSW, Zhu Q (2003) Effects of root- end filling materials on fibroblasts and macrophages in vitro. Oral Surg Oral Med Oral Pathol Oral Radiol Endod 95(6): 739-745.
- Asgari M, Lobner D (2003) In vitro neurotoxic evaluation of root-end filing materials. J Endod 29(11): 743-746.
- Torabinejad M, Ford TR, Abedi HR, Kariyawasam SP, Tang HM (1998) Tissue reaction to implanted root-end filling materials in the tibia and mandible of guinea pigs. J Endod 24(7): 468-471.
- Baek SH, Plenk H Jr, Kim S (2005)Periapical tissue responses and cementum regeneration with amalgam, SuperEBA, and MTA as root-end filling materials. J Endod 31(6): 444-449.
- Pitt Ford TR, Torabinejad M, McKendry DJ, Hong CU, Kariyawasam SP (1995) Use of mineral trioxide aggregate for repair of furcal perforations. Oral Surg Oral Med Oral Pathol Oral Radiol Endod 79: 756-763.
- Holland R, Filho JAO, de Souza V, Nery MJ, Bernabe PFE (2001) Mineral trioxide aggregate repair of lateral root perforations. J Endod 27(4): 281-284.
- Main C, Mirzayan N, Shabahang S, Torabinejad M (2004) Repair of root perforations using mineral trioxide aggregate: a long-term study, journal of endodontics 30(2): 80-83.
- Saidon J, He J, Zhu Q, Safavi K, Spangberg LS (2003) Cell and tissue reactions to mineral trioxide aggregate and Portland cement. Oral Surg Oral Med Oral Pathol Oral Radiol Endod 95(4): 483-489.
- Torabinejad M, Hong CU, McDonald F, Pitt Ford TR (1995) Physical and chemical properties of a new root-end filling material. J Endod 21(7): 349-353.
- Kayahan MB, Nekoofar MH, Kazandag M (2009) Effect of acid-etching procedure on selected physical properties of mineral trioxide aggregate. Int Endod J 42(11): 1004-1014.
- Lee YL, Lin FH, Wang WH, Ritchie HH, Lan WH, et al. (2007) Effects of EDTA on the hydration mechanism of mineral trioxide aggregate. J Dent Res 86(6): 534-538.
 a Creative Commons Attribution 4.0 International License. Based on a work at www.crimsonpublishers.com.
Best viewed in


.jpg)


 Editorial Board Registrations
 Submit your Article
 Refer a Friend
 Advertise With Us
.jpg)


.jpg)


.bmp)
.jpg)
.png)
.jpg)


.jpg)


.png)

.png)


.png)


