- Submissions
Full Text
Researches in Arthritis & Bone Study
Broadening the Spectrum of Diffusion Weighted Imaging to Evaluate Marrow Pathologies
Razak K and Meena GL*
Department of Radiodiagnosis, S.P. Medical College, India
*Corresponding author: Meena GL, Senior Professor, Department of Radiodiagnosis, Sardar Patel Medical College, Bikaner, Rajasthan, India
Submission: August 03, 2018; Published: August 27, 2018

Volume 1 Issue 2 August 2018
Abstract:
Objectives:To evaluate the signal characteristics of normal adult bone marrow in whole-body diffusion-weighted (DW) images (WB-DWI), to correlate these characteristics with age and gender, and to determine the causes of these phenomena.
Material and Methods:Ninety-eight healthy volunteers underwent WB-DWI (b=0 and 800s/mm2). Two radiologists visually evaluated the signal characteristics of bone marrow in DW images separately. One radiologist measured the apparent diffusion coefficient (ADC) of the thoracic and lumbar vertebrae, bilateral femur (including head, neck, and proximal and distal femoral shaft), bilateral humeral head, ilium, and scapula. The signal characteristics of normal bone marrow were analyzed.
Results:The visual evaluation results of DW images indicated that hyperintensity of bone marrow was more frequently seen in women aged 21- 50 years (68.4%) than in men aged 21-50 years (3.3%) (P <0.001), men aged 51-81 years (5.9%) (P<0.001), and women aged 51-81 years (15.4%) (P=0.001). However, no statistically significant difference was found between men and women aged 51-81 years (P=0.565). The ADC of bone marrow was significantly higher in women than in men aged 21-50 years. Bone marrow ADC showed significant negative correlation with age in women but not in men.
Conclusion:The signal intensity of bone marrow varies with age and gender in DW images. ADC and the T2 shine through effect contributed to the bone marrow signal intensity in DW images, and the latter effect may predominate.
Keywords:Marrow; Pathologies; Imaging; Diffusion; Adults
Introduction
Diffusion-weighted whole-body imaging with background body signal suppression (DWIBS), which is also called whole body diffusion-weighted imaging (WB-DWI) [1], has been used for screening bone marrow diseases [2], tumor staging, monitoring, and predicting tumor response to therapy [3]. For a correct interpretation, the signal characteristics of normal biological tissues should be known to better differentiate normal from abnormal tissues. However, the signal characteristics of normal adult bone marrow in diffusion-weighted (DW) images has not been clearly depicted in the literature. To the best of our knowledge, few papers have studied this topic. Ording Muller et al. [4] studied the WB-DWI (b=1000 s/mm2) signal features of bone marrow in the normal lumbar spine and pelvis of 42 children (24 boys, 18 girls; age range, 2 months-16 years) by visual evaluation. High signal intensities both within the vertebral bodies and pelvic skeleton were observed in all children. Two papers indicated that the normal bone marrow apparent diffusion coefficients (ADC) were negatively correlated with age (0-84 years) [5,6], but one paper did not support the relationship in 53 male participants aged 28-82 years [7]. In clinical practice, visual assessment of signal intensity on DW images is commonly used for diagnosis rather than ADC measurements. However, no literature depicts the DW signal intensity as related to age and gender in normal adults. The purposes of our study were to evaluate the signal characteristic of normal adult bone marrow on WB-DWI as related to age and gender and to determine the causes of the adult bone marrow signal characteristics related to age and gender.
Material and Methods
Participant selection
This prospective study was approved by our institutional review board and informed consent was obtained from all participants. From October 2016 to March 2017, 100 healthy volunteers were enrolled in this study, with
a. Inclusion criteria including:
- Normal laboratory examinations (including blood count and clotting time test)
- No known clinical or imaging evidence of any bone disease (such as tumor, metastases, or metabolic disorder)
- No history of surgery or injury
- No history of smoking
- No history of chemotherapy or radiotherapy and
- No contraindication to magnetic resonance (MR) examination.
b. Exclusion criteria included:
- Any confirmed abnormality of bone marrow in the current MR examination
- History of alcoholism and certain hormonal therapy and
- Suboptimal image quality.
Two participants were excluded from further analysis because of the suboptimal DW image quality. After exclusion, 98 healthy volunteers (51 women; age range, 21-78 years; 47 men; age range, 24-81 years) were included for this study. The participants were divided into four groups based on age (21-30, 31-40, 41-50, and 51-81 years) according to another paper [8].
MR examination
All images were acquired on a 1.5-Tesla magnetic resonance scanner (Magnetom Avanto, Siemens, Erlangen, Germany) with a 45mT/m maximum gradient capability and one 12-element head matrix coil, one 4-element neck matrix coil, one 24-element spine matrix coil, and four 6-element body matrix coils (Siemens, Munich, Germany). The protocol included a coronal T2-weighted (T2W) short TI inversion recovery (T2-STIR) and an axial DW single-shot echo-planar imaging (EPI) sequence. The parameters of the T2- STIR sequence were: TR/ TE/TI, 4000/322/150ms; field of view (FOV), 50 50cm2; slice/gap, 4/0 mm; matrix, 256 256; number of signals acquired, 1. Coronal images were acquired from the head to the knee using the 4-station approach. Images at the slice level from each station were spliced into coronal whole-body images using software available on the MR workstation (Syngo VB15; Siemens). The parameters of the EPI sequence were: TR/TE, 8000/83ms; FOV, 50 50cm2; slice/gap, 4/0mm; matrix, 192 192; number of signals acquired, 6; b values, 0 and 800s/mm2. Axial slices were acquired from head to knee using the 5-station approach. Each station included 60 slices with a range of 240mm, covering a total range of l200mm. Scanning time for each station was 3 min 26s. Coronal maximal intensity projection (MIP) images of DW images were reconstructed with original axial images and with inverted images for background suppression. Quantitative ADC maps were automatically generated by the MR system.
Image evaluation
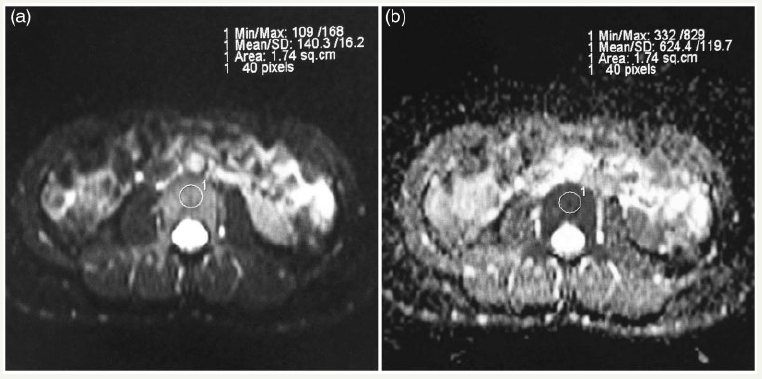
Two types of image evaluation were performed: a qualitative visual evaluation of the DW (b=800s/mm2) image to determine bone marrow signal intensity and a quantitative ADC measurement of bone marrow in the axial ADC map at a workstation. Visual evaluation of bone marrow signal intensity was performed by radiologists with 20 years and 3 years of clinical experience interpreting musculoskeletal MR images. Prior to the visual evaluation, an overview of all images was performed to evaluate bone marrow image quality. The bone marrow signal intensity of the DW images was defined on a two level ordinal scale, ‘‘hypointense or isointense’’ and ‘‘hyperintense’’ based on the literature [1,4]. Bone marrow is defined as hypointense or isointense (Figure 1a & 1b) when it has a signal intensity that is lower than or equal to the signal intensity of fat and muscle. Hyperintense (Figure 1c & 1d) is defined as having higher signal intensities than fat and muscle. Visual interpretation by the two radiologists was based on the bone marrow in the entire body. All images were independently evaluated by each of the two radiologists who were blinded to the findings of the other. To assess intra-observer agreement, reader 1 re-evaluated the DW images for all 98 participants following the procedure used in the first evaluation 1 month later without knowledge of the results of the first reading. For clarity, only the results from reader 1 in the first evaluation are reported. To effectively double blind qualitative findings, all data were collected by the third radiologist (FZC) after completion of the evaluation. The quantitative measurements of ADC of bone marrow were performed by one radiologist (FZC) using commercially available software (Syngo VB15; Siemens) using the following methods: In the vertebrae, one circular region of interest (ROI) (thoracic vertebrae, 21 pixels; lumbar vertebrae, 40 pixels) was placed by identifying a central slice in each of the five thoracic vertebrae (T12 through T8) and each of the five lumbar vertebrae (L1 through L5), respectively (Figure 2a & 2b). The average ADC of five vertebrae was used for further analysis. In the femoral head, femoral neck, humeral head, and scapula, specific sized ROIs with 65, 21, 65, and 5 pixels, respectively, were placed on five central consecutive slices of each side. In the proximal femoral shaft, ROIs with 21 pixels were placed on five consecutive slices below the femoral greater trochanter. In the distal femoral shaft, ROIs with 24 pixels were placed on five consecutive transverse image slices at the distal end of the femur. In the ilium, ROIs with 12 pixels were placed on five consecutive slices at the sacroiliac joint level of each side. The average ADCs of both sides of five consecutive slices in the above each anatomy site were used for further analysis. Care was taken to exclude blood vessels, cortex, and artifacts from the ROI. These ROIs were manually set on axial EPI images acquired with b=0s/ mm2, allowing these structures to be easily identified, then copied onto axial ADC maps. The software automatically calculated ADC by averaging the signal intensity within the ROI. The measurements were repeated using the same methods as the above by FZC 1 month later without reference to the previously determined values for the intra-observer reliability test. The values of the first measurement for each site were used for further analysis.
Statistical analysis
The frequency of hyperintense bone marrow in the DW images of women aged 21-50 years and men aged 21-50 years or 51-81 years, and women aged 51-81 years were compared using the 2 test. For men and women aged 51-81 years, the comparison was made using Fisher’s exact test because the total number of the participants in this age group was less than 40. To compare the ADC values of bone marrow between male and female participants in different age groups and between women aged 21-50 and 51-81 years at various bone sites, Student’s t-test was used for data with normal distributions, while for data without normal distributions, the Mann-Whitney U test was used. Spearman’s rho was calculated to assess the relationship between the ADC values and age at various bone sites in female and male participants. Intra-observer and inter-observer agreement in the qualitative bone marrow signal intensity visual evaluation were analyzed using weighted Cohen’s kappa statistics. The strength of agreement was interpreted on the basis of the k values suggested by [9], as adapted from the method of [10], as follows: k less than 0.20, poor; k of 0.21-0.40, fair; k of 0.41-0.60, moderate; k of 0.61-0.80, good; and k of 0.81-1.00, very good agreement Intra-observer reliability of ADC measurements was determined using intraclass correlation coefficients (ICCs). ICC values of 0.41-0.60 indicated moderate; 0.61-0.80, good; and 0.81 or greater, very good agreement [11]. All statistical analyses were performed using commercial software SPSS 13.0 (SPSS Inc., Chicago, IL, USA). All tests were two-sided with a significance level of P< 0.05.
figure 1: Normal bone marrow appearance of healthy volunteers on WB-DWI. (a, b) A 24-year-old man. All bone marrow shows as hypo- or isointense on the maximal intensity projection image of the WB-DWI (a) and by inverted image (b). (c, d) A 25-year-old woman. Bone marrow shows as hyperintense on the maximal intensity projection image of WB-DWI (c) and by inverted image (d).
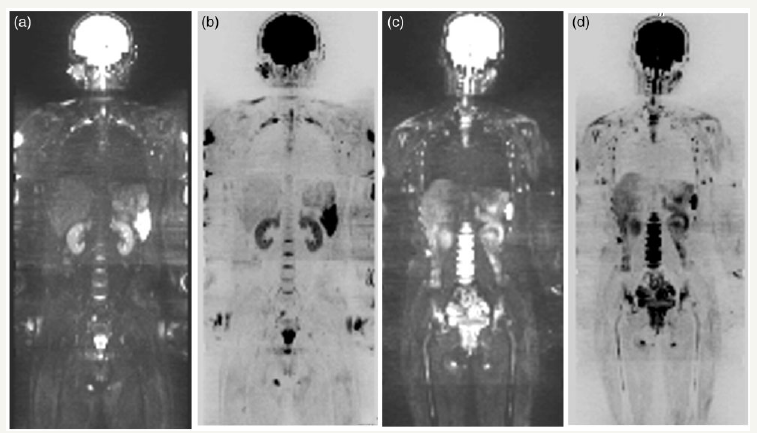
figure 2: Images of a 27-year-old woman. ROI was manually drawn on the axial DW image (b=0s/mm2) (a) and was automatically copied onto the corresponding ADC map (b).
Results
Visualization of signal intensity of bone marrow on DW images (b=800s/mm2)
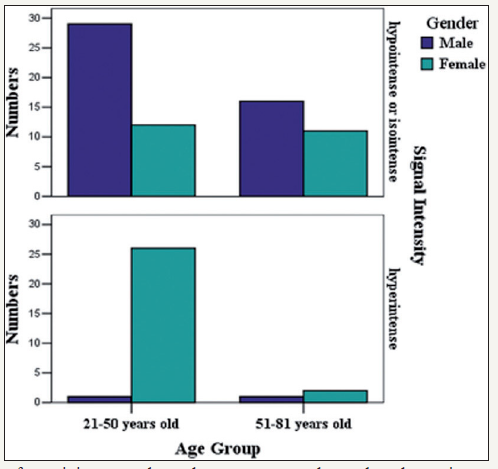
The bone marrow showed hyperintense signals in 30 participants (2 men, 28 women) and hypo- or isointense signals in the remaining 68 participants based on visual inspection of the DW images. The age and gender distributions of the participants with hyperintense bone marrow are shown in Table 1. The visual evaluation results indicated that hyperintense bone marrow was more frequently seen in women aged 21-50 years (68.4%) than men aged 21-50 years (3.3%) or 51-81 years (5.9%), or women aged 51-81 years (15.4%). However, no statistically significant difference was found between men and women aged 51-81 years (Table 1) (Figure 3).
Table 1: Age and sex distribution of participants whose bone marrow was hyperintense in the DW images (b=800s/ mm2).
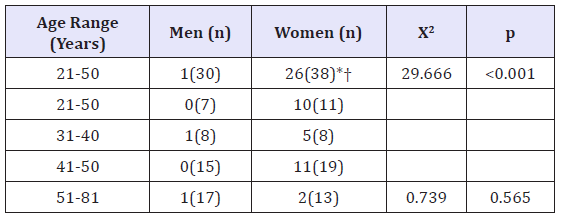
The numbers in parentheses are participant numbers within each age and sex. *Statistically significant differences were also found between the 21-50 and the 51-81 year-old female groups (Χ2=11.004, p=0.001).
†Statistically significant differences were also found between the 21-50 -year-old female group and the 51-81 -year old male group (Χ2-18.381, p=0.000)
Comparison of the ADC values between the genders of different age groups
In the 21-50-year age group, the ADC values of bone marrow were significantly higher in women than in men in all of the regions that were measured (Table 2). The ADC values of bone marrow in the 21-50-year age group were significantly higher than those in the 51-81-year group of women in all regions except for the distal femur segment and the scapula.
Table 2: Comparison of ADC values (×10-3mm2/s) of bone marrow for different age and sex at various bone sites.

*Values are mean±SD for data with normal distributions. Student’s t-tests was used, and statistical significance was set at p<0.05.
†Values are the median and interquartile range for data without normal distributions. The Mann-Whitney U test was used, and statistical significance was set at p<0.05.
Figure 3: Age and sex distribution of participants whose bone marrow showed as hyperintense on DW images (b=800s/mm2).
Correlations between the ADC values of bone marrow and age for all female and male participants
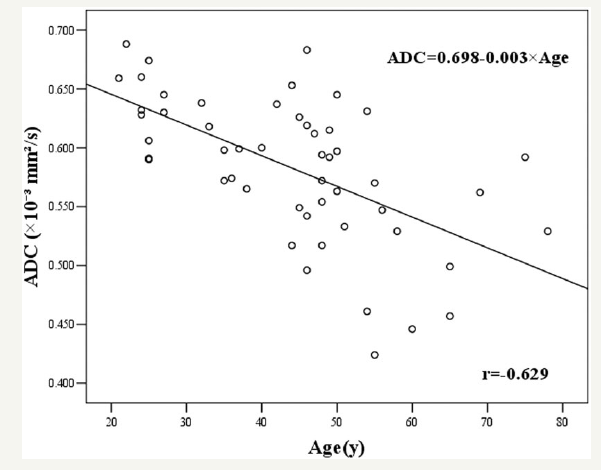
There were significant negative correlations between the ADC values of bone marrow and age for women in all regions except for the distal femur segment and the scapula. In the scatter diagram, for participants older than 50 years, the tendency is not very strong compared with the 21-50-year-old participants (Figure 4). However, there were no significant correlations between the ADC values of bone marrow and age in all the regions in men (Table 3).
Table 3: Spearman’s rho analysis of the ADC values and ages in various regions for male and female participants.
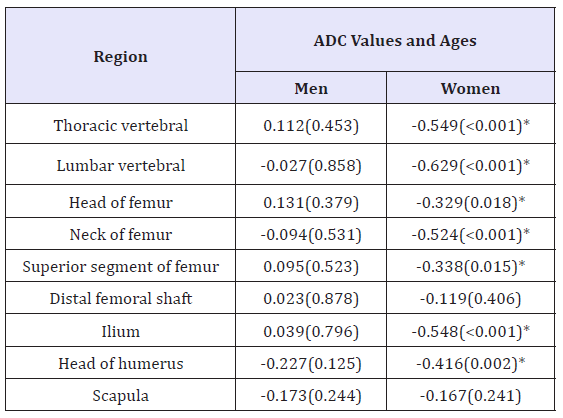
Data are correlation coefficients with the p values in parentheses.
*Denotes significant correlation; no*denotes no significant correlation.
Intra- and inter-observer agreement for visual evaluation of the signal intensity of the DW images
In the visual evaluation of the signal intensity of the DW images, inter-observer agreement (k=0.861) and intra-observer agreement of reader 1 (k=0.885) were very good.
Intra-observer reliability of the ADC measurements
In the quantitative ROI assessment, the intra-observer reliability of ADC measurements of all regions was good to very good (ICC=0.715-0.865).
Discussion
We found that, in the DW images, the bone marrow of women aged 21-50 years (68.4%) was often significantly more hyperintense than the 21-50 and 51-81- year-old male groups (3.3% and 5.9%, respectively), and the 51-81-year-old female group (15.4%). There was no significant difference between women (15.4%) and men (5.9%) older than 50 years. These results suggest that men older than 21 years or women older than 50 years with bone marrow that is hyperintense in WBDWI should be further examined by laboratory tests or other tests to rule out bone marrow disease. We found that bone marrow ADC in women was negatively correlated with age. This tendency is more obvious and statistically significant in women aged 21- 50 years than in those aged more than 50 years, which is shown in a scatter diagram of lumbar vertebral bone marrow (Figure 4). Nonomura et al. [12] found that the ADC values of bone marrow decreased as fat increased based on biopsies of iliac crest bone marrow. The reason for this behavior may be that the fat cells have limited room due to less intracellular water and adjacent free water, which limit molecular diffusion. Shih et al. [13] found that vertebral marrow fat content increased with increasing age in women, which could explain the negative relationship between ADC and age in women in our results. Vertebral marrow fat content for men increases slowly throughout life [8,14], and the water fraction of vertebral marrow for men was found to be relatively stable over the age range of 25-75 years [15], which means marrow conversion was almost complete for men by the age of 25 years. These results may explain the lack of correlation of bone marrow ADC and age for men in the current study, which is consistent with the result of another study [7]. According to our results, the ADC values of bone marrow were significantly higher in women than in men aged 21-50 years. The bone marrow signal intensity in DW images of women was also higher than that of men in this age group. However, the literature indicates that structures with restricted diffusion are subject to less signal attenuation, making the signal intensity higher in the DW images and giving lower ADC values on ADC maps [16]. This contradiction may be explained by the fact that the bone marrow with higher ADC values has less fatty marrow and more water, which results in tissue with longer T2 relaxation times. The longer T2 relaxation time can increase the signal intensity in the DW images, which is called the T2 shine through effect [17-20]. Because the signal intensity of the DW images is mainly affected by ADC and the T2 shine-through effect and, by a smaller amount, the proton density [17], we speculate that if the magnitude of the positive contribution from the T2 shine-through effect is greater than the magnitude of the negative contribution from the increased ADC, the net effect of both contributions will be positive in DW images. One paper supports our results that the water fraction of the lumbar vertebral marrow for women exceeded that for men aged 25-54 years [15], which could explain the higher bone marrow signals of women aged 21-50 years in the current study, i.e. due to the T2 shine through effect. The marrow ADC in women aged 21- 50 years was higher than in men aged 21-50 years, which implies that there is more hematopoietic marrow and less fatty marrow [8,14,21] in women than in men at this age. In this period, women have much higher estrogen than men because the average natural menopause age for Chinese women usually begins close to the age of 50 years [22]. Estrogen levels have a negative influence on the levels of marrow fat [23], which can explain the above results. After a precipitous drop around menopause, estrogen levels in postmenopausal women are slightly lower than those in men, whereas estrogen levels remain virtually unchanged for men with increasing age [24]. This behavior may be the cause of the high signal in the DW images and the ADC values that are almost the same in women as men aged over 50 years. However, the mechanism of estrogen affecting bone marrow fat is still not clear. Apart from estrogen, growth hormone [25] and testosterone [26] also affect the bone marrow fat component, which make the scenario complex and further study is needed. Because chronic anemia could lead to yellow marrow changing to hematopoietic marrow [27], we suspect that menses, which can induce blood loss, can affect the proportion of hematopoietic and fatty marrow. However, there is no reliable evidence that supports this conjecture. Our study had several limitations. First, the volunteers were of heterogeneous ages. The populations of some age groups were relatively small, which may skew the results. Second, participants in the age range of 0-20 years were not included in the study, so further study is needed. Third, other factors that may affect bone marrow, such as starvation [28], bone mineral density [29], body mass index [30], physical activity, vitamin D levels, menstrual status, and sex hormones [31,32], were not taken into consideration.
Figure 4: Scatter diagram indicating the correlation between the ADC (10-3mm2/s) of the lumbar vertebral bone marrow and age for female participants, r=-0.629.
Conclusion
In conclusion, we demonstrated the signal characteristics of normal adult bone marrow in WB-DWI and correlated them with age and gender. Knowledge of these factors is essential to correctly interpret DW images in clinical practice.
References
- Takahara T, Imai Y, Yamashita T, Yasuda S, Nasu S, et al. (2004) Diffusion weighted whole body imaging with background body signal suppression (DWIBS): technical improvement using free breathing, STIR and high resolution 3D display. Radiat Med 22(4): 275-282.
- Nakanishi K, Kobayashi M, Nakaguchi K, Kyakuno M, Hashimoto N, et al. (2007) Whole body MRI for detecting metastatic bone tumor: diagnostic value of diffusion-weighted images. Magn Reson Med Sci 6(3): 147-155.
- Koh DM, Collins DJ (2007) Diffusion-weighted MRI in the body: applications and challenges in oncology. Am J Roentgenol 188(6): 1622-1635.
- Ording Müller LS, Avenarius D, Olsen OE (2011) High signal in bone marrow at diffusion-weighted imaging with body background suppression (DWIBS) in healthy children. Pediatr Radiol 41(2): 221-226.
- Herrmann J, Krstin N, Schoennagel BP, Sornsakrin M, Derlin T, et al. (2012) Age related distribution of vertebral bone-marrow diffusivity. Eur J Radiol 81(12): 4046-4049.
- Li Q, Pan SN, Yin YM, Li W, Chen ZA, et al. (2011) Normal cranial bone marrow MR imaging pattern with age-related ADC value distribution. Eur J Radiol 80(2): 471-477.
- Zhang CY, Rong R, Wang XY (2008) Age-related changes of bone marrow of normal adult man on diffusion weighted imaging. Chin Med Sci J 23(3): 162-165.
- Kugel H, Jung C, Schulte O, Heindel W (2001) Age- and sex- specific differences in the 1 H-spectrum of vertebral bone marrow. J Magn Reson Imaging 13(2): 263-268.
- Laborie LB, Lehmann TG, Engesæter IØ, Eastwood DM, Engesæter LB, et al. (2011) Prevalence of radiographic findings thought to be associated with femoroacetabular impingement in a population-based cohort of 2081 healthy young adults. Radiology 260(2): 494-502.
- Landis JR, Koch GG (1977) The measurement of observer agreement for categorical data. Biometrics 33(1): 159-174.
- Davarpanah AH, Chen YP, Kino A, Farrelly CT, Keeling AN, et al. (2010) Accelerated two- and three-dimensional cine MR imaging of the heart by using a 32-channel coil. Radiology 254(1): 98-108.
- Nonomura Y, Yasumoto M, Yoshimura R, Haraguchi K, Ito S, et al. (2001) Relationship between bone marrow cellularity and apparent diffusion coefficient. J Magn Reson Imaging 13(5): 757-760.
- Shih TT, Chang CJ, Hsu CY, Wei SY, Su KC, et al. (2004) Correlation of bone marrow lipid water content with bone mineral density on the lumber spine. Spine 29(24): 2844-2850.
- Griffith JF, Yeung DK, Ma HT, Leung JC, Kwok TC, et al. (2012) Bone marrow fat content in the elderly: a reversal of sex difference seen in younger subjects. J Magn Reson Imaging 36(1): 225-230.
- Ishijima H, Ishizaka H, Horikoshi H, Sakurai M (1996) Water fraction of lumbar vertebral bone marrow estimated from chemical shift misregistration on MR imaging: normal variations with age and sex. Am J Roentgenol 167(2): 355-358.
- Le Bihan D, Turner R, Douek P, Patronas N (1992) Diffusion MR imaging: clinical applications. Am J Roentgenol 159(3): 591-599.
- Burdette JH, Elster AD, Ricci PE (1999) Acute cerebral infarction: quantification of spin-density and T2 shine-through phenomena on diffusion- weighted MR images. Radiology 212(2): 333-339.
- Kwee TC, Takahara T, Ochiai R, Katahira K, Van Cauteren M, et al. (2009) Whole-body diffusion-weighted magnetic resonance imaging. Eur J Radiol 70(3): 409-417.
- Colagrande S, Belli G, Politi LS, Mannelli L, Pasquinelli F, et al. (2008) The influence of diffusion- and relaxation-related factors on signal intensity: an introductive guide to magnetic resonance diffusion-weighted imaging studies. J Comput Assist Tomogr 32(3): 463-474.
- Khoo MM, Tyler PA, Saifuddin A, Padhani AR (2011) Diffusion weighted imaging (DWI) in musculoskeletal MRI: a critical review. Skeletal Radiol 40(6): 665-681.
- Mitchell DG, Rao VM, Dalinka M, Spritzer CE, Axel L, et al. (1986) Hematopoietic and fatty bone marrow distribution in the normal and ischemic hip: new observations with 1.5-T MR imaging. Radiology 161(1): 199- 202.
- Sun D, Shao H, Li C, Tao M (2015) An analysis of the main reasons that perimenopausal and postmenopausal women in China have for seeking outpatient treatment and factors influencing their symptoms: a single- center survey. Clin Exp Obstet Gynecol 42(2): 146-151.
- Syed FA, Oursler MJ, Hefferanm TE, Peterson JM, Riggs BL, et al. (2008) Effects of estrogen therapy on bone marrow adipocytes in postmenopausal osteoporotic women. Osteoporos Int 19(9): 1323-1330.
- Khosla S, Melton LJ, Atkinson EJ, O Fallon WM, Klee GG, et al. (1998) Relationship of sex steroid levels and bone turnover markers with bone mineral density in men and women: a key role for bioavailable estrogen. J Clin Endocrinol Metab 83(7): 2266-2274.
- Appiagyei Dankah Y, Tapiador CD, Evans JF, Castro Magana M, Aloia JF, et al. (2003) Influence of growth hormone on bone marrow adipogenesis in hypophysectomized rats. Am J Physiol Endocrinol Metab 284(3): E566-E573.
- Tamura N, Kurabayashi T, Nagata H, Matsushita H, Yahata T, et al. (2005) Effects of testosterone on cancellous bone marrow adipocytes, and ovarian phenotype in a young female rat model of polycystic ovary syndrome. Fertil Steril 84(Suppl 2): 1277-1284.
- Kricun ME (1985) Red-yellow marrow conversion: its effect on the location of some solitary bone lesions. Skeletal Radiol 14(1):10-19.
- Bredella MA, Fazeli PK, Miller KK, Misra M, Torriani M, et al. (2009) Increased bone marrow fat in anorexia nervosa. J Clin Endocrinol Metab 94(6): 2129-2136.
- Schwartz AV, Sigurdsson S, Hue TF, Lang TF, Harris TB, et al. (2013) Vertebral bone marrow fat associated with lower trabecular BMD and prevalent vertebral fracture in older adults. J Clin Endocrinol Metab 98(6): 2294-2300.
- Poulton TB, Murphy WD, Duerk JL, Chapek CC, Feiglin DH, et al. (1993) Bone marrow reconversion in adults who are smokers: MR Imaging findings. Am J Roentgenol 161(6): 1217-1221.
- Slemenda C, Longcope C, Peacock M, Hui S, Johnston CC (1996) Sex steroids, bone mass, and bone loss. A prospective study of pre-, peri-, and postmenopausal women. J Clin Invest 97(1): 14-21.
- Shetty S, Kapoor N, Naik D, Asha SH, Prabu S, et al. (2014) Osteoporosis in healthy South Indian males and the influence of life style factors and vitamin D status on bone mineral density. J Osteoporos 2014: 723238.
© 2018 Meena GL. This is an open access article distributed under the terms of the Creative Commons Attribution License , which permits unrestricted use, distribution, and build upon your work non-commercially.
 a Creative Commons Attribution 4.0 International License. Based on a work at www.crimsonpublishers.com.
Best viewed in


.jpg)


 Editorial Board Registrations
 Submit your Article
 Refer a Friend
 Advertise With Us
.jpg)


.jpg)


.bmp)
.jpg)
.png)
.jpg)


.jpg)


.png)

.png)


.png)


