- Submissions

Full Text
Polymer Science: Peer Review Journal
Environmental Impact of Starch-Protein Blend Biopolymers
Stanley Jade1, Culliton David2, Jovani Sancho3, Antonio Jonay3 and Neves Adriana Cunha1*
1Department of Applied Science, South-East Technological University, Kilkenny Rd, Ireland
2Department of Aerospace, Mechanical and Electronic Engineering, South-East Technological University, Ireland
3United Kingdom Centre for Ecology and Hydrology, United Kingdom
*Corresponding author:Neves Adriana Cunha, Department of Applied Science, South-East Technological University, Kilkenny Rd, Moanacurragh, Carlow, R93 V960, Ireland
Submission: December 13, 2023;Published: December 22, 2023
ISSN: 2770-6613 Volume5 Issue3
Abstract
With the escalation of the problem of plastic pollution at an alarming rate, the increase in research on bioplastics has been notable. Bioplastics made from starch and protein blends have been found to have biodegradable properties, but the majority use non-sustainable starch sources. While bioplastics show biodegradation ability, it is equally vital that they are a sustainable replacement and do not negatively affect the environment after degradation. This study assesses the environmental impact of using different starches to generate biodegradable bioplastics. Starch-protein blend biopolymers were generated using potato, tapioca, sago and swamp taro starch, and their soil degradation was assessed visually and using oxitop chambers. Moreover, plant and worm toxicity, worm preference, soil microbiome, plant biomass, mycelium growth, aquatic toxicity and water degradation were also investigated. The study reveals that biopolymers have varying environmental impacts depending on the starch used in their formulation. These biopolymers cause environmental stress without causing severe adverse effects on plant germination by shifting the biodiversity of the soil with added nutrients. The soil microbiome showed increased firmicutes and decreased Actinobacteria, and all SPBBs (Starch Protein Blend Biopolymers) displayed biodegradable properties, meaning they degraded within less than three months. Expanding knowledge about these polymers can help develop more environmentally friendly and degradable biopolymers.
Keywords:Thermo bioplastic; Biopolymers; Starch; Environmental; Characteristics; Protein; Starch protein blend
Introduction
In response to economic and environmental concerns, scientists have made significant strides in developing biodegradable polymers as alternatives to current petrochemical-based plastics [1]. Additionally, only an estimated nine per cent of all plastic ever produced has been recycled, according to the Royal Statistical Society of Great Britain [2]. The Irish Climate Action Plan 2021 aims to reduce plastic pollution; using bioplastics as an alternative would benefit this action plan [3]. In light of the availability of more affordable and renewable bioplastics, the development of bioplastics represents a revolutionary step forward in addressing environmental issues [4]. Besides, starch, being an inexpensive and biodegradable polymer, holds immense potential as a raw material for the production of bioplastics, particularly when combined with proteins that lead to the generation of mechanically robust bioplastics [5].
According to European bioplastic definitions [6], a plastic substance is bioplastic if it is either bio-based, biodegradable, or possesses both qualities. The term “bio-based” denotes that a product, such as starches, is partially derived from plants. Bio-based does not automatically imply biodegradable. The ability of a material to degrade through biodegradation is not dependent on its resource basis but rather on how chemically complex it is. Consequently, 100% of bio-based polymers may not biodegrade depending on the treatment used to make it a biopolymer. Only when the environment and time are specified does the term “biodegradability” become apparent. To claim biodegradability without any other standard specifications is misleading to the public and a form of greenwashing. If the substance is claimed to be biodegradable, extra details regarding the length of time, the level of biodegradation, and the proper environmental preparation should be provided [6].
While there is ample evidence of environmental issues of plastic pollution [7], there is a gap in knowledge of the ecological impact of alternative biopolymers once these are discarded. Biopolymers’ potential environmental benefits and drawbacks depend on various factors, including their place of origin, manufacturing procedures, waste disposal methods, etc. [8]. Moreover, when degraded, these biopolymers have the potential to change ecosystems, so it is fundamental to assess the end life of any new biopolymer generated in its environmental impact. This study investigates the environmental impact of using different starch sources (Potato, Tapioca, Sago and Swamp Taro) in the next generation of biopolymers.
Materials and Methods
Materials
Potato starch (M.P. Biomedicals LLC, Amsterdam, The Netherlands), Tapioca, Sago and Swamp Taro starches (provided by Dr. Jonay Jovani-Sancho) food-grade piscine gelatine, 200 bloom (Louis Francois, Croissy-Beauboufg, France) were used to generate bioplastics. Glycerol (EMPROVE®bio, Merck KGaA, Darmstadt, Germany) was used as a plasticizer. The soil was collected from a field in Ratoath, CO. Meath, Ireland, for visual degradation. The sand was quartz sand, pots, seeds and compost (John Innes Multi- Purpose Compost 50L) were purchased from a local garden centre (Woodies, Ireland). From the same garden centre, Westland Top Soil, nutrient garden soil was used for the biomass assay. Natural soil for the Oxitops was collected onsite from the SETU Carlow campus in CO. Carlow, Ireland. The worms were bought from original organics in Ireland. Kits used for marine toxicity and phytotoxicity were Algaltoxkit M and Phytotoxkit Solid Samples from Microbiotests, Gent, Belgium. DNeasy® PowerSoil® Pro Kit was purchased from Qiagen, based in Hilden, Germany. River water degradation was based on a tributary stream from the Hurley River, CO. Meath, Ireland.
Making bioplastics
The bioplastics were created using the method from Stanley et al. [9]. Each starch production was reviewed regarding water and carbon footprint for 1kg of starch, using the literature gathered.
Visual soil degradation
Plant pots were used with 500g of soil, sand and compost per sample. The layout of bioplastic samples was constructed in a randomised design to eliminate any noise variables. Pieces were placed halfway inside each pot, which was 5cm deep. Two commercial bioplastics and the Potato, Tapioca, Sago and Swamp Taro bioplastic samples were used. Pictures of the samples were taken on the first day, and every seven days, the samples were carefully dug up, and an image was taken until there was no more visible sample left.
Oxitop soil degradation
Degradation studies were performed in soils using OxiTop soil respiration chambers with the soil prepared according to Mroczkowska et al. [10]. The soil’s water-holding capacity was measured and corrected to 50% of the soil’s total water-holding capacity. Then, 100g of standard soil was added to each chamber, and 1500mg of one bioplastic was added. Two controls were used: A negative control of the soil and no bioplastic and a positive control with 1500mg of cellulose filters. Samples were started using the OxiTop controller, and the chambers were kept at 20 ℃ in darkness. Degradation tests were carried out in triplicate. Measurements were taken every 6 hours for 99 days. Once one of the chamber pressures dropped to -100hPa, all chambers were ventilated to return the atmospheric pressure and placed back into the environmental chamber.
Plant phytotoxicity
To assess whether the bioplastics had any phytotoxic effect, they were tested against two plant species, Sorghum saccharatum (Sorghum, a representative monocot) and Sinapis alba (Mustard, a dicot species), [11]. The experiment was carried out in the soil standard from the Oxitop, excluding the salts. The water holding capacity of the soil was determined to adjust the water content of the soil to 50% of the soil’s total water holding capacity. In a glass funnel with cotton wool, 50g of test soil was hydrated with 50mL of deionized water. Water was left to drip into a graduated cylinder over 24 hours. The water retained by the soil was used to calculate the % water holding capacity. There was a slight modification from that paper as the growth of the shoots was also of interest; therefore, the germination time was extended. Then, 1.25g of bioplastic per 100g of soil was added and allowed to degrade over two weeks until no bioplastic pieces were visible. Plates were filled with 100g of test soil in the lower compartment of the two-part plates; the filter paper was placed on top of the soil, and ten seeds of the same test flora were placed on top of the filter paper. Plates were incubated at 25 °C for two weeks, after which seed shoot and root lengths were measured.
Plant biomass
The plants used in the phytotoxicity were then split between
their roots and shoots, and all the control plants for mustard were
grouped together. This was repeated for the other samples and
the plant samples from Sorghum. The samples were wet weighed,
allowed to dry for two days at 60 ℃ and then re-weighed when dry
[12]. The following equation was used to collect their biomass:
(Dry weight)/(Wet weight)x100=% Dry matter
Dry Weight=Sample after drying
Wet Weight=Sample before drying
Worm toxicity
The eco-toxicity of bioplastics was investigated in an
earthworm acute toxicity test following the OECD guideline 207,
with a modification to the soil composition. In this test, the soil
was a ~10:1 ratio of peat compost and natural soil, respectively.
The worms were first climatised in a 1:1 test soil, and compost
the worms came in for five days at 20 ℃ in a climatic chamber. In
this test, compost worms (Eisenia andrei) were exposed to control
and treated soil containing the bioplastics. They were fed 2g of
oatmeal once a week, and soil moisture levels were maintained.
After four weeks, all adult worms were collected, washed, dried,
and weighed, and any morphology difference was recorded. There
was 5g oatmeal added to each container once, and moisture was
maintained following the protocol for the following four weeks. The
young worms were found and collected by two methods:
a. The containers were placed in a hot water bath at 40 ℃
for 20 minutes while the temperature was increased to 60 ℃.
b. Was to gently sieve/dig through the soil, looking for small
worms or cocoons. Those found were weighed and counted to
determine any change in reproduction.
Worm preference
Figure 1:Worms movement from different chambers to preferred soil.
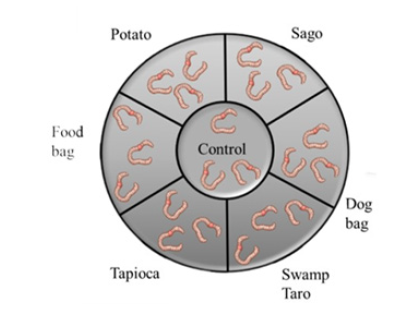
Three worms were added to each chamber as each chamber could hold a maximum of 150g of soil, and compost worms require 50g of soil/worm to feel comfortable (Figure 1). Each chamber contained a different soil; soil with no bioplastic, the SPBB’s produced and two commercial bioplastics (one that is a food bag and a dog bag). There were holes between the chamber to allow free movement for 14 days. The worms were fed 2 grams equally distributed once a week, and the moisture level was maintained at 40%. Then, the worms were retrieved from the chamber, and how many were in each chamber was counted. This experiment was conducted three times, and the average number of worms in each chamber was calculated, along with which chamber they were in when found.
Soil microbiome
To determine whether the presence of bioplastics in the soil had any adverse impacts on the variety of soil microbes, microbiome analysis was done on soil samples that had been incubated with the bioplastics. The soil from the biodegradation (Oxitop) experiment was employed for this analysis. Soil samples were obtained before and after the decomposition of the bioplastic (after 99 days). Using the DNeasy® PowerSoil® Pro Kit, 250mg of soil samples were used to extract DNA. Three DNA extractions from the soil were done before the biodegradation of the bioplastic, and three DNA extractions were done 99 days following the biodegradation of the bioplastic. These DNA samples were delivered to a commercial DNA sequencing company for library preparation and sequencing (Novogene, UK), and the sequence results were entered into the Silva database under its Bio project number. The microbiomes of the soil samples were examined using metagenomic sequencing of the V3-V4 region of the bacterial 16S ribosomal ribonucleic acid (rRNA) gene to get the potential effects of bioplastics on the soil bacterial communities. Four replicate soil samples were treated with piscine bioplastic, and four untreated (control) soil replicates had their DNA extracted. Most bacterial populations were covered by the sequencing’s average of 130,000 reads per sample.
Marine toxicity
The toxicity of the bioplastics to marine microalgae
(Phaeodactylum tricornutum) was assessed using the commercially
available AlgaltoxTM kit following the manufacturer’s instructions.
Microalgae were pre-cultured in culturing medium without shaking
before the test for five days at 25 °C (±2 °C) with illumination. Then,
5g of each bioplastic was dissolved in 100mL volumetric flasks
with culturing medium and made up to the mark, and 10 mL of the
bioplastic suspension was transferred into test vials and inoculated
with 1mL of pre-cultured microalgae. Flasks without bioplastics
acted as negative controls. Initial Optical Density (OD) was
measured at 670nm in a spectrophotometer. OD results were taken
throughout the experiment for nine days, and final readings were
used to determine the statistical difference between treatments.
Before each measurement test, the vials were shaken to resuspend
microalgae cells evenly. No commercial bioplastic was used as none
would degrade in the water. The algae cell numbers were converted
using a formula from the kit as follows:
(893918×Abs)-33700=Number of Algae Cells
Abs=Absorbance value
Number values are given from the Microbiotest kit (each
equation is unique to each kit batch)
Biological oxygen demand in water
For the samples, 40g of bioplastic was dissolved into 40ml of tap water by heating to 65 ℃ at 240rpm for 40 minutes. The samples were kept at six ℃ for ≤24 hours before use. Dilution water was prepared with 6 litres of deionised water with 8.29mg/L dissolved oxygen. There were 6mls of each nutrient reagent (phosphate buffer, magnesium sulphate, calcium chloride and ferric chloride) added to the dilution water, mixed and kept at 20 ℃. The rest of the dissolved oxygen demand protocol was evaluated based on the Interlabd Polyseed method [13], which refers to the standard method followed [14].
Visual water degradation
A 6cm2 of each bioplastic was placed into its netted bags and tied onto a pitchfork. The pitchfork was placed in a river with a large rock on each end, and the bags moved with the river’s flow. The samples were checked once a week for six weeks. Sample images were taken each time data was collected.
Statistical analysis
One-Way Analysis Of Variance (ANOVA) was employed for statistical analysis, and Tukey-Kramer analysis was applied as necessary. P≤0.05 was the significant threshold. Excel (Excel 2021, v.16.0) and SPSS Statistics (IBM SPSS Statistics 27.0.1 version, 2020) were utilised as the analysis software. Qiime system (Qiime 2 version) was used to analyse and create visual bioinformatics data from Novagene.
Results and Discussion
Pieces of plastics
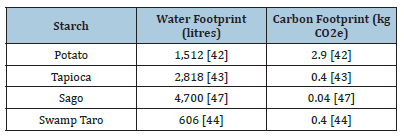
As in [9], four distinct bioplastics were produced using Potato, Tapioca, Sago, and Swamp Taro starches, Figure 2. Additionally, the production sustainability of each starch was examined (Table 1). Each starch was assessed on its sustainability based on the literature on the amount of carbon and water footprint needed to produce 1kg of the starch. The sustainability of each starch was accessed based on literature containing information about the carbon and water footprints to produce 1kg of the starch. From this, the Swamp Taro would be most sustainable as it has the lowest water and carbon footprints, whereas the potato has a relatively high value of both. While having the highest water footprint, Sago produced the lowest carbon footprint, possibly being a sustainable source if proper water management systems were used.
Figure 2:Bioplastics Potato (A), Tapioca (B), Sago (C), Swamp Taro (D).
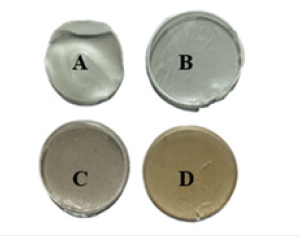
Table 1:Sustainability of the various starches based on literature.
Soil degradation
The soil degradation analysis was based on visual degradation, which looked at soil (type-clay loam), sand and compost. Visual analysis is the most widespread procedure used to examine bioplastic biodegradation in soil [15]. The results did not follow a standard method and (Figures 3A-3C) saw visual degradation for all samples after seven days and weight change. The soil degradation test shows that most degraded faster in the sand, followed by compost, which was closely followed by soil. Sago degraded the fastest overall of the bioplastics, while Tapioca took the longest to break down overall [3].
Figure 3A-C:Visual degradation of the bioplastics in different media. (A) Red=soil, (B) Yellow=sand, and (C) Compost=green. All over the course of 63 days in the months of March-April.
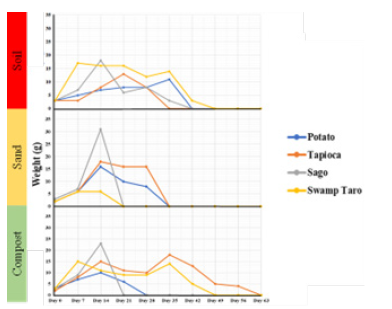
The potato bioplastics degraded quickly in compost and took an extra two weeks in the soil to break down. While tapioca bioplastic degraded equally as quickly in the soil as it did in the sand when collected on day 28. It took a further four weeks to degrade in compost. The Sago bioplastic degraded in the sand and compost equally on day 14. They were followed by the soil three weeks later. The bioplastic in the sand was very fragile and sticky to the touch and very difficult to be handheld. The Swamp Taro bioplastics degraded in the sand the quickest when collected on day 14 the other samples degraded on the same day, four weeks later, in compost and soil (Figure 3). The rate of breakdown and timing was very similar to findings by Ahimbisibwe et al. [16], based on Tapioca polymers.
Overall, environmental factors such as the weather were most likely a degradation factor, as seen in a study by Polman et al. [17]. For the SPBBs, it was noted that the plastic became sticky and more fragile on hot days. On days when there was much rain, while the bioplastic was delicate, it was not sticky; therefore, removing debris stuck to it was easier. Cleaning off the “soil” medium was difficult most days. The more the plastic degraded, the more soil, sand or especially compost was more challenging to remove without damaging the sample. The experiment’s main flaw was its visual degradation, making the samples increasingly challenging to locate by sight.
Oxitop soil degradation
In biodegradation assays, two methods are used by ASTM, ISO and the European Committee for Standardisation: Aerobic and anaerobic digestion. Biodegradable polymers are decomposed into environmentally sustainable materials through the action of certain microorganisms, e.g. carbon dioxide, methane, water, and inorganic elements such as sodium, potassium, phosphorus, calcium and biomass [18]. Based on this information, an aerobic biodegradation assay was used following a method by Mroczkowska, et al. [5].
Figure 4:Soil Oxitop degradation of bioplastics using chambers over a 99-day time frame.
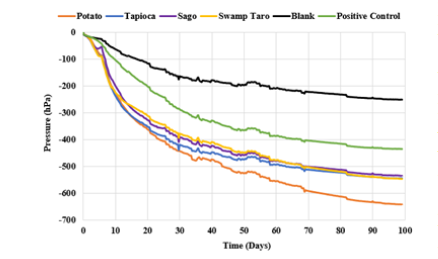
The Oxitop chambers show that the bioplastic is biodegradable as the decrease in pressure is caused by the production of CO2 from microbial activity. This system is suitable for monitoring soil biodegradation of organic compounds, such as bioplastics. From the work by Mroczkowska et al. [10], which uses similar bioplastics, it could be seen that the Potato SPBB degrades the fastest of the bioplastics. Tapioca, Sago and Swamp Taro appeared to degrade around the same rate; the information here backs up the data from the visual degradation that the bioplastic was biodegradable (Figure 4). These results are also seen in [19], where the biodegradability of starch-based bioplastics was said to be 14%. The biopolymers’ degradation rate could be increased by other factors such as rainfall, sunlight exposure, and erosion due to soil movement by different fauna.
Plant germination
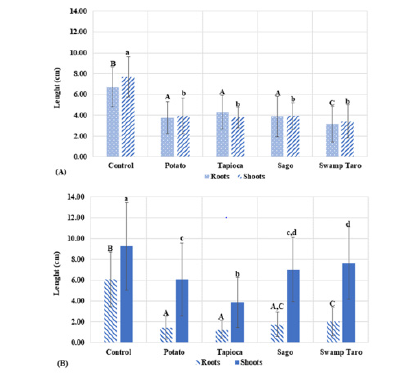
Another form of biodegradation assay used by ASTM, ISO and the European Committee for Standardisation uses plant and animal species such as mustard and worms; these are also used to measure ecotoxicity [18]. From (Figure 5A & 5B), it could be seen that the roots and shoots of both plants decreased with all the SPBBs compared to the control. Swamp Taro caused the slowest growth in the mustard, whereas the Tapioca SPBB caused the stunted growth in sorghum. Suppose the bioplastic were to be used extensively. In that case, the amounts utilised in the experiment have minimal possibility of occurring in the natural environment, but the potential for phytotoxicity cannot be completely ruled out. Because seeds need oxygen for germination, oxygen depletion brought on by bacteria that break down bioplastic in the soil may prevent seed germination. Because the bioplastic is hydrophilic by nature, it will draw moisture from the soil, lowering the amount of water accessible to the seeds and causing low germination. One of the bioplastic components, glycerol, has been demonstrated to have a phytotoxic effect on cocoa leaves by impairing plastid activity. Plant germination was utilised in a study by Sforzini et al. [20] to assess the ecotoxicity of bioplastic. On the germination of plants, bioplastic had no detrimental effects. Sforzini et al. [20] data only included the germination rate of roots; this study’s data included information on root and shoot length. Another potential factor that could affect the plants’ growth is the SPBBs’ effect on the microbial communities or possibly mycelium communities within the soil that might be competing with the plants for nutrients from the bioplastics or phytotoxic.
Figure 5:Phytotoxicity of bioplastics with different starches. The graph showed the root and shoot lengths of Mustard (A) and Sorghum (B), monocot and dicot plants, respectively. Values represent the mean of N=5±standard deviation. The different subscript letters represent the significance between means. Capital letters refer to significance in roots, and lower-case letters refer to significance in shoots (P<0.05).
Plant biomass
The biomass data of the mustard and sorghum plants showed that their germination was relatively poor compared to the control (Figure 6A & 6B), the % dry biomass. However, showed little significant difference to the control regarding root biomass. Only the Tapioca polymer was found to have a significantly different biomass for its roots compared to the others. Regarding the plants’ shoot biomasses for mustard, there was no significant difference between the control and Potato SPBB, whereas, in the sorghum results, only the Swamp Taro SPBB was significantly different from the control.
Figure 6:The graph shows the Mustard (A) and Sorghum (B) biomass, monocot and dicot plants, respectively. Values represent the mean of N=5±standard deviation. The different subscript letters represent the significance between means. Capital letters refer to significance in roots, and lower-case letters refer to significance in shoots (P<0.05).
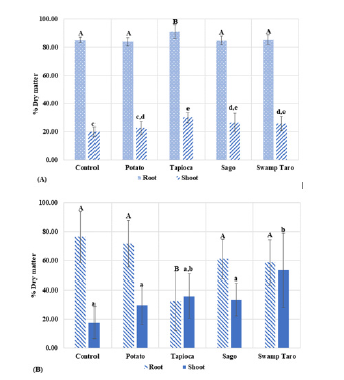
From these results, the roots did not grow down as far as the control but instead spread out wide due to the environmental stress of the bioplastics, as similarly seen in [21] where the enhanced biomass caused an increase in the root/shoot ratio to maintain vigorous root growth. It is also possible that the added nutrients from the polymers meant the plants’ roots did not need to grow down as far compared to the control.
Worm toxicity
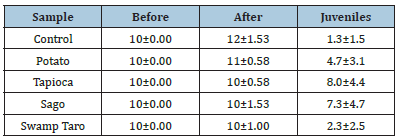
The worms’ mortality, morphology and number of juveniles produced were recorded following an OECD test on acute toxicity. There was no evident or obvious change in the worms’ morphology or behaviour after the exposure to the SPBBs. The population of adults collected did increase after the four weeks but not to a significant level, and the same was also found with the juveniles, (Table 2). Mortality of the worms over two months. Mortality of compost worms shows the number of juveniles produced. Values represent the mean of N=5±standard deviation. No levels of significance were found within the samples (P<0.05).
Table 2:Mortality of the worms over two months. Mortality of compost worms and shows the number of juveniles produced. Values represent the meaning of N=5±standard deviation. No levels of significance were found within the samples (P<0.05).
A biopolymer called Ecoflex®, a PLA bioplastic, was tested using this method by Siegenthaler et al. [22] who found that the polymer also has no toxic effect on the compost worms. In other studies, such as [16], Tapioca bioplastic was observed to be ingested by worms, indicating soil flora do not mind these polymers and, in fact, potentially treat them as a form of nutrients. It has been found in the literature that the presence of worms increased the root biomass [23], meaning that since the SPBBs do not harm the worms, the SPBB soil could have a possible positive effect on any flora growing in the SPBB contaminated soil.
Worm preference
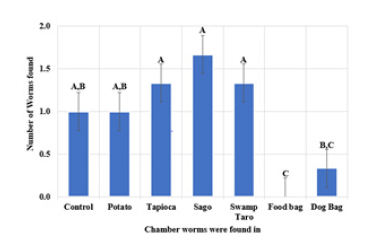
Following this, soil preference with different bioplastics, SPBBs and commercial were investigated. From the data gathered in the Figure 7, it was seen that the worms preferred most of the chambers with SPBBs rather than commercial bioplastics. It was noted that three worms could not be found and were presumed deceased. The SPBBs the worms appeared to have favoured were Sago, followed by Tapioca. To the best of our knowledge, this was the first study assessing earthworm preference of soil after degradation of biopolymers.
Figure 7:Worms movement from different chambers to preferred soil. Values represent the mean±std dev of N=7. The different subscript letters represent significant differences (P<0.05).
Soil microbiome
The following has been left as individual samples as one of the Potato SPBB samples failed the quality control, so this data was ignored. Also, the before and after samples refer to the time difference when they were taken; before was before any degradation occurred and after was the control sample after the 99 days. The samples were grouped as follows: Samples 1-3 were Before degradation of SPBBs, samples 4-6 were After degradation (control), samples 7-9 were Potato SPPB, samples 10-12 were Tapioca SPPB, samples 13-15 were Sago SPBB and samples 16-18 were the Swamp Taro SPBB.
Alpha diversity is applied to the analysis of microbial
community diversity within the sample by analysing the variety
of a single sample (Alpha diversity), which can reflect the richness
and diversity of microbial communities in each sample. Microbial
species can contribute multiple aspects to the plant system,
including essential functions such as
(i) Seed germination and growth support through the
provision of hormones.
(ii) Nutrient supply, e.g. by fixation of nitrogen and the
mobilisation of phosphorus and minerals such as iron.
(iii) Resistance against biotic stress factors (pathogen and
parasite defence).
(iv) Resistance against abiotic factors.
(v) Physiology and production of bioactive metabolites [24].
Six main phylum bacterial communities appeared to have been affected by the SPBBs: Proteobacteria, Firmicutes, Actinobacteriota, Acidobacteriota, Bacteroidota and Gammatimonadota, (Figure 8). Of these, the Firmicutes appeared to increase greatly with the SPBBs. Firmicutes contain species observed in phosphate solubilisation and plant growth promotion [25]. They are also recorded to establish symbiosis with the plant [26], and species such as Streptococcus, Bacillus sp, Bacillus licheniformis and Staphylococcus are thermoplastic starch-based bioplastic degrading bacteria [17].
Figure 8:Relative abundance of bacterial colonies from the soil samples in triplicate. All of them were n=3 except for potato, which was n=2.
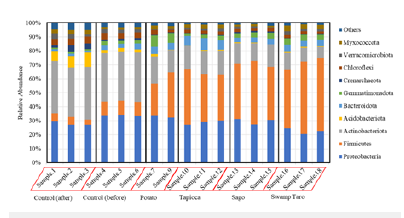
Proteobacteria were seen to decrease in their relative abundance; changes in these bacteria’s population are mostly attributed to the status of nutrients available in the soil. It was reported that diverse fertiliser amendments can alter soil proteobacteria, such as decreasing the relative abundance of proteobacteria [27]. It was also found in the literature by Polman et al. [17] that species of Pseudomonas and Moraxella are thermoplastic starch-based bioplastic degraders. Actinobacteriota helps decompose dead organisms’ organic matter so plants can take the molecules up anew. Some soil actinomycetes live symbiotically with the plants whose roots pervade the soil, fixing nitrogen for the plants in exchange for access to some of the plant’s saccharides. These improve the availability of nutrients and minerals, synthesise plant growth regulators, and can especially inhibit phytopathogens [28]. Some species, such as many members of the genus Mycobacterium, are important pathogens. Streptomyces plicatus has been shown to inhibit spore germination and spore tube growth in F. oxysporum, Alternaria alternata, Verticillum albo-atrum, and other pathogenic fungi [29]. Therefore, decreasing this phylum leaves the plants vulnerable to potential pathogenic fungi. Acidobacteria’s relative abundance dropped, which could lead to issues with the plant’s nitrogen cycling. There have been observations by Kalam et al. [30] of plant growth promotion interactions between three acidobacterial strains belonging to the genera Granulicella and Acidicapsa and the host plant Arabidopsis thaliana. There was a significant increase in root growth parameters, although shoot biomass variations were non-significant compared to the controls.
Bacteroidota’s relative abundance appeared to increase with the bioplastics. These bacteria are essential and dominant carbohydrate degraders in two very different environments: the soil and the human gut [31]. This increase in phylum communities is most likely due to the starch in the SPBBs. In terms of soil, the genus Flavobacterium’s presence may indicate good-quality agricultural soils. Several Flavobacteria from roots and soil have been found to antagonise various plant pathogens in different crops. Recently, bacterial network analysis has shown that Flavobacterium representatives are also potential agents of pathogen suppression in root ecosystems. Furthermore, selected bacteria from this genus have been classified as Plant-Growth-Promoting Rhizobacteria (PGPR) of various crops [31]. Gammatimonadota was also seen to increase alpha diversity; however, little is known about this bacteria’s metabolism and, thus, their environmental role. They usually form only a tiny fraction of the bacterial community, with relative abundances at around 1% [32].
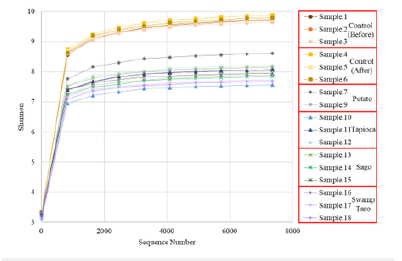
It is calculated by considering the total taxa in the sample (Richness) and the proportion of each taxon (Abundance). An increase in the Shannon Index means there is an increase in the diversity of species. The higher the community diversity and the more evenly distributed the species, the higher the Shannon Index. However, there was no significant difference in the Shannon index between the control soils before and after degradation from the (Figure 9), it was seen that the microbiome diversity significantly decreased with the introduction of the SPBBs. Beta-diversity refers to the dissimilarity of species composition between different communities along an environmental gradient or the rate of species turnover along an ecological gradient, also known as interecological diversity.
Figure 9:Represents the Shannon index of the individual bioplastic samples analyzed. All of them were n=3 except for potato, which was n=2.
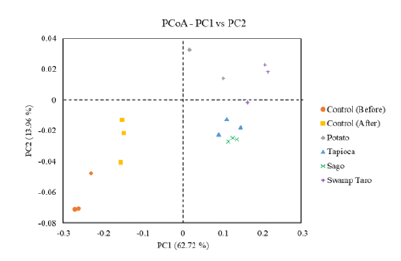
Principal Coordinates Analysis (PCoA) is an ordination technique which picks up the principal elements and structures from reduced multi-dimensional data series of eigenvalues and eigenvectors. The method has the advantage over PCA in that each ecological distance can be investigated. Weighted Unifrac and Unweighted Unifrac are calculated to assist the PCoA analysis. Weighted considers the abundance of information on OTUs in the sample when calculating the distance between community samples. Any alteration to soil variety can affect how well the soil ecosystem’s decomposition and nutrient cycling processes occur. Unsurprisingly, a type of bacteria might employ the SPBBs as growth substrates since they hold a lot of potential nutrients for rapid growth in bacterial communities (Figure 10). A paper by Mroczkowska et al. [5] found that a considerable change in bacterial groups results from fastgrowing bacteria, which the SPBBs seem to favour, pushing out slower-growing bacteria from niches competing for resources that can limit growth. It is believed that these brief disruptions in the community structure eventually return to how things were before the nutrient was introduced, according to Mroczkowska et al. [10].
Figure 10:Displays the weighted UNIFRAC PCoA results. All of them were n=3 except for potato, which was n=2.
Marine toxicity
Microalgae are frequently utilised as signs of pollution in the environment. Both freshwater and saltwater environments contain them, and they serve as the principal producers at the bottom of the food chain. Any changes to the microalgae population can impact the whole ecology [5]. The control showed very little growth until the third day, (Table 3A), where the algae cell numbers increased and continued to do so for nine days. The bioplastics had increased algae growth compared to the control, but potato and taro were lower than the control on day 6. The only bioplastic lower than the control after nine days was the potato SPBB. Both sago and tapioca began to decrease after the sixth day, meaning the cells probably had reached the death phase as the nutrients from the bioplastic were used up; they were also the two bioplastics with the fastest increase in algae cell growth. Table 3B, Taro remained very close in algae cell numbers to the control until day 6. The control line can be seen right beside the potato value, which overlaps entirely with the sago bioplastic on the ninth day. Like the 10mg/L figure, the potato bioplastic was lower than the control in the end; similarly, the sago samples decreased after six days, while the tapioca sample continued to increase algae cell numbers.
Table 3:The toxicity of each bioplastic at different concentrations on algae cell numbers over nine days. Values represent the mean of N=5±standard deviation. The different subscript letters represent different significant levels (P<0.05).
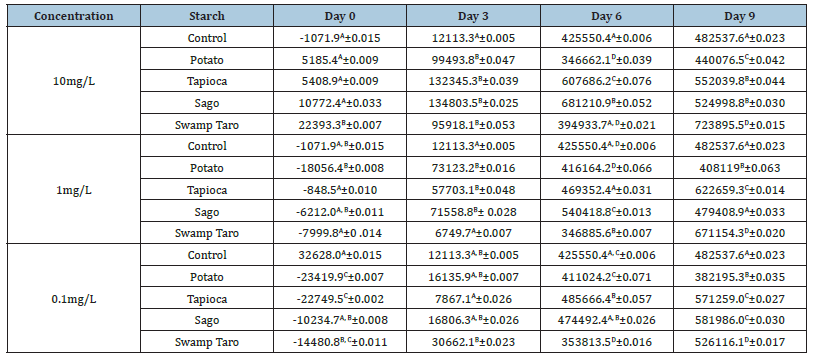
The bioplastic samples in the (Table 3C) all started with slightly lower numbers than the control but overlapped on the third day. Following the trend of the previous two figures, sago and tapioca had the highest algae values but did not reach the death phase this time. Potato was, again, lower than the control, but interestingly, it had reached the death phase at the 0.1mg/L concentration. This time, the control was closest to the taro bioplastic. A study by Sforzini et al. [20] examined the ecotoxicity of bioplastics (Mater-Bi; a family of plastics made from materials like starches, cellulose, and vegetable oils), and similarly to this study, chosen organisms like microalgae were used to assess potential ecotoxicity. The current investigation results concur with those of [20], who observed no adverse effects of their bioplastic on microalgae.
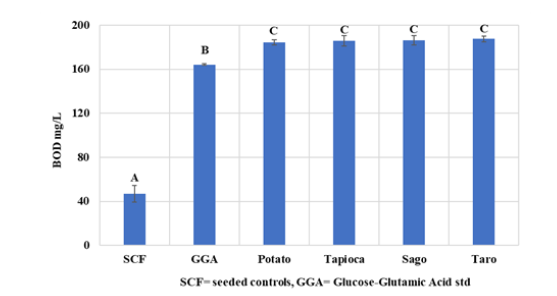
The amount of bioplastic employed in this test, shown in Figure 11, was at an extremely high concentration that would be challenging to locate in the natural world. The GGA, which contained glucose as a nutrition supply, dramatically increased the polyseed inoculum. Even though there was no statistically significant difference between the SPBBs, they produced high BOD, which might lead to problems like lower oxygen availability for aquatic life at higher levels. However, it is vital to remember that organic sources, which result in a rise in BOD, include leaves and woody debris, which can cause significant problems in the marine environment [33]. A study by Phosri et al. [34] discovered that the ester linkages of biodegradable polymers are hydrolysed by scissoring, which starts the biodegradation pathway of biopolymers. Then, bacteria begin the colonisation process for the biodegradation of bioactive substances; as a result, the oxygen utilised by bioactive consumption in the water would rise during biodegradation due to microbial processing. Dilkes-Hoffman et al. [35] who did a metaevaluation on bioplastics PHA degradation, found that dissolved oxygen demand was recorded but not considered a controlling factor in any of the papers looked into. Therefore, it is essential to further our understanding of how biopolymers impact marine habitats.
Figure 11:The biological oxygen demand of the biopolymers averages in the ‘dilution water’ following the standard method. SCF=seeded controls average GGA=glucose–glutamic acid standard average. Values represent the meaning of N=6±standard deviation. The different subscript letter represents different significance (P<0.05).
Water degradation
The river water’s chemical composition was found in the EPA’s database. The water degradation provided a real-life insight into the visual degradation of the SPBBs. The commercial bioplastics used showed no visible degradation and were left out of the Figure 12.
Figure 12:Water degradation of bioplastics with different starches. The graph showed the first day from when the bioplastics started to show signs of ripping to when they could no longer be found in their respective bag. Values represent the mean of N=4±standard deviation. The different subscript letters represent different significance (P<0.05).
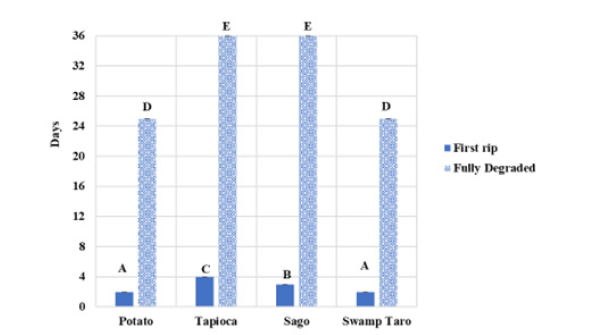
The water degradation data showed that all the bioplastics showed initial signs of physical degradation from day 2 to day 6, whereas the commercial bioplastics used never showed any degradation (Figure 12). The commercial bioplastics used to compare the currently available remained intact throughout this process. The total average complete degradation for all the SPBBs was 25-36 days, with potato and swamp taro degrading the fastest. Sago and tapioca took the longest to degrade at 36 days fully. Sago took the longest of the bioplastics to degrade from when its first rip was recorded fully. These results would best be considered an estimation of degradation for the SPBBs, as there would have been uncontrollable variables. However, starch-based bentonite bioplastics by Arunachalam et al. [36] took 20-25 days for complete degradation in water, which were similar results to this study. From water degradation results, the amount of time in water exposure, time of year and water temperature could affect the degradation of the bioplastics; similar findings were reported by Ahsan et al. [19]. Bioplastic-degrading bacteria such as Pseudomonas, Bacillus, Alvanivorax, Tenacibaculum, Lepthotrix, Enterobacter, Variovorax and Gracilibacillus species were isolated from marine environments as reported in several studies according to Mehdi Emadian et al. [37], which is another probable cause for the SPBBs rapid degradation in the water.
Conclusion
In conclusion, statistical analysis revealed variations in the environmental impact of different types of bioplastics produced across most of the tested assays. The variations depended on the kind of starch utilised in the formulation. Other starches might be better suited depending on the ideal environmental properties of the finished product [38-40].
The abiotic results of the SPBBs through the degradation test, Oxitop degradation, and visual disintegration in river water, soil, sand and compost confirm that the polymers have biodegradable properties. Swamp taro is one of the quickest at physically degrading during the water degradation test and degraded swiftly in the soil degradation assay. The biotic experiments revealed a thorough analysis of the polymers with significant differences throughout the data gathered. Regarding plant germination, plants’ roots and shoot growths were relatively poor. However, it is also important to remember that a high level of SPBBs was used, a more significant amount than estimated to accumulate in one area. The biomass percentage from the plants demonstrated that while the growth appeared, from a germination point, to be relatively poor when looking at the amount of biomass, the bioplastics do not seem to have had a severe negative effect but instead caused an environmental stress factor which does not wholly hinder their development-with the soil microbiome at the phylum level firmicutes increased after the degradation of all bioplastics, mainly containing starch-degrading species. Actinobacteria decreased in bioplastic-degraded soil, where smaller bacterial populations declined in favour of the Bacteroidota and Gemmationadota communities [41-47]. Overall, according to the Shannon index, the diversity decreased with the introduction of degrading bioplastics.
For that reason, even though this is believed to be only temporary, it would be important to assess, in future work, if the microbial communities would regain their original diversity levels after a period of time. For the ecotoxic effects on worm population, reproduction and preference, there was no ecotoxic effect as there was no difference between worm mortality and reproduction, and they appear to prefer soil containing the polymers. Regarding marine toxicity, the bioplastics were similar to the control except for tapioca bioplastic, which produced high algae cell numbers across the concentrations, particularly at 10mg/L, compared to the control. Sago also led to high algae numbers at 10mg/L, but when it entered the death phase, the levels were similar to the control. In summary it is possible to conclude that the use of different starches in the formation of biopolymers can have an influence in some environmental parameters, from their sustainability to the degradation time making it an important ingredient in the formulation of the SPBBs.
Funding
This research was funded by the South East Technological University President Award Fellowship grant.
References
- Rosenboom JG, Langer R, Traverso G (2022) Bioplastics for a circular economy. Nature Reviews Materials 7(2): 117-137.
- Parker L (2021) Planet or Plastic? Here's how much plastic trash is littering. The Earth. National Geographic.
- DECC (2021) Climate Action Plan 2021.
- Maulida Siagian M Tarigan P (2016) Production of Starch-based bioplastic from cassava peel reinforced with microcrystalline cellulose avicel PH101 using sorbitol as plasticizer. Iopscience 710(1): 012012.
- Mroczkowska M, Culliton D, Germaine KJ, Neves A (2021) Comparison of mechanical and physicochemical characteristics of potato starch and gelatine blend bioplastics made with gelatines from different sources. Clean technologies 3(2): 424-436.
- European Bioplastics.
- Jiménez-Rosado M, Bouroudian E, Perez-Puyana V, Guerrero A, Romero A (2020) Evaluation of different strengthening methods in the mechanical and functional properties of soy protein-based bioplastics. Journal of Cleaner Production 262: 121517.
- Perera KY, Jaiswal AK, Jaiswal S (2023) Biopolymer-based sustainable food packaging materials: Challenges, solutions, and applications. MDPI 12(12): 2422.
- Stanley J, Culliton D, Jovani-Sancho AJ, Neves CA (2022) Mechanical properties of starch-protein blend bioplastics.
- Mroczkowska M, Germaine KJ, Culliton D, Duarte TK, Neves AC (2021) Assessment of biodegradation and eco-toxic properties of novel starch and gelatine blend bioplastics. Recycling 6(4): 81.
- Neves AC, Ming T, Mroczkowska M, Culliton D (2020) The Effect of different starches in the environmental and mechanical properties of starch blended bioplastics. ASTES 5(6): 550-554.
- Franks C, Goings K (Above-Ground Biomass (Plant) Determinations. Natural Resources Construction Service.
- Polyseed (2023) Application Procedures - Polyseed.
- Baird R, Eaton AD, Rice EW, Bridgewater L (2017) American Water Works Association, & Water Environment Federation Standard methods for the examination of water and wastewater. (23rd edn), Washington, DC: American Public Health Association, Washington, USA.
- Pooja N, Chakraborty I, Rahman MH, Mazumder N (2023) an insight on sources and biodegradation of bioplastics: a review. Semantic Scholar 13: 1-22.
- Ahimbisibwe M, Banadda N, Seay J, Nabuuma B, Atwijukire E, et al. (2019) Influence of weather and purity of plasticizer on degradation of cassava starch bioplastics in natural environmental conditions. Mendeley 8(4): 237-250.
- Polman E M, Gruter GJ, Parsons JR, Tietema A (2020) Comparison of the aerobic biodegradation of biopolymers and the corresponding bioplastics: a review. Science of the Total Environment 753: 141953.
- Encalada K, Belén M, Proaño E, Valle V (2018) An overview of starch-based biopolymers and their biodegradability. Ciencia Ingenieriav 39(3): 245-258.
- Ahsan WA, Hussain A, Lin C, Nguyen MK (2023) Biodegradation of different types of bioplastics through composting-A recent trend in green recycling. MDPI 13(2):294.
- Sforzini S, Oliveri L, Chinaglia S, Viarengo A (2016) Application of biotests for the determination of soil ecotoxicity after exposure to biodegradable plastics. Front Environ Sci 4: 68.
- Zhang H, Ullah F, Ahmad R, Ali Shah S, Khan A, et al. (2022) Response of soil proteobacteria to biochar amendment in sustainable agriculture- A mini review. Journal of Soil, Plant and Environment 1(2): 16-30.
- Siegenthaler K, Künkel A, Skupin G, Yamamoto M (2011) Ecoflex® and ecovio®: Biodegradable, performance-enabling plastics. Synthetic Biodegradable Polymers 245: 91-136.
- Liwarska-Bizukojc E (2021) Effect of (bio)plastics on soil environment: A review. Science of the Total Environment 795: 148889.
- Berg G, Köberl M, Rybakova D, Müller H, Grosch R, et al. (2017) Plant microbial diversity is suggested as the key to future biocontrol and health trends. FEMS Microbiology Ecology 93(5).
- Hegyi A, Nguyen TBK, Posta K (2021) Metagenomic analysis of bacterial communities in agricultural soils from Vietnam with special attention to phosphate solubilizing bacteria. Microorganisms 9(9): 1796.
- Yurgel SN, Ajeethan N, Smertenko A (2022) Response of plant-associated microbiome to plant root colonization by exogenous bacterial endophyte in perennial crops. Frontiers.
- Zhang Z, Cui Q, Chen L, Zhu X, Zhao S, et al. (2022) A critical review of microplastics in the soil-plant system: Distribution, uptake, phytotoxicity and prevention. Journal of Hazardous Materials 424(Pt D): 127750.
- Asma AA, Haq S, Bhat RA (2017) Actinomycetes' benefaction role in soil and plant health. Science Direct 111: 456-467.
- Debananda NS, Suchitra S, Tamreihao K, Nimaichand S (2009) Antagonistic activities of local actinomycete isolates against rice fungal pathogens. African Journal of Microbiology Research 3(11): 737-742.
- Kalam S, Basu A, Ahmad I, Sayyed RZ, El-Enshasy HA, (2020) Recent understanding of soil acido bacteria and their ecological significance: a critical review. Frontiers in Microbiology 11: 580024.
- Kruczyńska A, Kuźniar A, Podlewski J, Słomczewski A, Grządziel J, et al. (2023) Bacteroidota structure in the face of varying agricultural practices as an important indicator of soil quality-A culture-independent approach. Agriculture, Ecosystems & Environment 342: 108252.
- Mujakić I, Piwosz K, Koblížek M (2022) Phylum gemmatimonadota and its role in the environment. NCBI 10(1): 151.
- US EPA (n.d.) 5.2 Dissolved oxygen and biochemical oxygen demand. Monitoring & Assessment, US EPA.
- Phosri S, Kunjiek T, Mukkhakang C, Suebthep S, Sinsup W, et al. (2022) Biodegradability of bioplastic blown film in a marine environment. Frontiers in Marine Science 9.
- Dilkes-Hoffman L, Lant P, Laycock B, Pratt S (2019) The rate of biodegradation of PHA bioplastics in the marine environment: A meta-study. Marine Pollution Bulletin 142: 15-24.
- Arunachalam T, Monalisha M, Lopamudra B (2021) Intensification of yam-starch-based biodegradable bioplastic film with bentonite for food packaging application. Environmental Technology & Innovation 25:102180.
- Mehdi Emadian S, Onay TT, Demirel B (2016) Biodegradation of bioplastics in natural environments. Waste Management 59: 526-536.
- Abe M, Accinelli C, Ahn HK, Arcos-Hernandez MV, Arrieta MP (2017) Biodegradation of bioplastics in natural environments. Waste Management 59: 526-536.
- Begmatov S, Beletsky AV, Dedysh SN, Mardanov AV, Ravin NV (2022) Genome analysis of the candidate phylum MBNT15 bacterium from a boreal peatland predicted its respiratory versatility and dissimilatory iron metabolism. Frontiers in Microbiology 13: 951761.
- Daims H, Wagner M. (2018) Nitrospira. Trends in Microbiology 26(5): 462-463.
- Liu X, Du F, Chen S, Li N, Cui J, et al. (2022). Increased diversity of rhizosphere bacterial community confers adaptability to coastal environment for sapium sebiferum trees. Forests 13(5): 667.
- Marie A (2022) Potato starch benefits+side effects. HEALabel.
- Marie A (2023a) Tapioca benefits, side effects: Vegan, low Fodmap, gluten free? HEALabel.
- Marie A (2023b) Taro root benefits and side effects: Vegan, gluten free, caffeine? HEALabel.
- Ten Brink F, Schoepp-Cothenet B, Van Lis R, Nitschke W, Baymann F (2013) Multiple rieske/cytb complexes in a single organism. Biochimica et Biophysica Acta (BBA)-Bioenergetics 1827(11-12): 1392-1406.
- Yang Y, Jun L, Tao-Tao Y, Shao-Ming G, Bin L, et al. (2021) Genomic insights into the ecological role and evolution of a novel thermoplasmata order, ‘candidatus sysuiplasmatales’. Applied and Environmental Microbiology 87(22): e0106521.
- Yusuf M, Romli M, Suprihatin S, Wiloso EI (2019) Carbon footprint of semi-mechanical sago starch production. Journal of Ecological Engineering 20(11): 159-166.
© 2023 Neves Adriana Cunha. This is an open access article distributed under the terms of the Creative Commons Attribution License , which permits unrestricted use, distribution, and build upon your work non-commercially.
 a Creative Commons Attribution 4.0 International License. Based on a work at www.crimsonpublishers.com.
Best viewed in


.jpg)


 Editorial Board Registrations
 Submit your Article
 Refer a Friend
 Advertise With Us
.jpg)


.jpg)


.bmp)
.jpg)
.png)
.jpg)


.jpg)


.png)

.png)


.png)


