
- About Us
- Information
-

The Author ensures that the research has been conducted responsibly and ethically with adherence to all relevant regulations. read more..
- For Authors
- For Reviewer
- Manuscript Guidelines
- Membership
- Publication Ethics
-
- Journals
- Reprints
- e-Books
- Videos
- Policies
- Contact Us
 COVID-19
- Submissions


Full Text
Polymer Science: Peer Review Journal
Nanofiltration Based Comparative Study of Two Flux Enhancement Techniques in a 160-Reactive Yellow Dye Solution
Jigesh Mehta*
Department of Chemical Engineering, India
*Corresponding author: Jigesh Mehta, Department of Chemical Engineering, India
Submission: December 06, 2018;Published: January 03, 2019

ISSN: 2770-6613 Volume1 Issue1
Abstract
Reduction in Permeate flux with the period of time is the major drawback for the Pressure-driven membrane processes. Concentration polarization and membrane fouling are the two major limitations for the Pressure-driven membrane filtration processes. They lead to the severe flux decline and that need to be controlled for the better process efficiency. The resistance determination provides basis for selection of membrane and appropriate pressure -driven separation process. This paper outlines a new approach for the flux enhancement by investigating the two techniques namely flow reversal and pressure pulsation. Resistance -in-series model was applied to quantify and describes the co-relation of the resistances taking into account the membrane hydraulic resistance as a base factor. It is also observed that membrane permeability decreases rapidly due to pore blocking and further declination of the flux is due to graduation accumulation of the foulant over the membrane surface. It is observed that membrane hydraulic resistance, Rm remained constant during the whole experiments while there is a reduction of concentration polarization (CP) resistance, Rcp in case of frequent flow reversal i.e from 52.08 to 35.50%. However, in pressure pulsation technique not much flux variation was found during pressure pulse at different intervals.
Keywords:Nanofiltration; Flux; Resistance-in-series model; Flow reversal; Pressure pulsation
Introduction
Membrane separation technology is a novel and highly innovative process engineering operation. Flux decline with time is the major problem in NF [1]. The reduction can be divided into two separate parts: First, concentration polarization is a natural consequence of the selectivity of a membrane. As filtration proceeds, solute particles accumulate over the septum, forming a polarized layer which grows in thickness leading to CP. Second, there is fouling, that is to say a buildup of material on the membrane surface. The use of various types of dyes has been increasing continuously in the industries and the effluent coming out from these industries contain toxic dyes, which causes environmental problems. So, treatment of the color waste is required before its disposal. Present study reveals the variation of flux decline with the filtration time and the effect of operating pressure. The total resistance comprises of intrinsic membrane, solute adsorption, pore blocking and concentration polarization or cake layer formation resistance. The study relates the variation of these resistances with different TMP using 100ppm Reactive yellow dye solution by applying two different flux enhancement techniques. An effort had been made to evaluate these resistances independently at different operating tissme point by performing independent experiments. Finally, correlations were proposed for each of these resistances and corresponding flux decline was calculated.
Experimental
Chemicals and membranes used
Table 1:

Synthetic solution of 160 Reactive Yellow Dye (M.W. 818.13Da) was prepared in the laboratory by dissolving dye in distilled water. Hydrophilized polyamide (HFT -150) membrane with Molecular weight cut off (MWCA) 150Da and of thickness 7micron was used in the study. It is a composite membrane element consisting of a non-woven polyester substrate on which a polyether sulfone layer is coated. The effective membrane area was 0.016m2. The effective average pore size of used membrane is 6±1nm (Table 1).
Experimental setup
The experimental setup consists of a cross flow nanofiltration unit with flat sheet membrane module. The test cell, made of stainless steel (dimension: 225 x 150 x 50mm3) and inner dimension of the test cell was 160mm x 100mm x 2mm. The pilot plant assembly was equipped with Variable frequency drive (VFD) for flow control, inlet and outlet pressure gauge and high-pressure switch (HPS). Feed solution from the feed tank was pressurized by high pressure plunger pump (50-400psi) and introduced into the test cell. Reject stream was collected and recycled to the feed tank through the rotameter. The permeate stream was also recycled in the feed tank to maintain a constant concentration since feed volume was kept constant (25litres) throughout the experiment.
While investigating the pressure pulsation technique, the experimental set up arrangement has been changed. Pulsating the compressed air at different frequency of time internal (after 1min) may alleviate the quantity of more solvent in the permeate section and can increase the flux of the system. With this assumption, the technique is applied to the existing system with some modifications. The basic fundamental here is to inject the compressed air to the upper layer of the membrane surface along with the running solute filtration but at different injection point. The injection point for the air to the system and solute feed inlet must be different. The compressor is being attached for the generation of air and connected in line with the buffer tank which provides the adequate amount of pressurized air. For the definite frequency injection of the air to the system, the automatic relay timer is connected so that proper inject of the air can be given at specific time interval. The experiments were performed at 3KPa pressure from the buffer tank and at different pressure from the system.
Determination of various resistances
The flux decline will be different for each individual resistance offered. For the given reactive dye solution, some of the particles may adsorbed on the membrane surface because of the solutemembrane interaction. Solutes having relatively small particles size compared to pores of the membrane, then particles may go inside the membrane pores and get adsorbed on the inside surface of the membrane. When the further process goes on, there will be gradual accumulation of the solute particles on the membrane surface which leads to the cake layer formation or concentration polarization layer.
According to Darcy’s law, the resistance-in-series model can be written as: -
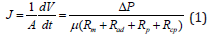
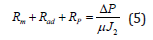
Where, J is the permeate flux (Lm-2h-1), A is effective area of membrane (m2), Rm the membrane resistance (m-1), Rad the adsorption resistance (m-1), Rp the pore blocking resistance (m1), Rcp the cake layer resistance (m-1), P is the TMP (bar), μ is the viscosity of solution (bar hr).
Membrane resistance
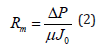
The membrane was subjected to the filtration unit under different pressures of (294, 490 and 686) KPa using distilled water. The permeate flux was calculated and plotted against the operating pressure which nearly turns out to be straight line through the origin. The slope of this straight line was the membrane permeability (J0). The membrane resistance was calculated from the permeability as
Adsorption resistance
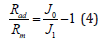
The 100ppm Reactive yellow 160 dye solution was prepared and charged in the membrane cell without applying any pressure for three different time durations, namely 15, 30 and 60min respectively. After every particular time interval, the cell was dismantled, and membrane was rinsed by distilled water so that the loosely bounded particles were washed off from the membrane surface. With the same membrane, experiments were carried out using distilled water at different pressures by application of flow reversal condition and permeate flux valves were noted down. Pressure pulse of air at different frequency of time intervals were injected with the help of buffer tank and compressor. The pressure kept in the buffer tank was 3Kpa. The resistance of the membrane was calculated using below equations as:
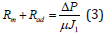
Combination of equation (2) and (3) gives the following result
Pore blockage resistance
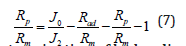
Using a clean membrane, NF experiment were conducted with the 100ppm Reactive yellow dye solution at various operating pressures for three different time durations, namely 15, 30 and 60min. For example, experiments were conducted at 294KPa pressure using dye solution for 15min. During this 15min of operation, the flux decline profile was noted down by measuring the cumulative weight of the permeate. J2 was the permeate flux value at the end of 15min. J2 can be expressed as
Then, the cell was dismantled, and membrane was taken out. The membrane was rinsed with distilled water thoroughly so that any deposition on the membrane surface was washed off. With this rinsed membrane, flow reversal technique was performed at the same operating pressure, i.e. 294KPa and similarly, pressure pulse at different frequencies were applied to check the permeate flux. The calculated valve of Rp/Rm will help to obtain the respective by following equation: -
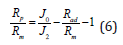
Using equation (6), similar procedure was followed for other duration of time to calculate the. After calculating valves of pore blocking resistance at different pressure, the kinetic curve of Rp/Rm different pressure were plotted.
Concentration polarization resistance
After the membrane pores have been blocked, further deposition of particles on the membrane surface will form a cake layer. The cake layer is a constant layer of retained particles packed at maximum density on the membrane surface [2]. Cake formation creates an additional resistance layer to the permeate flow. The flux decreases as the thickness of the cake layer increases with time. NF processes 100ppm Reactive yellow dye solution run for 120min at different TMPs by performing both the techniques. Since the kinetics of Rad/Rm and Rp/Rm was obtained already, the cake layer resistance can be calculated by:
Determination of hydraulic permeability
Hydraulic permeability is checked initially with distilled water to make basis for the further permeability calculation. Permeability is calculated at different pressures at some interval of time and the slope of the permeate flux vs. pressure plot gives the membrane hydraulic permeability. After completion of run, the membrane was washed by distilled water for 15min. The average values of membrane permeability were measured to be 2.44 x 10⁻¹¹m3/m2sPa, which remains almost constant between two successive runs.
Result and Discussion
Flow reversal technique
This section will describe the growth of various resistances and their relationship with the operating pressure [3]. The growth of the membrane resistances (Rm)with respect to time is determined at different pressure and it is observed that membrane resistance remains nearly steady (constant) with time at different pressures [4]. If we compare the case of Flow Reversal (5min F.F and 1min R.F) with that of the Feed Forward (F.F), it is cited from the Figure 1 that the gain in flux with flow reversal is significant. It is observed that Rcp/Rm grows rapidly while performing the experiments at feed forward system (unidirectional) remains almost invariant throughout the operation. The % reduction in Rcp/Rm is from 56.45 to 38.50 % in case of unidirectional flow while calculated based on Reverse flow condition (5min F.F and 1min R.F), the % reduction is from 52.08 to 35.50%. Thus, it indicates that periodic reversal of flow d creases the effects of concentration polarization and membrane fouling that causes the initial permeate flux decline.
The profile of forward flow and flow reversal CP resistance with pressure is shown in Figure 1. As the NF operation progresses over time and solute molecules gets retained by the membrane, the backpressure instability by periodic flow reversal severely stops that adsorption. Hence, the collection of solute molecules at the membrane surface is significantly reduced and results in enhanced permeate flux with the use of periodic flow reversal of the feed solution The Rcp with flow reversal condition gives definite decrease in the resistance compared to the Rcp with unidirectional flow (Figure 1).
Figure 1:% Growth of Rcp/Rm at operating pressure 294-686Kpa for Feed Forward (F.F) and Flow Reversal (R.F) conditions.

Pressure pulsation technique
Pressure Pulsation technique is applied to provide immediate pressure on the membrane surface at some interval of the time with purging of the compressed air to enhance permeability of the system. Experiments were conducted with the initial flux calculated at the normal flow unidirectional system to be the basis for the further process. The feed was passed to the system with a frequency of pressure pulsation at a time interval of 1min. The results were compared and shown in the Figure 2. It appears that while applying the technique, there was no accountable change found in the resistance offered. The % resistance reduction in Rcp/Rm is from 54.71 to 39.48 % during the operation and remained almost similar in case of unidirectional flow condition i.e. from 54.18 to 39.08 %. Thus, it is observed that instead of reduction in Rcp/Rm, no major change found in the Rcp resistance. The investigation says that there must be two phase flow layers accumulated due to the compressed air slug formed on the upper surface of the membrane. The mixture of air and feed solution forms the air water bubbling over creating additional resistance to the membrane surface which adhere the flow as well as pressure applied to the system. So, Rcp with pulse of pressure does not provide satisfactory decrease in the resistance compared to the Rcp without pressure (Figure 2).
Figure 2:% Growth of Rcp/Rm at operating pressure 294-686Kpa for with and without pressure pulsation.

Comparison of both techniques
Figure 3:Comparison of Rcp with Flow reversal and with pressure pulsation at frequency of 1min, with time at operating pressure 294-686Kpa.

Figure 4:Comparison of Flux with unidirectional (F.F), Flow reversal (F.R) and with pressure pulsation at frequency of 1min, with time at operating pressure 294-686Kpa. FF: Forward Flow; FR: Flow Reversal

While comparing both the techniques, Flow reversal as well as Pressure pulsation, the comparison has shown some precise worthy results. The CP resistance offered by the NF system while applying both the techniques are shown in the Figure 3. It is cited from the graph that resistances offered by the system run at pressure pulsation at frequency of 1 min each provide more resistance compared to the system with flow reversal. It is observed from the experiment that the resistance offer will be comparatively more in case of the pressure pulsation. While checking the performance of unidirectional forward flow, flow reversal and pressure pulsation, it is observed that reversing the direction of the flow removes the accumulated particles from the membrane surface or open up the pores leading to the enhancement of the permeate. From the Figure 4, it is observed that the there is no much reduction cited in case of Flow reversal (F.R) while comparing with the pressure pulsation technique (Figure 3 & 4).
Conclusion
Concentration polarization and membrane fouling are the major challenges for the flux decline in the membrane separation processes and thus, various flux enhancement techniques are implemented to reduce CP during the NF operation. In the present work, resistances offered during NF mechanism separation were calculated with forward (unidirectional) flow, frequent flow reversal (FR) conditions (5min F.F and 1min F.R) and pressure pulsation at frequency of 1min at different transmembrane pressure. The resistances offered includes irreversible (membrane, adsorption resistance and pore blocking) and reversible (concentration polarization layer) resistance. The concept of periodic flow reversal and pressure pulsation in cross flow NF operation for flux enhancement was also investigated in a laboratory scale. The results suggest that by flow reversal, CP is reduced hence, significant enhancement of flux is possible while Pulsing at different frequency of time does not provide ultimate permeate flux enhancement compared to the flow reversal method. The comparison of both the techniques were also taken into consideration keeping Unidirectional permeate flux as base and found that Flow reversal technique are pioneer for providing better flux enhancement and can mitigate the problem of fouling and CP while pressure pulsation provides equivalent flux as found in base.
References
- Nath K (2011) Membrane separation process. PHI learning Pvt Ltd, New Delhi, India, p. 360.
- Zhang W, Luo J, Ding L, Jaffrin MY (2015) A review on flux decline control strategies in pressure-driven membrane processes. Industrial & Engineering Chemistry Research 54(11): 2843-2861
- Ostadfar, Rawicz A (2015) Effects of pulsatile flow and backwashing on plasma flow rate in an implantable plasmapheresis. I. Theory and Principle. Biomedical Engineering 49(1): 29-32.
- Ilias S (2005) Flux enhancement in crossflow membrane filtration: Fouling and its minimization by flow reversal. Final Report p. 38.
© 2018 Jigesh Mehta. This is an open access article distributed under the terms of the Creative Commons Attribution License , which permits unrestricted use, distribution, and build upon your work non-commercially.
Editor In Chief


.jpg)


Signup for Newsletter

Quick Links
 Editorial Board Registrations
 Submit your Article
 Refer a Friend
 Advertise With Us
Our Recent Edition

.jpg)


Top Editors


.jpg)


.bmp)
.jpg)
.png)
.jpg)


.jpg)


.png)

.png)


.png)


Financial Support

Sponsors

Latest e-Books

Latest Video

 a Creative Commons Attribution 4.0 International License. Based on a work at www.crimsonpublishers.com.
Best viewed in
a Creative Commons Attribution 4.0 International License. Based on a work at www.crimsonpublishers.com.
Best viewed in