- Submissions

Full Text
Progress in Petrochemical Science
Scientific Publication and Cooperation Relationship on Climate Change
Minh Thu Nguyen*
Vietnam Institute of Meteorology, Hydrology and Climate Change, Vietnam
*Corresponding author:Minh Thu Nguyen, Vietnam Institute of Meteorology, Hydrology and Climate change, Ministry of Natural Resources and Environment, Vietnam
Submission: May 01, 2023;Published: May 16, 2023

ISSN 2637-8035Volume5 Issue3
Abstract
This study uses spatial simulation method to present distribution of climate change documents via authors in 1999-2010 year. Moreover, it is also used network method and regression analysis to identify and simulate relationships of author and total research publication basing on 58978 documents relate to climate change field. The results show that authors distribute mainly in USA and Europe community. Research publication in 2009-2010 year is more than 1999-2000 year. Rind, D and Chapin, FS have highest publication in 1999-2000 and Smith, P in 2009-2010 year. Prentice, IC author has most cooperated relationship in networks; Edwards, RL and Cheng, H have the strongest cooperative relationship.
Keywords:Climate change; Network; Bibliometric; Space distribution; Green House Gas (GHG)
Introduction
Climate change refers to a change in the state of the climate that can be identified by changes in the mean and/or the variability of its properties and that persists for an extended period, typically decades or longer (IPCC, 2007). This change is precisely temperature change, precipitation, humidity, wind patterns (IPCC, 2001) and they make alteration of the energy balance of the climate system leading to increasing risk of natural ecosystem, loss of biodiversity. Climate change has become a major scientific, political, economic, and environmental issue during the last decade (ICPP, 2007) and scientific articles on climate change have demonstrated a rapid increase in quantity over the past several decades, a number of papers presenting the latest research achievements have been published in authoritative scientific journals such as Nature and Science Jin Feng [1] In recent years, the publication of science papers on climate change is increasingly sharp that a common research tool for this description and analysis is the bibliometric method. Bibliometric is used to describe the study of science as growth, structure, interrelationships, and productivity Gayatri Mahapatra [2]. Many scientists have tried to evaluate the research trend in the publication outputs of paper title Fu Li [3,4], countries, institutes, journals Chiu & Ho [5], subject category Zhou [6], languages Chuang [7], document type Jie Hu [8]. However, they were merely publication counts Jin Feng Li [1] cannot completely reveal the developmental trend of research field Xingjian Liu [9] & Li [10] and the closed relationship of authors, their distribution on the world. Therefore, based on 58978 documents were published on SCI in 1999-2010, a new method is spatial distribution by map and network method are applied in this study. The research aim: 1) analyse research productivity of authors in 12 year and in two periods on climate change articles. 2) describes and spatial simulation of research productivities of authors on the world. 3) Simulates and identifies cooperated relationship of authors and countries on the world.
Methodology
The whole data source was derived from Science Citation Index (SCI) database from 1999 to 2010 with term ‘climat* chang*’ including ‘climatic change’, ‘climate change’, ‘climatically’, ‘climate changes’, ‘changes’ and ‘Climatic Changes’ [11,12]. It was used to locate publication containing these words in parts of titles, abstracts or keywords. 58978 documents were recorded into spreadsheet Excel as author keyword, document types, country, author, etc. Before calculation by bibliometric method, this study needs to implement some steps as group all the documents originated from England, Scotland, North Ireland, Wales were United Kingdom (UK) heading; the documents are from different States of America are reclassified as United State America (USA). Peoples R China; Rep of Georgia; and Mongol Peo Rep are belonged to be China; Georgia; and Mongolia. Collaborative categories are determined when independent categories are assigned. Independent categories include one or many common authors which are designed researcher. Collaborative categories conclude many different authors from one or multiple countries. Data on total greenhouse gases emission exclude LUCLUCF is come from the United Nation Framework Convention on Climate Change and United Nations Statistics Division.
Result and Discussion
From 58978 documents are downloaded from Science Citation Index database to calculate and analyse research publication in period 1999-2010 to be dispersed by two periods in 1999-2000 and 2009-2010. The results are presented as follow:
Author productivity and geographic distribution
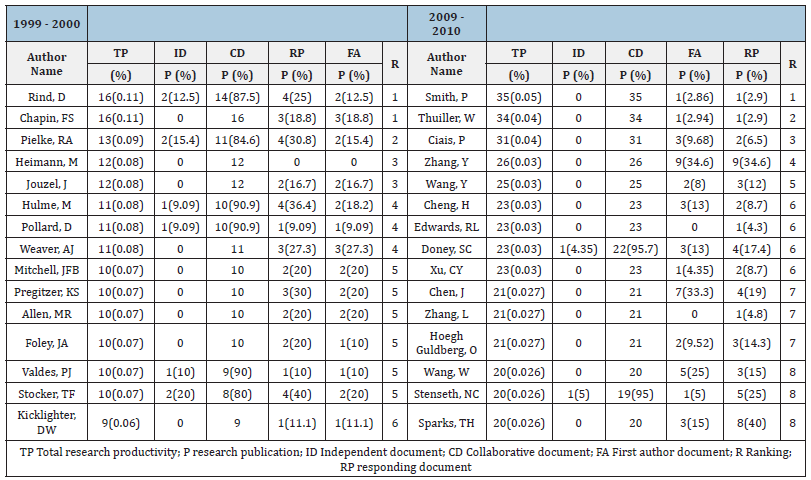
Each document often has one or many author cocontributioconcludethor on one document means an independent document and collaborative document category concludes plenty authors. Table 1 is the distribution of 15 top authors in two periods (1999-2000 and 2009-2010) including total research productivity of authors, independent document, responding author and collaborative document. In research productivity of first author documents indicates that research output in 2009-2010 year is more published than 1999-2000 year about 2 times. In the 1999- 2000, top author in total research productivity belongs to be Rind, D and Chapin, FS and ranks at the first with 16 documents of total research productivity in which Rind, D had 2 independent documents (12.5%) and 14 collaborative documents (87.5%) that revealed 2 documents of the first author and 4 documents of responding author; Chapin, FS concludes 16 collaborative documents (no independent document) as well which appeared 3 documents of the first author and 3 documents of responding author. Following distantly by Pielke, RA is the second ranking with 13 documents (0.09%); Heimann M and Jouzel J is the third ranking with 12 documents (0.08%); Hulme M, Pollard D and Weaver AJ with 11 documents (0.08%) in 4th ranking; Mitchell JFB; Pregitzer KS; Allen, MR; Foley JA; Valdes PJ and Stocker TF have 10 documents (0.07%) in 5th ranking; and the last ranking on Table 1 in 1999- 2000 year is Kicklighter, DW with 9 documents (0.06%) of total research productivity; 1 document in the first author form (11.1%); and 1 document (11.1%) of responding author one. In 2009 - 2010, top author has the most research productivity is Smith, P with 35 documents (0.05%) in 1st ranking concluding 1 document of the first author form. Followed by Thuiller, W 34 documents (0.04%) in 2nd ranking; Ciais, P 31 documents, Zhang, Y 26 (0.03), and Wang, Y 25 documents are 3rd, 4th, 5th ranking. The sixth ranking is Cheng, H; Edwards, RL; Doney, SC; Xu, CY with 23 documents (0.03%).
Table 1: Disperse of authors in 1999-2000 and 2009-2010.

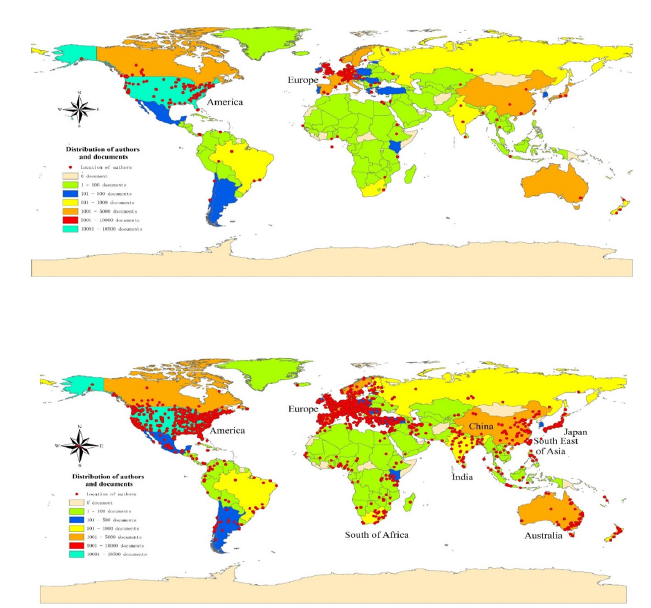
Next ranking is Chen J; Zhang L; Hoegh Guldberg O with 20 documents (0.027%). The 8th ranking is Wang, W; Stenseth NC; Sparks TH with 20 documents (0.026%). Generally via two periods of 1999-2000 and 2009-2010 show that research productivity of independent documents was less than collaborative documents such as Rind, D 2 documents (12.5%) and 14 documents (87.5%); Pielke, RA 2 documents (15.4%) and 11 documents (84.6%); Hulme, M 1 document (9.09%) and 10 documents (90.9%), Pollard, D 1 document (9.09%) and 10 documents; Valdes, PJ 1 document (10%) and 9 documents (90%); Stocker, TF 2 documents (20%) and 8 documents; Doney SC 1 document (4.35%) and 22 documents (95.7%); Stenseth NC 1 document (5%) and 19 documents; etc. Table 1. Collaborative document number accounted for 8-14 documents in 1999-2000 and accounted for 19-35 documents in 2009-2010. Thus, research output of cooperative document category in 2009-2010 was more published than 1999-2000 about 2.3 times. Particularly in the first author document form, research publication in 1999-2000 was less than in 2009-2010 in which three authors did not have any publication in 1999-2000 and 2009-2010 as Heimann M; Edwards RL; and Zhang L. On two maps Figure 1 indicate distribution density of authors and total research productivity on the world. Research publication distributes no uniform which concentrates more in some countries as USA and Europe community.
Distribution of author is mainly in Europe and America as well; some authors distribute spread in many countries such as China; India; Australia; New Zealand; Japan; and so on. Addition to that distributed density of authors in 2009-2010 is thicker than in 1999- 2000. It means research publication of 2009-2010 is more than 1999-2000. Watching on Figure 1 showed research productivity in 2009-2010 increased very sharp, especially in Europe, America, China, India, Nigeria, and South Africa. Furthermore, a lot of authors emerged in 2009-2010 such as the authors in Sri Lanka; Philippines; Malaysia; and some countries in the West of Asia and Africa. Thus, via two maps about author distribution and total research productivity indicated clearly that density of author distribution in 2009-2010 was more than 1999-2000 because of growth of research publication in many recent years.
Figure 1:Distribution of authors in 1999-2000 và 2009-2010 year.

Authors co-operation
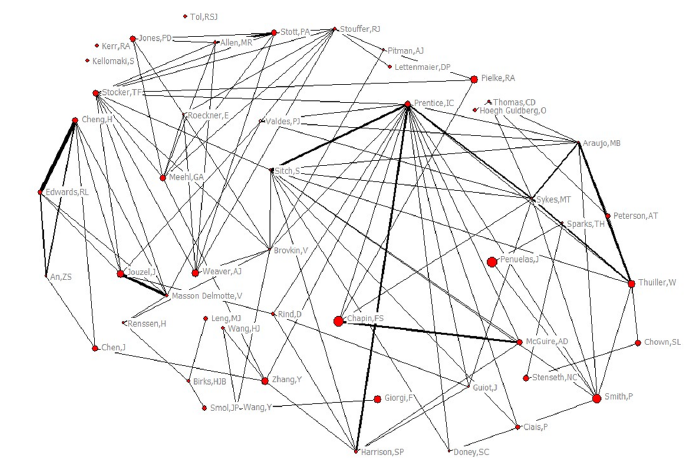
From research results of author publication indicated that collaborative document number was more than independent document number, it demonstrated the collaborative categories gave growth of large relationship between authors. Figure 2 introduces cooperative relationship of 50 authors and presents that collaborative relationship intensity distinguished evidently. 3 authors have not any cooperative relationship as Kerr RA; Kellomaki S; and Tol RSJ. 47 authors have closely collaborative relationship such as the most cooperated relationship is Prentice IC author, followed by Stocker TF; Sich S; Araujo MB; Sykes MT; Stouffer RJ; Meehl GA; Smith P; Allen MR; and so, on Figure 2. They are displayed by different thick connect lines that thicker connect line describes stronger collaborative relationship intensity such as Edwards RL and Cheng H author have the strongest cooperative relationship, followed by Prentice IC with Harrison SP; Sitch S with Prentice IC; Chapin FS with McGuire AD; An ZS with Cheng H; An ZS with Edwards RL; Jouzel J with Masson Delmotte V; Thuiller W with Araujo MB; Allen MR with Stott; Sykes MT with Thuiller W; Prentice IC with Sykes MT; and Sykes MT with Araujo MB. Thus, collaborative relationships of authors through research network indicated that authors had very closely cooperative relationship with each other.
Figure 2:International cooperation networks of authors.

Conclusion
Therefore, based on documents publish on SCI during 1999- 2010, spatial simulation way and deeply analysis help us more understanding about a field of climate change. It provides essential knowledge for spatial simulation and related relationship. Significant points of this study are drawn following as: Research publication in 2009-2010 was more than 1999-2000. Rind D and Chapin FS had the highest research publication in 1999-2000 and Smith P in 2009-2010. Moreover, authors distributed more in Europe community, USA and other developed countries. The most co-operated relationship was Prentice, IC author in networks. Edwards RL author and Cheng H author had the strongest cooperative relationship among many authors.
References
- Jin FL, Wang MH, Yuh SH (2011) Trends in research on global climate change: A science citation index expanded based analysis. Glob and Plan Change 77(2): 13-20.
- Gayatri M (2009) Bibliometric studies in the internet era. India Publishing House, New Delhi, India.
- Fu HZ, Ho YS, Sui YM, Li ZS (2010) A bibliometric analysis of solid waste research during the period 1993-2008. Waste Management 30(12): 2410-2417.
- Li J, Zhang Y, Wang X, Ho YS (2009) Bibliometric analysis of atmospheric simulation trends in meteorology and atmospheric science journals. Croatica Chemica Acta 82(3): 695-705.
- Chiu WT, Ho YS (2007) Bibliometric analysis of tsunami research. Scientometrics 7: 3-17.
- Zhou F, Guo HC, Ho YS, Wu CZ (2007) Scientometric analysis of geostatistics using multivariate methods. Scientometrics 73(3): 265-279.
- Chuang KY, Huang YL, Ho YS (2007) A bibliometric and citation analysis of stroke related research in Taiwan. Scientometrics 72: 201-212.
- Hu J, Ma Y, Zhang L, Gan F, Ho YS (2010) A historical review and bibliometric analysis of research on lead in drinking water field from 1991 to 2007. Science of the Total Environment 408(7): 1738-1744.
- Liu X, Zhang L, Hong S (2011) Global biodiversity research during 1900-2009: A bibliometric analysis. Biodivers and Conserv 20: 807-826.
- Watson RT (2011) Climate change 2001: Synthesis report. A contribution of working groups I, II and III to the third assessment re of IPCC, Cambridge University, Cambridge, UK.
- Solomon S, Qin D, Manning M, Pachauri RK (2007) Climate change 2007: The physical science basic. Contribution of working group I to the fourth assessment re of IPCC, Cambridge, UK.
- Li J, Zhang Y, Wang X, Ho YS (2009) Bibliometric analysis of atmospheric simulation trends in meteorology and atmospheric science journals. Croatica Chemica Acta 82(3): 695-705.
© 2023 Minh Thu Nguyen. This is an open access article distributed under the terms of the Creative Commons Attribution License , which permits unrestricted use, distribution, and build upon your work non-commercially.
 a Creative Commons Attribution 4.0 International License. Based on a work at www.crimsonpublishers.com.
Best viewed in


.jpg)


 Editorial Board Registrations
 Submit your Article
 Refer a Friend
 Advertise With Us
.jpg)


.jpg)


.bmp)
.jpg)
.png)
.jpg)


.jpg)


.png)

.png)


.png)


