- Submissions

Full Text
Progress in Petrochemical Science
Production of Hythane by Stepped Pyrolysis of Biomass
Amrit Anand, Dipika Das and Shalini Gautam*
Department of Fuel Minerals and Metallurgical Engineering, Indian Institute of Technology (ISM), Dhanbad, India
*Corresponding author: Shalini Gautam, Department of Fuel Minerals and Metallurgical Engineering, Indian Institute of Technology (ISM), Dhanbad, Jharkhand-826004, India
Submission: February10, 2023;Published: March 21, 2023

ISSN 2637-8035Volume5 Issue2
Abstract
The transportation industry mainly uses conventional fuel like petrol and diesel, which produces greenhouse gases and cause serious environmental concerns. A clean, sustainable renewable fuel is needed to minimize the high carbon footprint and emissions. This study focuses on producing Hythane(mainly a mixture of hydrogen and methane) from biomass through the pyrolysis route. Sawdust and groundnut shell is slowly pyrolyzed in the vertical reactor to produce hythane gas. The weight loss profile was studied through a thermogravimetric analyzer, and the effect of temperature on hythane gas composition was analyzed by gas chromatography. The hythane gas contains almost 40%-45% of hydrogen and 12 to 25% methane along with oxides of carbon, which depends upon temperature and feedstock types..
Keywords: Hydrogen; Methane; Ultimate analysis; TGA; Gas chromatography; Hythane gas; Gas chromatography
Introduction
Energy is the backbone of any country, and its demand is increasing tremendously yearwise [1]. Fossil fuels fulfill most of the huge energy demand [2-4], but these conventional fuels leave a huge carbon footprint. The interconnected problems for sustainable energy and the environment are very challenging, which can be minimized by alternate renewable fuel. The thermochemical conversion route is an excellent solution to use biomass energy in the technical application [5] and to overcome environmental pollution due to the exhaust of Internal Combustion (I.C.) engines and industries; the immediate replacement of fossil fuel systems with a pure hydrogen system is a gigantic task and must be attained in a stepwise manner in the near future. So, the technology is approaching for CNG and hythane (a mixture of hydrogen and methane) [6]. Agricultural and forestry wastes are potential renewable sources of energy. Biomass is carbon neutral fuel and is abundantly available in India. The total biomass production is around 750MT, out of which the surplus availability is 230MT [7]. Many conventional and established ways exist to obtain H2 and CH4 mixture, but they can only be environmentally friendly if extracted from renewable energy sources like biomass other than fossil fuels. Thermo-chemical and biochemical processes are the two main routes to produce biomass hythane. Hydrogen can be obtained from syngas, alkane steam reforming, electrosynthesis, and dark fermentation processes whose main gaseous component is hydrogen [6-8] Gasification is a process where hydrocarbons undergo partial combustion, and the main product is synthesis gas. Slow pyrolysis is a process in which bio-organic materials undergo thermal degradation in a completely oxygen-free atmosphere. At the end of biomass pyrolysis, one can get solid (biochar), liquid (bio-oil), and biogas [a mixture of H2, CO, CH4, CO2, and lower hydrocarbon (C1-C3) [9]. Biomass structures also define the proportion of different pyrolytic products and the composition of the gaseous product. The heating rate also changes the composition of different pyrolytic products [10]. As lignin is responsible for high H2 and CH4 formation, hemicellulose is accountable for the increased CO2 emission, and cellulose is responsible for high CO production [11]. The hydrogen content (H2) depends on the pyrolysis temperature and increases as the temperature increases [6,12]. In Earlier studies, the syngas was produced from biomass through the gasification route and enrichment of hydrogen through steam and methane reforming, water gas shift reaction [13]. The current study aims to produce hythane from biomass through pyrolysis route, the effect of temperature on product gas, and its utilization prospects in an internal combustion engine and iron ore reduction.
Materials and Methods
Sample collection and preparation
The biomass sample used in this study includes Saw Dust (SD) and Groundnut Shell (GS). Both the samples were collected from the Dhanbad region, Jharkhand. All samples were appropriately cleaned to remove dust and contamination. Approximately 200g of the samples were chopped and dried at 105 °C using the oven-dry technique ASTM D-3173-87. The samples were shredded to-1mm and pulverized to-212μm for further compositional, structural, and thermal analysis.
Experimental procedure
Proximate and ultimate analyses and calorific value determination:Proximate analysis (Ash(A), Moisture(M), Volatile Matter (VM), and Fixed Carbon (FC) contents) of biomass samples and their chars was performed following the standard methods (ASTM E871-82, E1755-01, and E872-82) [14,15].The difference determined the F.C. content. Ultimate analysis (EL III, Vario) of the biomass samples were carried out following ASTM E777, E778, and E775 standard methods for determining C,H,N, and S content. The oxygen content (%) was calculated by the difference. The calorific value was determined using a Bomb Calorimeter (AC-350; LECO); the standard test method ASTM D5865-13 was followed for determining the calorific value of biomass samples [16,17].
Structural analysis of biomass samples:For structural analysis, the samples were prepared as per ASTM Standard Practice E 1757-01 [18]; further, for determining the extractive, the ethanol solvent extraction method was used in which all the extractives get dissolved [19], and the structural component of extractive free biomass samples were determined by ASTM E1758-01[7,19].
TGA and DTG analysis:The ASTM E1131-03 standard method was followed for T.G. analysis (STA 449F3 Jupiter; NETZCH), in which about 15mg of biomass sample (-212μ) was used. The heating and nitrogen gas flow rates in the TGA analyzer were 10 °C/min and 60ml/min, respectively.
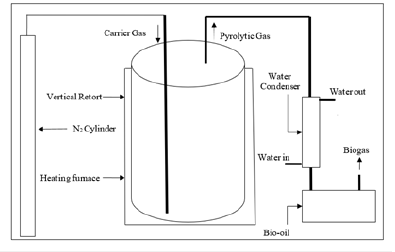
Reactor setup and procedure:The designed pyrolysis reactor shown in Figure 1 was performed under anaerobic conditions. The reactor setup consists of a quartz reactor sample holder for holding the sample inside the heating zone and a furnace with a PID controller. A water condenser condenses the condensable gases and separates them from non-condensable gases in the liquid gas separator. Further, the product gases passed through a scrubber to clean the gas. The non-condensable gas gets collected in a gas collector, and intermediate gas sampling is done to analyze the product gas composition with respect to temperature by Gas Chromatography (G.C.) (MM TECH, M 2012) equipped with a Thermal Conductivity Detector (TCD). The analysis was carried out using (N 2000) software attached to the instrument. The biomass samples of size <2 inches is fed into the reactor during this process. N2 gas was purged (1 liter/min) to maintain an inert environment inside the reactor. The heating rate was maintained at 15 ˚C/ minute. Initially, Nitrogen (@5 liter/min) is purged in the reactor, up to 150 ˚C, to remove the moisture. Further, the nitrogen was purged(1 liter/min) to maintain the inert atmosphere and uniform heating zone, with a heating rate of 25 ˚C/minute. The intermediate sampling was done at temperatures of 400 ˚C, 500 ˚C, 600 ˚C, 700 ˚C, and 800 ˚C. The overall sampling was done from the gaseous chamber, where the total non-condensable gas was collected to determine the overall composition of gases.
Figure 1Flow chart of the pyrolysis process.
Result and Discussion
Proximate and ultimate analysis and GCV of biomass samples
Tables 1 & 2 shows the chemical characterization of biomass and their chars and calorific value. The volatile matter (V.M.) is very high (3.5 times) compared to conventional fuels like coal [20], which is desirable for the current study. In the case of char majority of V.M. gets evaluated at 800 ˚C. So, the higher content of V.M. will contribute to a higher yield of product hythane gas [21].
Table 1:Proximate and ultimate analysis and GCV of biomass and char (dry basis).

Table 2:Structural analysis of biomass.

Carbon & hydrogen content: Table 1 shows that the carbon content in raw biomass samples lies around 47% and in char around 77%. It is the primary component that contributes to the product gas. The higher the carbon content, the higher the product gas yield [22]. The hydrogen content in studied raw samples lies in the range of (6.34%-6.59%) and char (1.65%-1.77%). Hydrogen content is the most important element in this investigation which is responsible for hydrogen production and methane production. Higher the hydrogen content, the better the product gas. Hydrogen is mainly generated from the condensation of aromatics or alkyl aromatization reaction during pyrolysis at a temperature beyond 400 °C [23]. Thus, these plants can act as a good source of hydrogen. The difference between hydrogen in raw and char after pyrolysis processing shows the extent of hydrogen evolution, mainly in hydrogen and methane [24].
Nitrogen and sulfur content: From (Table 1), it can be observed that nitrogen content in raw biomass samples and their char; lies in the range of 0.18%-0.48% and 0.12%-0.57%, respectively, and the amount of sulfur present in the range of (0.10%-0.16%) and 0.07%-0.13% respectively. The low S&N-containing biomass consider a good fuel because there will be a low formation of sulfur and nitrogen oxides during the thermochemical conversion process [8,25]. The High sulfur-containing fuel is not suitable for internal combustion engines as well for power production. The sulfur-containing fuel adversely affects the metal quality due to its corrosive nature towards metal; sulfur-containing fuels are not fit for I.C. engines [24]. Therefore, the biomass used in this work can reduce the corrosion severity impact on the equipment use and maintenance cost.
Oxygen content: From (Table 3), the amount of oxygen present in raw samples and their char is 35.46%-38.30% and 6.82%- 7.56%, respectively. Oxygen is mainly responsible for forming carbon monoxide and Carbon dioxide, which exist in the molecular structure of biomass [26]. Thus, the oxygen content should be less for quality product yield fuel.
Table 3:Thermal characteristics of sawdust and groundnut shell.

Calorific value: The calorific value of raw samples and their char lies in the range of 19.10MJ/kg- 19.42MJ/kg and 23.07MJ/kg- 24.03MJ/kg, respectively well-represented in Table 1. Hydrogen and carbon are the main contributors to GCV, and hydrogen plays a vital role as its calorific value is four times higher than the GCV of coal. So higher hydrogen content is desirable in fuel [27].
Structural analysis
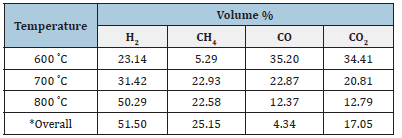
Biomass comprises three major structural components, hemicellulose, cellulose, and lignin, which play a significant role in their growth period and provide strength; their concentration varies substantially as per the location, species to species, and growth conditions. These three-components, along with extractives, are the main contributor to all the products obtained during the thermochemical conversion of biomass. From (Table 2), it can be seen that the structural components, extractives (E), hemicellulose (H), cellulose (C), and lignin (L) are in the range of 8.28-13.4, 20.01- 21.2, 34.78-36.85, 18.1-26.5 respectively. The L/C, L/H, and L/E ratios are more dominant in sawdust than in groundnut shells. As per [11], lignin is responsible for high H2 and CH4 formation, hemicellulose is responsible for increased CO2 emissions, and cellulose is responsible for high C.O. production. So, the hydrogen and methane in the gaseous yield of SD were higher than GS (Table 4).
Table 4:Volumetric composition of produced gas during the slow pyrolysis process of sawdust
Thermogravimetric Analysis
Thermogravimetric Analysis (TGA) and Differential Thermogravimetric Analysis (DTG) of biomass were done to understand the decomposition characteristics of biomass with respect to temperature and time shown in Figure 2 and Table 3. From (Figure 2), the thermal characteristics table has been made, which describes the respective temperatures and rate of decomposition of structural components based upon peaks obtained in the DTG profile. Thermal characteristics [28,29] of the SD and GS is shown in (Table 3).
Figure 2TGA and DTG analysis of sawdust and groundnut shell.
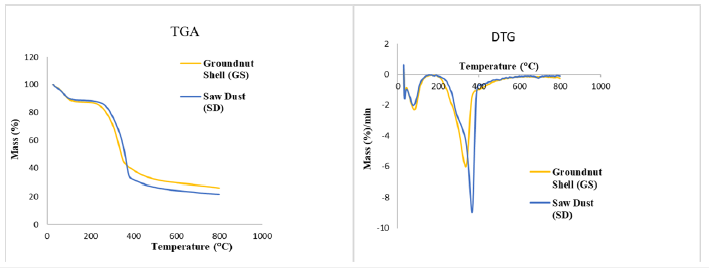
Where; a. Tonset: The extrapolated onset temperature is calculated from the partial peak resulting from the decomposition of the hemicellulose component. b. (dm/dt)sh: The overall maximum of the hemicellulose decomposition rate. c. Tsh: The temperature corresponding to the overall maximum of the hemicellulose decomposition rate. d. (dm/dt)peak: The overall maximum of the cellulose decomposition rate. e. Tpeak: The temperature corresponding to the overall maximum of the cellulose decomposition rate. f. Toffset: The extrapolated offset temperature of the dm/ dt curves. This value describes the end of the cellulose decomposition. Decomposition of the structural component varies in diverse temperature regions; hemicelluloses and cellulose usually occur around 220-315 °C and 305-400 °C, respectively, with the maximum mass losses at 268-355 °C, whereas lignin decomposes in a wide range of 180-900 °C [1,30]. In the case of SD, the decomposition of extractives starts at a higher temperature (182 °C) compared to G.S. (161 °C). A similar observation was in the case of hemicellulose, cellulose, and lignin and decomposition rate component. Due to the higher content of lignin in S.D., offset temperature is higher for S.D. than G.S., whereas the burnout temperature (Tbo , mass loss rate<1%) is lower in the case of S.D. due to higher decomposition rate.
Gas chromatographic analysis
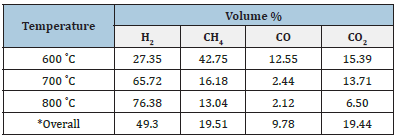
Analysis of the produced gas was done through Gas Chromatography (G.C.); results of G.C. for each of the selected biomass samples are shown in Tables 4 & 5. Table 4 shows that the composition of H2, CO, and CO2 is significant at 600 ˚C, which is about 23.14%, 35.20%, and 34.41%, whereas CH4 concentration is significantly less than about 5% at this temperature. As the temperature rises, the H2 and CH4 concentration increases significantly, while the trend is reversed in the case of CO and CO2. The overall composition of H2 is about 51.50%, CH4 nearly 25.15%, CO is about 4.34%, and CO2 is approximately 17.05%. From the 5, At lower pyrolysis temperatures, the concentration of H2CH4 is significant, i.e.,27% and 43%, respectively, whereas for CO and CO2, it is 12% and 15%, respectively, at 600 ˚C. Further, with the temperature rise, only hydrogen concentration increases significantly, and the trend is reversed for other gases. In view of the overall composition of gases, sawdust pyrolytic hythane gas has better quality than GS pyrolytic gas due to a higher percentage of hydrogen and methane. So, the perspective of the I.C. engine, the hythane produced from sawdust will perform better.
Table 5:Volumetric composition of produced gas during the slow pyrolysis process of groundnut shell.
Mass balance
a. Wt. % of Bio-char=W1 (Measured) b. Wt. % of Bio-oil=W2 (Measured) c. Wt. % of Gas;W3=(100-W1-W2) d. CVo and CVG=calorific value of oil and gas.
(Table 6) Hythane obtained from sawdust has better hythane yield, quality and calorific value, so it will perform better than GS. On the other hand, hydrogen and methane are strong reducing agents that can utilize for iron ore reduction [6,30].
Table 6:Mass balance of feed and product (wt%) CV of gas and oil.

Conclusion
Hythane was produced from sawdust and groundnut shells during stepped pyrolysis. It can be concluded that hydrogen and methane production is directly relative to temperature; however, higher temperature ranges contributed more towards hydrogen and methane production due to higher lignin and cellulose content. Typically, noncondensable Biogases contain 49%-51% hydrogen and 19%-25% methane along with 4%-9% carbon monoxide and 19%-21% carbon dioxide depending on different biomass samples. As the samples were pyrolyzed in a stepped (temperaturewise) manner, the oxygen functionality evolved in the initial stages, reducing the concentration of CO and CO2 in the product gas. Eventually, the concentration of Hydrogen and Methane in the product gases increases. The structural component, mainly cellulose and lignin, dominates over the groundnut shell, which leads to richer hydrogen and methane concentration in hythane at higher temperatures. The potential utilization of hythane gas as hydrogen-rich fuel in IC engines can be done.
Acknowledgment
The authors are thankful to the Dept. of Fuel Minerals and Metallurgical Engineering, Indian Institute of Technology (ISM) DHANBAD, for providing the research facility to carry out this experimental work.
References
- Paswan DK, Anand A, Nandi BK, Gautam S (2022) Drying characteristics and kinetics behavior of Indian coal slurries using natural draft tray dryer. Int J coal Prep Util.
- Shalini G (2017) Assessment of low-volatile poor caking Indian coal for coke making. Int J Coal Prep Util 37(1): 33-43.
- Petrović M, Fiket Ž (2022) Environmental damage caused by coal combustion residue disposal: A critical review of risk assessment methodologies. Chemosphere 299: 134410.
- Pudasainee D, Kurian V, Gupta R (2020) Coal: Past, present, and future sustainable use. Future Energy Improv Sustain Clean Options Our Planet pp. 21-48.
- Chen G, Andries J, Luo Z, Spliethoff H (2003) Biomass pyrolysis/gasification for product gas production: 0054he overall investigation of parametric effects, Energy Conversion and Management 44(11): 1875-1884.
- Prajapati BK, Anand A, Gautam S, Singh P (2022) Production of hydrogen-and methane-rich gas by stepped pyrolysis of biomass and its utilization in IC engines. Clean Technol Environ Policy 24: 1375-1388
- Anand A, Gautam S, Chand Ram LC (2023) A characteristic-based decision tree approach for sustainable energy applications of biomass residues from two major classes. Fuel 339: 127483.
- Rahimi Z, Anand A, Gautam S (2022) An overview on thermochemical conversion and potential evaluation of biofuels derived from agricultural wastes. Energy Nexus 7: 100125.
- Karagöz S (2009) Energy production from the pyrolysis of waste biomasses. Int J Energy Res 33(6): 576-581.
- Debdoubi A, Amarti A, Colacio E, Blesa MJ, Hajjaj LH (2006) The effect of heating rate on yields and compositions of oil products from esparto pyrolysis. Int J Energy Res 30(15): 1243-1250.
- Hlavsová A, Corsar A, Raclavská H, Juchelková D, Škrobánková H (2014) Syngas production from pyrolysis of nine composts obtained from nonhybrid and hybrid perennial grasses. Sci World J.
- Neves D, Thunman H, Matos A, Tarelho L, Gómez-BA (2011) Characterization and prediction of biomass pyrolysis products. Prog Energy Combust Sci 37(5): 611-630.
- Mishra A, Gautam S, Sharma T (2018) Effect of operating parameters on coal gasification. Int J Coal Sci Technol 5: 113-125.
- Das D, Anand A, Gautam S, Rajak VK (2022) Assessment of utilization potential of biomass volatiles and biochar as a reducing agent for iron ore pellets. J Env Tech pp. 1-26.
- Demirbas A (2004) Effects of temperature and particle size on bio-char yield from pyrolysis of agricultural residues. J Anal Appl Pyrolysis 72(2): 243-248.
- Das D, Anand A, Gautam S (2022) Effect of rice husk volatiles in iron ore reduction and its kinetic study. Energy Sources, Part A Recover. Util Environ Eff 44(3): 6321-6333.
- Ohliger A, Förster M, Kneer R (2013) Torrefaction of beechwood: A parametric study including heat of reaction and grindability. Fuel 104: 607-613.
- Hames B, Ruiz R, Scarlata C, Sluiter A, Sluiter J (2008) Preparation of samples for compositional analysis: Laboratory analytical procedure (LAP).
- Sluiter JB, Ruiz RO, Scarlata CJ, Sluiter AD, Templeton DW (2010) Compositional analysis of lignocellulosic feedstocks. 1 Review and description of methods. J Agric Food Chem 58: 9043-9053.
- Gautam S (2017) Effect of washing and stamping on coke making of a low-grade Indian coal: Correlation between various properties. Ironmak Steelmak 44(7): 505-512.
- Nunes L, Matias JCDO, Catalao JPDS (2018) Torrefaction of biomass for energy applications. Elsevier
- Mazzotti M, Carlos J, Allam RJ, Lackner KS, Meunier F, et al. (2005) Mineral carbonation and industrial uses of carbon dioxide. IPCC Spec Rep Carbon dioxide Capture Storage pp. 319-338.
- Liu P, Wang Y, Zhou Z, Yuan H, Zheng T, et al. (2020) Effect of carbon structure on hydrogen release derived from different biomass pyrolysis. Fuel 271.
- Loison R, Foch P, Boyer A (1989) Coke quality and production. Butterworth & CO.
- Suman S, Gautam S (2017) A comparative study between time, temperature, and fixed carbon using different biochar reductants as an alternate source of energy. Energy Sources Part A Recover Util Environ Eff 39(10): 1029-1035.
- Nunes LJR, Matias JCDO, Catalão JPDS (2018) Introduction, in: Torrefaction of biomass for energy applications. Elsevier pp.1-43.
- Anand A, Gautam S, Ram LC (2023) Feedstock and pyrolysis conditions affect suitability of biochar for various sustainable energy and environmental applications. J Anal Appl Pyrolysis 170: 105881.
- El-Sayed SA, Mostafa ME (2014) Pyrolysis characteristics and kinetic parameters determination of biomass fuel powders by differential thermal gravimetric analysis (TGA/DTG). Energy Convers Manag 85: 165-172.
- Wilson L, Yang W, Blasiak W, John GR, Mhilu CF (2011) Thermal characterization of tropical biomass feedstocks. Energy Convers. Manag 52(1): 191-198.
- Yang H, Yan R, Chen H, Lee DH, Zheng C (2007) Characteristics of hemicellulose, cellulose and lignin pyrolysis. Fuel 86(12-13): 1781-1788.
© 2023 Shalini Gautam. This is an open access article distributed under the terms of the Creative Commons Attribution License , which permits unrestricted use, distribution, and build upon your work non-commercially.
 a Creative Commons Attribution 4.0 International License. Based on a work at www.crimsonpublishers.com.
Best viewed in


.jpg)


 Editorial Board Registrations
 Submit your Article
 Refer a Friend
 Advertise With Us
.jpg)


.jpg)


.bmp)
.jpg)
.png)
.jpg)


.png)

.png)


.png)


