
- About Us
- Information
-

The Author ensures that the research has been conducted responsibly and ethically with adherence to all relevant regulations. read more..
- For Authors
- For Reviewer
- Manuscript Guidelines
- Membership
- Publication Ethics
-
- Journals
- Reprints
- e-Books
- Videos
- Policies
- Contact Us
 COVID-19
- Submissions


Full Text
Progress in Petrochemical Science
Effect of Diffusivity of Petroleum Products on Human Health in Contaminated Areas
Isam Al Zubaidi*
Industrial Systems Engineering, Faculty of Engineering and Applied Science, University of Regina, 3737 Wascana Parkway, Regina, SK S4S 0A2, Canada
*Corresponding author: Isam Al Zubaidi, Industrial Systems Engineering, Faculty of Engineering and Applied Science, University of Regina, 3737 Wascana Parkway, Regina, SK S4S 0A2, Canada Isam.Al.Zubaidi@uregina.ca
Submission: August 08, 2020;Published: October 27, 2020

ISSN 2637-8035Volume3 Issue5
Abstract
The effect of diffusivity of petroleum products on human health in contaminated areas was investigated. The diffusivity of light naphtha, different brands of gasoline, gasoline-ethanol blends, and jet fuel were examined as a function of temperature. The diffusivities were related to the density, vapor pressure, and the types of hydrocarbons present in each product. The diffusivity of different gasoline-ethanol blends was also studied. The temperature has an effective influence on diffusivity. The increasing of atmospheric temperature means an increasing in the diffusivity and increasing in the impact of human health and especially in closed areas as hydrocarbon vapors contaminated area.
Keywords: Health impact;Light petroleum refinery products;Diffusivity
Introduction
Risk assessment is defined as a systematic process for describing and qualifying the risks associated with hazardous substances as action or events. It is function of hazard, exposure, opportunity, and population at risk. To analyze the risk, hazard must be identified and evaluated qualitatively and quantitatively. In this work, the environment risk assessment will be evaluated with the molecular diffusion of light petroleum refinery products in air at different operating temperatures. Light petroleum refinery products are mixture of hydrocarbons and can cause fire, explosion, health and environmental hazards. The physical properties can vary depending on source, product specification and additives. Vapors of light oil products are heavier than air, so, they don’t disperse easily in air conditions and tends to sink to the lowest level within its surroundings. Accumulations of light petroleum vapors in enclosed spaces or other poorly ventilated areas can persist for long time, even where there is no longer any visible sign of liquids. Vapors concentration of suspended fuel depends upon weather conditions and gives off flammable vapors even at very low temperatures [1]. Automobile refueling is one of the most important sources of benzene vapor emitting to the atmosphere. It has severe health effect on workers and people in refueling stations [2]. Individuals exposal to different hydrocarbons present in these products have reported emotional dysfunction, decreased attention spans, fatigue, skin irritation, postural sway imbalances, and adverse effects on sensorimotor speed, liver function, and the respiratory system [3]. The evaporation of unleaded gasoline with octane number of 93 was studied experimentally [4]. The weight, Reid vapor pressure, viscosity, and the concentration of non-methane total hydrocarbon were measured in oil vapor phase. These parameters were changed significantly during evaporation process because gasoline is a multi-component fuel. The mass loss reached 86.36% after 300 days. Most oil and petroleum products evaporated at a logarithmic rate with respect to time [5-7]. Evaporation rate was conducted with/without wind [8]. The evaporation rates were similar for all wind conditions and lower without wind and the boundary layer regulation was not dominant for petroleum products.
Molecular diffusion can be defined as macroscopic transport of mass, independent of any convection within the system [9]. The diffusivity of light petroleum vapor in air can be conveniently determined by Winklemann’s method in which the liquid in a narrow diameter vertical tube, maintained at a constant temperature, and air stream is passed over the top of the tube to ensure that the partial pressure of the vapor is transferred from the surface of the liquid to the air stream by molecular diffusion. According to mass transfer theory, diffusion occurs from high to low concentration regions. Many factors can affect diffusivity such as temperature, pressure and molar mass. Diffusivity is faster at high temperature, low pressure, and low molar mass of material. Diffusion rate can be referred as “flux J” which represents the amount of species per time that passes through a unit area. The flux is calculated through the Fick’s rate equation:

It is very essential to calculate the diffusivity since it can predict the time needed for certain species to transfer in a medium. Thus, the diffusivity has several applications and benefits in life. The diffusion rate (flux) depends on diffusivity coefficient D, so it is essential to identify how D affects the flux. It is assumed that the higher the temperature, the higher the diffusivity rate will be, since an increase in temperature represents an increase in the average molecular speed. The transfer theory where molar mass transfer rate NA is related to the diffusivity by the following formula [10,11]:
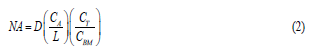
Where CA is the saturation concentration at interface, L is the effective distance of mass transfer, CBM is logarithmic mean of molecular concentration of vapor, and CT is the total molar concentration, which is (CBM+CA). Evaporation of liquid is associated with mass transfer rate in the following formula:

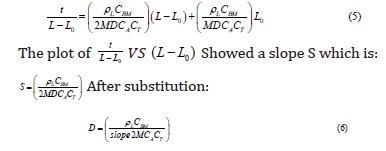
Where ρ and M are the density and molecular mass of light petroleum product. By equating equations (1) and (2), then integrating between L to Lo and 0 to t gives the following formula:

By rearranging equation (3) to be similar to format of linear equation, it will be as follows:
Where:
The temperature dependence of the diffusion coefficient data can be expressed using the following equation:

D is the diffusivity in square meter per second which is a proportionality factor in Fick’s law by which the mass of a substance diffusing in time through the surface normal to the diffusion direction which is proportional to the concentration gradient. Physically, the diffusivity coefficient implies that the mass of the substance diffuses through a unit surface in a unit time at a concentration gradient of unity.
Experimental Work
Materials
Light naphtha, jet fuel (A-1), and three different brands of unleaded gasoline were studied. Gasoline of different brands was collected from local petrol station. These three brands of gasoline have different octane rating. Gasoline is a mixture of C4- C10 hydrocarbons. Each brand has different formula with different additives. The un-even or un-smooth combustion of gasoline can cause engine knock. The knock is due to high-pressure rises after ignition. Air-gasoline mix in vehicle engine needs to burn evenly inside the combustion chamber. If the mix is burned too early (preignition) or too late, it will cause extra molecules or pressure waves to be produced and this will cause engine knock. This means that this mix is not burning perfectly at correct time and causing parts of engine to knock [12]. The higher the octane numbers the slower the burn rate and greater the resistance to auto-ignition or knock of the fuel. Research octane number of the brands super, special, and (E+) are 98, 95, and 91, respectively. Moreover, these brands have different densities in which (E+) is considered the lightest while super is the heaviest. The specifications of different brands of gasoline are shown in Table 1.
Table 1: Gasoline specifications [13].

Most of the times, gasoline blends with ethanol; ethanol has higher heat of vaporization than gasoline [13-16]. This makes the temperature of the intake manifold lower, which increases air-fuel mixture density and increasing the engine’s volumetric efficiency. This leads to lower combustion temperatures and burning velocities, which could potentially cause higher CO and HC emissions. From Table 1, it is clear that the Reid Vapor Pressure (RVP) is much lower than that of gasoline, and this will lower VOCs emissions during pumping processes. The properties of gasolineethanol blends are shown in Table 2.
Table 2: Properties of ethanol-gasoline blends [14]. E10* means 10% by volume ethanol

Jet fuel (A-1) is kerosene grade fuel, which is suitable for most aviation and civil aviation engines. It is complex mixture of many components, including napthalenes, diaromatics, cycloalkanes, straight chain alkanes, and branched chain alkanes. The physical properties of jet fuel A-1 are shown in Table 3. Naphtha is a complex hydrocarbon mixture with carbon number of C5-C12. Naphtha is light oil product with the specifications shown in Table 4.
Table 3: Jet fuel A-1 general specification [13].

Table 4: Naphtha specifications.

Methodology
Gaseous diffusion apparatus was applied. It utilizes high definition digital microscope linked to PC to monitor and determine the movement of the boundary phase of the liquid inside T shape capillary tube as a liquid diffuses into stationary air. Light petroleum product samples were inserted inside a capillary tube, which maintained at constant temperature by a PID controlled heated metal block. The block is heated by an electric cartage heater and kept at a constant temperature using electrical control loop. The air is passed across the top of the capillary tube creating partial pressure difference between the oil sample surface and the flowing air streams. As the liquid started evaporation, the vapor will diffuse into the air stream and the amount of liquid is reduced and resulted in dropping of the phase boundary between the liquid and the air. The change of the height in boundary phase with time will allow the molar mass transfer rate to be determined. A slot in the heated block allows the phase boundary to be observed using a high definition microscope. This microscope produces high definition images onto a standard windows computer. The software provided with the microscope includes high accurate measurement and an automated time-lapse facility either as video or multiple still images. The schematic diagram of the gaseous diffusion is shown in Figure 1 & [17,18]. Three trials were performed for each case to be sure that the repeatability results could achieve.
Result and Discussion
Diffusivity of petroleum products
The diffusivity of light petroleum products in air was studied
Figure 1: Gas diffusion apparatus. (1) High definition USB microscope, (2) Measuring tool, (3) heater block, (4) capillary tube, (5) Air pumping to the capillary tube to allow diffusion of gasoline vapour in air to occur, (6) front display gauge and heater temperature controller, (7) power switch, (8) fan, to allow air through the capillary tube, (9) 25-watt electrical controller heater. Three trials were performed for each case to be sure that the repeatability results could achieve.

at different temperatures. The diffusivity is calculated according to Winkleman’s Method using equation (5). The plot of t/L-L0 vs. (L-L0 ) is shown in Figure 2 & 3 for gasoline and Jet fuel (A-1) at 50 oC.
Figure 2: t (s)/L-Lo Vs. L - Lo for gasoline 91 at 50oC.

Figure 3: t/ (L-Lo) vs. (L-Lo) for Jet Fuel A-1 at 50oC [19].

The densities of gasoline 91 and jet fuel A-1 were equal to 733Kg.m-3 and 805kg.m-3. The diffusivity coefficient can be measured by applying equations 6-9.
D (at 50 oC) for gasoline 91 = 2.16E-06m2s -1
D (at 50 oC) for Jet fuel A-1 = 5.56 E-07m2s-1
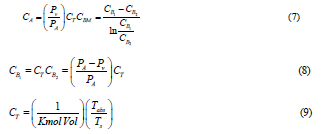
The vapor pressure of jet fuel (A-1) at different operation temperatures was measured by using Dry Vapor Pressure Equivalent method [DVPE]. The relationship between the vapor pressure and temperature is shown in Figure 2. The heat of vaporization was measured using Clausius-Clapeyron Equation

Where P1 and P2 are the vapor pressures at the corresponding operating temperatures of T1 and T2,
Δ𝐻𝑣𝑎𝑝 𝑖𝑠 the heat of vaporization of jet fuel (A-1). The vapor pressures were measured at 37.8oC and 45oC using ASMT D 5482 method and it was equal to 0.273 and 0.659KPa respectively. The heat of vaporization was calculated from equation (11) and it was equal to 100.574Kjoule/mole Figure 4.

Figure 4: Vapor pressure vs. temperature for Jet fuel ( A-1).

Where P in KPa and T is the absolute temperature, K. By increasing the temperature, more energy will be given to the molecules where they can diffuse faster in air. From Figure 4, it is clearly shown that as temperature increases the vapor pressure increases and the diffusivity of jet fuel A-1 in air will also increase Figure 5. The relationships between the diffusivities of light naphtha and different brands of gasoline with temperatures were plotted in Figure 6 & 7. The diffusivity of Jet fuel (A-1), light naphtha, and different gasoline brands as function of temperature is as follows:
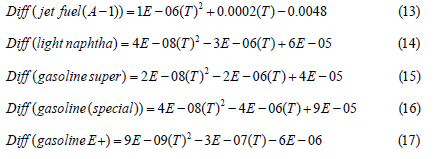
is operating temperature in oC.
Figure 5: Diffusivity vs Temperature of Jet fuel A-1.

Figure 6: Diffusivity with temperature for light naphtha.

Figure 7: Diffusivity with temperature for different brands of gasoline.

The diffusivity is expected to have proportional relationship with vapor pressure and temperature. According to Fick’s second law:

The density has an inverse relationship with diffusivity. This can be explained by molecular weight since a higher molecular weight results in higher mass (heavy material); thus, higher density and longer time for diffusion. This means that the higher the density, the lower the diffusivity. As the distance increases between the introduced gas and host gas, the longer time is taken for diffusion and less diffusion will occur per time. This is in agreement with equation 2. From equation (4), it is proven that D 1ρ∝ . In other words, this means that the diffusivity is inversely related to the distance between jet fuel vapors and airflows. Same conclusion can be reached with other light oil products. The diffusivities of gasoline at different temperatures are shown in Figure 4 [19,20]. From Figure 4, high diffusivity coefficient was achieved at high temperature. The diffusivity of gasoline (E+) was increased by 76.77 % with increasing temperature from 50 oC to 60 oC. It is also clearly shown that the diffusivity coefficient of gasoline is related to the octane number. The higher the octane number of gasoline, the slower the burn rate, the greater the resistant to auto-ignition or knock and the lower diffusivity at the same temperature. This is encouraging the refineries to produce higher octane rating gasoline and especially in harsh environment weather. Same work was performed for naphtha. The diffusivity of naphtha as function of temperature is shown in Figure 8. The diffusivity coefficient of light petroleum products is shown in Figure 9 & 10.
Figure 8: Diffusivity of different light petroleum products with air at 50oC.

Figure 9: Densities of light petroleum products.

Figure 10: Change of Diffusivity of gasoline in air with octane number at 50oC.

These results are in agreement with diffusion theory, the lower the densities the higher diffusivities in air. This means that naphtha will diffuse faster than gasoline and jet fuel in air, i.e the speed of polluted area with naphtha hydrocarbons will be bigger and this will definitely cause an environment risk to all people and especially if it is in closed or unventilated areas.
Diffusivity of gasoline-ethanol blends
The addition of ethanol to gasoline to make biofuel and become a worldwide tendency to reduce CO2 emissions to the atmosphere and increasing gasoline octane rating making it a very knock resistance fuel. Most of the countries accepted to add ethanol up to 20% (E20). The main concern of adding more than 20% ethanol is the increasing in emission of volatile organic compounds, which may have high potential ozone formation [21]. Vapor pressures of ethanol-gasoline blends are used to evaluate the enthalpy of vaporization of the blend [22]. Partial molar values can also be determined. The diffusivity of gasoline (91 free of ethanol) and gasoline-ethanol blends at different volume % of ethanol was determined. The vapor pressure of the blends as function of % by volume of ethanol was plotted in Figure 11. The vapor pressure was decreased with increasing amount of ethanol. The relation between the vapor pressure and % added ethanol is as follows:

Figure 11: Vapor pressure with volume % ethanol.

This figure is concise with [22] from about 4% by volume ethanol added. Reference [22] showed an increase in vapor pressure from up to about 4 % ethanol added and then decreasing in vapor pressure with % ethanol added and they showed that the enthalpy of vaporization is increased with molar % of ethanol added assuming that the molecular weight of gasoline is 100 g/ mole. Although the vapor pressure showed a maximum trend at 20% ethanol-gasoline blend due to the positive azeotrope [23]. The trend showed an increase in vapor pressure up to 20% ethanol and then the value is decreased gradually and showed to be flattening out between 30% and 60%. It is increasing again after 60% ethanol.
The density of gasoline-ethanol blend is increasing with the increasing % of ethanol added. This is shown in Figure 12. The enthalpy of vaporization is an important parameter to show the performance of spark ignition engines. The high value increases the charge cooling effect and resulted in improvement in volumetric efficiency and a higher compression ratio can apply because there is a lower temperature at the start of compression [24]. This work showed that the increasing value of enthalpy of vaporization has an adverse effect on the particulate matter (PM) emissions. This is related to the less homogeneity of air fuel mixture. The lower calorific value (LHV) of gasoline- ethanol blend is the heat evolved when a unit weight of the fuel is completely burnt and water vapor leaves with the combustion products without being condensed. The lower caloric value of the gasoline-ethanol blend is shown in Figure 13.
Figure 12: Density of gasoline-ethanol blend with % ethanol.

Figure 13: Low calorific value of gasoline-ethanol blend.

The fuel consumption is shown an increasing with % ethanol added [25]. This may be due to the increasing of densities of blend and decreasing of calorific value of blend. The diffusion coefficient of gasoline-ethanol blend at 50 oC is plotted in Figure 14 [26,27].
Figure 14: Changes in diffusivity of gasoline with % by volume ethanol at 50oC [26].

The diffusion coefficient of gasoline-ethanol blend as a function of % added ethanol is as follows:

It is believed that the diffusivity of ethanol–gasoline blend is increased at 20% ethanol. It is in concise with the work of other authors that the maximum allowable ethanol is 20 vol % because above this value more diffusion in air will occur which may contaminate the polluted area of air. The addition of ethanol is increasing the vapor pressure of the blend and above 20% of ethanol addition may leads to vapor lock in fuel line of the engine and this will reduce the performance of the combustion process of the fuel. The diffusivities of gasoline-ethanol blends will increase with temperature for a f give blend Figure 15.
Figure 15: Diffusivity of E 10 with temperature.

Human health due to the diffusion of petroleum products in air:
The main concern of the above diffusivity results of petroleum products in air and the relationship between the diffusivity and temperature on human health is investigated. The light petroleum products will diffuse more rapidly in air at higher temperatures. This means that the affected area from the diffusion will become bigger with time i.e., the mobility of polluted hydrocarbons will be faster in air. It is believe that diffusivity, along with other parameters, are required inputs to some environmental transport or risk assessment models. The literature values of pure hydrocarbons are available at certain temperatures as shown in Table 5 but the literature values of diffusivity coefficients of light oil products are unavailable.
Table 5: Diffusivity of pure hydrocarbons at 25oC [27].

When parameter values are unavailable, either for unusual chemicals, or for temperatures not reported in the literature, a calculated value may be useful. EPA showed two versions of calculating or estimating water and air phase diffusivity, which is available as inputs for benzene, toluene, ethyl benzene, and xylenes (BTEX). The second version requires generation of input parameters for the chemicals of interest. Ethyl benzene is highly flammable colorless liquid with gasoline like odor. The exposure is limited to 100ppm for 8-hour working day. It is classified as a carcinogenic material. The short-term effects include throat, eye sensitivity, and dizziness. It is released into the air due to the burning of coal, gas and oil. Xylene has acute toxicity and it is highly flammable. Short-term exposure includes headaches, dizziness, nausea, vomiting, weakness, irritability and reductions in reaction times. Long-term exposure may lead to headaches, irritability, insomnia, agitation, depression, tiredness, impaired concentration, tremors and even short-term memory loss. Toluene exposure leads to tiredness, weakness, confusion, memory loss, loss of appetite, nausea, hearing loss, vision loss including that of color and drunken like behavior and actions. The health risk from the exposure of benzene in petroleum refinery was studied [28]. Many exposure levels were evaluated. The result showed a potential cancer risk for exposure levels and the higher cancer risk is with higher exposure limits.
Naphtha had the highest diffusivity coefficient among other light oil products. It is toxic material. The toxicology had been reported the following accidental or intentional dermal, oral, parental and inhalation exposure [29]. The effect of naphtha exposure in relation to kidney function was also reported [30-36]. Exposure to naphtha may also give rise to irreversible chronic health effects. Emission control of naphtha vapor in air is very important and needs to be sure that the concentration of naphtha exposure is below the allowable exposure limit. The toxicology of naphtha as well as other oil products comes from the hydrocarbons present in these products such as benzene, toluene, xylene, etc. The concentrations of these compounds in light oil products are shown in Table 6.
Table 6: BTEXN content in light oil products, wt% [31-34].

The petroleum contamination is regarded as one of the major environmental problems in transportation, industrial, agricultural and other sectors. The accidental releases of hydrocarbons to the environment cause a major problem to the environment [36]. It is known that the inhaling or swallowing large amounts of gasoline can cause death [37]. Gasoline vapour may cause irritating to the eyes and lungs. Prolonged skin exposure to gasoline may cause variety of skin conditions. Long-term exposure to high levels of gasoline is associated with a range of disorders affecting the nervous system [38].
The amount of benzene, toluene, ethyl benzene and xylenes in gasoline can varied from few percent to more than 20%, depending on the refinery process. Recent regulations in the United States limits the average amount of benzene in gasoline to be less than 1% in order to reduce health effects from exposure to vapor and exhaust. Benzene is human carcinogen. It was found that 0.7% of benzene in vapor phase can come from 2% of benzene in liquid phase. Vapors concentrations of suspended volatile fuel are depending upon weather conditions [39].
Automobile refueling is one of the main sources of benzene vapors production. It has severe health effect on workers and nearby staff [40]. The exhaust from jet fuel A-1 contains dangerous compounds, including black carbon, particle-bound polycyclic aromatic hydrocarbons and ultrafine particles [41]. Elevated levels of polycyclic aromatic hydrocarbons (PAH) are found in the areasurrounding airport. Exposure to PAH have been associated with increased carcinogenic risk, disruption of the hormonal balance in adult and reproductive abnormalities with exposure during pregnancy [42]. Infants were more susceptible than adults to the harmful effects of environmental toxicants. Naphthalene, a suspected carcinogen, can comprise up to one-percent of these fuels. Middle distillate fuels do, however, include a minor but important component of lighter and more volatile aliphatic compounds and, to a lesser extent, aromatic compounds. The aliphatic compounds are not surprisingly dominating vapors emitted from these fuels under ambient conditions [43]. During the refueling process of gas station, gasoline will evaporate and emitted from the tank to the atmosphere.
This oil vapor is emitted from tanks, tankers or truck tanks into the air. Oil vapor emission has serious harmful effects on people and the environment [44]. The main factor to control the emission of these products to the atmosphere is by eliminating the leaks of oil products and their vapors. Ventilation of the close area and monitoring the concentration of these hydrocarbons has definitely a significant effect on the health of the people in this polluted area. For gasoline-ethanol blend, ethanol content up to 10% can served as a fuel oxygenate which have more combustion of gasoline and reducing carbon monoxide emissions [45]. There is no further observed reduction with 15% ethanol but there is an increasing emission with 20% ethanol.
E10 is reducing the emission of inhalation carcinogens benzene and 1,3-butadiene. The environment- working group reached to the following conclusion:
A. The higher % of ethanol in the gasoline blend may damage non-road engines and the emission control systems.
B. High health risk is associated with the emissions of harmful materials from higher % of ethanol from air pollution.
C. Higher % of ethanol causes high fuel consumption and requires engine modification otherwise it will reduce the lifetime of the engine.
Conclusion
The diffusion of light oil products through air in all areas near petrol stations and airport area is a natural phenomenon. It has significant effects on the comfort condition of people. The diffusivities of petroleum products such as naphtha, gasoline, and Jet fuel A-1 can be categories as follow:

The diffusivity of gasoline in air is related to the octane rating. It was found that the higher diffusivity is the lower octane ratings. High diffusivity can be achieved with high climate temperature. It is believed that the diffusivity coefficient of petroleum products needs to be studies as a human health impact in contaminated areas and especially in close areas.
Nomenclature
D = Diffusivity (m2 s-1)
CA = saturation concentration at interface (mol.m-3)
L = effective distance of mass transfer (m)
CBM = Logarithmic mean molecular concentration of vapor (mol.m-3)
CT = Total molar concentration (mol.m-3) = CBM+CA
M = molecular weight of jet fuel (0.180kg.mol-1)
ρ = liquid density (kg.m-3)
J =Diffusion flux
Yi = mass fraction
P1 and P2 are vapor pressures at operating temperatures of T1 and T2
Δ𝐻𝑣𝑎𝑝 = latent heat of vaporization (joule.mole-1)
Ea = activation energy for diffusion in water (in joule.mole−1)
R = Universal gas constant (joule mole−1 K−1)
P = Pressure in KPa
T = temperature in Kelvin
References
- Ivan Funga WH, Vivian Tam WY, Tommy YL, Lori Lua LH (2010) Developing a risk assessment model for construction safety. International Journal of Project Management 28(6): 593-600.
- Udonwa NE, Uko EK, Ikpeme BM, Ibanga IA, Okon BO (2009) Exposure of petrol station attendants and auto mechanics to premium motor sprit fumes in Calabar, Nigeria. Journal of Environmental and Public Health pp. 1-5.
- Smith LB, Bhattacharya A, Lemasters G, Succop P, Medvedovic M (1997) Effect of chronic low-level exposure to jet fuel on postural balance of US air force personnel. J Occup Environ Med 39(7): 623-632.
- Zhu L, Chen J, Liu Y, Geng R, Yu J (2012) Experimental analysis of the evaporation process for gasoline. Journal of Loss Prevention in the Process Industries 25(6): 916-922.
- Fingas MF (1997) Studies on the evaporation of crude oil and petroleum products: I. the relationship between evaporation rate and time. Journal of Hazardous Materials 56(3): 227-236.
- Okamoto K, Watanabe N, Hagimoto Y, Miwa K, Ohtani H (2009) Changes in evaporation rate and vapor pressure of gasoline with progress of evaporation. Fire Safety Journal 44(5): 756-763.
- Okamoto K, Watanabe N, Hagimoto Y, Miwa K, Ohtani H (2010) Evaporation characteristics of multi-component liquid. Journal of Loss Prevention in the Process Industries 23(1): 89-97.
- Fingas MF (1998) Studies on the evaporation of crude oil and petroleum products II. Boundary layer regulation. Journal of Hazardous Materials 57(1-3): 41-58.
- Welty J, Wicks C, Wilson R (1984) Fundamentals of momentum heat and mass transfer. In: (3rd edn), John Wiley & Sons, USA.
- Cussler EL (1984) Diffusion & mass transfer in fluid systems. Cambridge University Press, UK.
- Treybal RE (1980) Mass transfer operations. In: (3rd edn), chapter 2, McGraw-Hill, USA.
- Gasoline, octane and engine knock (2006), USA.
- Adnoc specification (2013), UAE.
- Balabin RM, Syunyaev RZ, Karpov SA (2007) Molar enthalpy of vaporization of ethanol-gasoline mixtures and their colloid state. Fuel 86(3): 323-327.
- Safety Data Sheet Jet A-1 version (2005), Netherlands.
- Industrial fuel and solvents (2014), India.
- Armfield gaseous diffusion apparatus manual, ArmField Limited, UK, issue 10.
- Gaseous diffusion coefficients apparatus instruction manual (1999), UK, 13: A1-A6.
- Zubaidy IA, Abdelmalik A, Abdallah O, Shamsi MA, Abdellatif S, et al. (2013) Diffusion coefficients of UAE jet fuel in air using harsh environment condition. IJBEES 2(1): 2277-4394.
- Zubaidy IA, Alsanea O, Ibrahim S, Saeed Y, Turki R, et al. (2013) Diffusion coefficients of UAE gasoline as inputs to some environmental transport or risk assessment. JOCET 1(1): 49-51.
- Tibaquirá JE, Huertas JI, Ospina S, Quirama LF, Niño JE (2018) The effect of using ethanol-gasoline blends on the mechanical, energy and environmental performance of in-use vehicles. Energies 11(1): 221.
- Balabin RM, Syunyaev RZ, Karpov SA (2007) Molar enthalpy of vaporization of ethanol-gasoline mixtures and their colloid state. Fuel 86(3): 323-327.
- Tibaquirá JE, Huertas JI, Ospina S, Quirama LF, Niño JE (2018) The effect of using ethanol-gasoline blends on the mechanical, energy and environmental performance of in-use vehicles. Energies 11(1): 221.
- Chen L, Stone R (2011) Measurement of enthalpies of vaporization of isooctane and ethanol blends and their effects on PM emissions from a GDI Engine. Energy and Fuels 25(3): 1254-1259.
- Barakat Y, Awad EN, Ibrahim V (2016) Fuel consumption of gasoline ethanol blends at different engine rotational speeds. Egyptian Journal of Petroleum 25(3): 309-315.
- Zubaidi IA, Enns C, Govindan SM, Reiger M, Li T (2019) Diffusion coefficient of ethanol - gasoline blends in air. 6th International Conference of Fluid Flow, Heat and Mass Transfer (FFHMT'19), Ottawa, Canada.
- Yaws CL (1995) Handbook of transport property data. Houston, Tex: Gulf Publishing Company, USA.
- Edokpolo B, Yu QJ, Connell D (2015) Health risk assessment for exposure to benzene in petroleum refinery environments. Int J Environ Res Public Health 12(1): 595-610.
- Roberge RJ, Crippen DR, Jayadevappa D, Kosek TL (2001) Acute myocardial infarction and renal failure following naphtha ingestion. J Emerg Med 21(3): 243-247.
- Hanachi P, Hashim Z, Suhimi NM (2008) The association between kidney function and naphtha exposure among workers in the tyre industry. Songkla Med J 26(6): 573-579.
- Potter TL, Simmons KE (1998) Total petroleum hydrocarbon working group series: Volume 2: composition of petroleum mixtures, Association for environmental health and sciences: Amherst Scientific Publishers, USA.
- Brewer R, Bailey L, Nagashima J (2012) Field investigation of the chemistry and toxicity of TPH in petroleum vapors: Implications for potential vapor intrusion hazards. Hawaii Department of Health, Office of hazard evaluation and emergency response, USA.
- Kelly MJ, Brewer R, Rigby M (2012) Use of TPH carbon range data to guide remediation of petroleum contamination for vapor intrusion, remediation of chlorinated and recalcitrant compounds. 8th International Battelle Conference, USA.
- lto S (2003) Analysis of aromatic hydrocarbons in gasoline and naphtha with the Agilent 6820 series gas chromatograph and a single polar capillary column. Agilent Technologies Inc., USA.
- American Petroleum Institute, Petroleum HPV testing group (2010) Kerosene-jet fuel category assessment document. USA.
- Fowzia A, Fakhruddin ANM (2018) A review on environmental contamination of petroleum hydrocarbons and its biodegradation. Int J Environ Sci Nat Res 11(3): 63-69.
- Kim SW, Lee YM, Lee K, Park JS, Park J, et al. (2016) An unexpected death related to accidental gasoline inhalation. The Korean Journal of Legal Medicine 40(3): 83-87.
- Gasoline (Mixture), Agency for toxic substances and disease registry (2020), CAS 86290-81-5 and 8006-61-9; UN 1203, USA.
- Wouters MA (2006) Overall fuel hazard guide for south Australia. Bushfire Conference Brisbane, Life in A Fire-Prone Environment: Translating Science into Practice, Australia.
- Udonwa NE, Uko EK, Ikpeme BM, Ibanga IA, Okon BO (2009) Exposure of petrol station attendants and auto mechanics to premium motor sprit fumes in Calabar, Nigeria. Journal of Environmental and Public Health pp. 1-5.
- US oil and refining Co (2009) Material safety data sheet -Jet fuel, MSDS 941, USA.
- Russell DM, Thomas L, Rusk FC, Marques SD, McGuire D (2009) Occupational health and safety assessment of exposure to jet fuel combustion products in air medical transport. Prehosp Emerg Care 14(2): 202-208.
- Castro A, Chen L, Edison B, Huang J, Mitha K, et al. (2010) Santa Monica airport health impact assessment (HIA) UCLA CHAT PGY-2, USA.
- Huang W, Bai J, Zhao S, Lv A (2011) Investigation of oil vapor emission and its evaluation methods. Journal of Loss Prevention in the Process Industries 24(2): 178-186.
- Naidenko OV (2009) Ethanol-gasoline fuel blends may cause human health risks and engine issues. Environmental Working Group, USA.
© 2020 Isam Al Zubaidi. This is an open access article distributed under the terms of the Creative Commons Attribution License , which permits unrestricted use, distribution, and build upon your work non-commercially.
Editor In Chief


.jpg)


Signup for Newsletter

Quick Links
 Editorial Board Registrations
 Submit your Article
 Refer a Friend
 Advertise With Us
Our Recent Edition

.jpg)


Top Editors


.jpg)


.bmp)
.jpg)
.png)
.jpg)


.jpg)


.png)

.png)


.png)


Financial Support

Sponsors

Latest e-Books

Latest Video

 a Creative Commons Attribution 4.0 International License. Based on a work at www.crimsonpublishers.com.
Best viewed in
a Creative Commons Attribution 4.0 International License. Based on a work at www.crimsonpublishers.com.
Best viewed in