- Submissions

Full Text
Progress in Petrochemical Science
Assessment of Carbonyl Compounds in Exhaust Gases from Spark and Compression Ignition Engines in Prague
Erlisa Baraj1 and Ivan Víden2*
1 Department of Gaseous and Solid Fuels and Air Protection, Czech Republic
2 Department of Analytical Chemistry, University of Chemistry and Technology, Czech Republic
*Corresponding author: Ivan Víden, Department of Gaseous and Solid Fuels and Air Protection, Czech Republic
Submission: January 31, 2019Published: March 13, 2019

ISSN 2637-8035Volume3 Issue1
Abstract
Determination of carbonyl compounds emitted from car exhausts, such as formaldehyde, acetaldehyde, acetone, acrolein, propionaldehyde and crotonaldehyde is vital in outside air of every highly populated city-center including Prague. The sampling site was a highly car frequented and densely populated Prague street. Two types of vehicles from the second largest car manufacturer (Hyundai Motor Company) were selected for the assessment of carbonyl compounds emission. Some of the emitted components from fuel combustion are classified as carcinogenic and/or mutagenic to humans in addition to having other harmful environmental effects. Carbonyl compounds were sampled using 2,4-Dinitrophenylhydrazine sorption tubes. For the quantitative determination of the aforementioned compounds HPLC separation and ultraviolet detection as recommended in method TO 11A was applied. For comparative purposes, HPLC-MS separation and detection was applied as well. Gaseous standards of carbonyl compounds are necessary for the assessment of the accuracy of each method. Production of carbonyl compounds gaseous standards and tests regarding their stability were performed.
Keywords: Carbonyl compounds; Emission; 2-4 Dinitrophenylhydrazine; Exhaust; Air
Aims and Background
Air quality is affected by both biogenic and anthropogenic sources of atmospheric contamination [1]. Petroleum products from human activity, especially diesel and gasoline used mostly for transportation purposes, are the source of most Volatile Organic Compounds (VOCs) occurring in atmosphere [2]. As a result, air pollution is the often-stated reason for special measures that have the objective to control motor vehicle emissions [3-5].
Fuel combustion leads to the emission of a variety of pollutants that can be categorized as regulated and unregulated. Among the regulated air pollutants belong the Nitrogen Oxides (NOx), Carbon Oxide (CO), total hydrocarbons and Particulate Matter (PM) [6]. The unregulated pollutants include Polyaromatic Hydrocarbons (PAH), Carbon Dioxide (CO2), carbonyl compounds such as aldehydes, where primarily listed are formaldehyde and acetaldehyde [7,8]. However, many carbonyl compounds such as formaldehyde, acetaldehyde and acrolein, have been receiving regulatory attention, due to their consequences as eye irritants, toxic air contaminants, mutagens and carcinogens [9-13].
Transportation is the heaviest air quality burden and the main reason for special control measures [3,4]. Although the majority of emitted pollutants are similar, their differences depend on the exact composition of the fuel and details of combustion conditions [14-16]. The most emitted aldehydes from gasoline, diesel or even biofuel combustion are formaldehyde followed by acetaldehyde [17,18]. Other carbonyl compounds emitted from gasoline engines are C3-Aldehydes plus acetone and benzaldehyde, making up for around 29% and 5% of carbonyl emissions, respectively [19]. From the exhaust of diesel engines outside of formaldehyde and acetaldehyde, acrolein is the third most emitted carbonyl compound which can be mentioned [20,21]. Further most emitted aldehydes cited are propionaldehyde, n-pentanal, crotonaldehyde, isobutanal and benzaldehyde [22,23].
Carbonyl compounds are toxic to living organisms. Therefore, their characterisation and monitoring is important to pollution control, not only due to their health effects [24,25] but also due to their crucial importance in atmospheric chemistry [26-28]. When emitted into the atmosphere some carbonyl compounds produce very reactive and harmful free radicals, ozone and peroxyacyl nitrates. In the presence of NOx, predominantly NO, emitted from combustion sources such as vehicle exhaust in urban areas, aldehydes and other VOCs contribute to the photochemical ozone formation and other photochemical air pollution problems [29-31].
Having concerns about air quality of densely populated cities like Prague, this work focuses on determining carbonyl emissions from vehicle exhausts and their concentration in urban atmosphere, sampled in a highly frequented Prague street. Two types of commonly used passenger cars were chosen. In Czech Republic the leading car manufacturing company is Skoda Auto. However, very attractive are also the vehicles of Hyundai Motor Company, which is the second largest car manufacturer in the Czech Republic. The chosen vehicles were the 2009 model diesel fuelled Hyundai i30 cw and the gasoline fuelled Hyundai 2000 Accent.
Identification and quantification of carbonyl compounds via DAD has been carried out. Additional MS analysis was applied, to verify if a lower Limit of Detection (LOD) could be achieved and to compare the sensitivity of both methods.
Experimental
Sampling and analysis were performed according to US EPA method TO-11A [32]. The determination of formaldehyde and other carbonyl compounds has been done using active sampling with coated solid sorbents followed by High Performance Liquid Chromatography (HPLC) analysis. Quantification based on the comparison with standards of carbonyl compounds was carried out. As recommended by TO-11A method, Ultraviolet (UV) detection after HPLC separation has been conducted. Mass Spectrometric (MS) detection was also performed, as comparative method for analysis.
Standard solution preparation
Standard solutions were prepared using liquid standards (TO11A 6 Component Carbonyl-DNPH Mix, 15μg/ml in acetonitrile, Sigma-Aldrich Chemie GmgH, Germany) containing six 2,4-DNPHhydrazone derivatives of formaldehyde, acetaldehyde, acetone, acrolein, crotonaldehyde, and propionaldehyde. Working calibration standards at different concentrations were generated by diluting the stock solution in ultra clean acetonitrile (ACN).
Urban atmosphere and vehicle exhaust carbonyl compounds sampling and sample preparation
Sampling of carbonyl compounds was performed using 2,4- DNPH (ORBO-555 Sorbent Tube 300/150mg LpDNPH, Supleco, USA) acidified with hydrochloric acid. Sampled aldehydes and ketones have reacted with 2,4-DNPH (2,4- dinitrophenylhydrazine) to form stable hydrazone derivatives [32].
The same sampling technique was used to collect carbonyl compounds from both urban atmosphere and vehicle exhaust gases. Outside air sampling was performed in a highly frequented street in Prague 6, Czech Republic. The sampling technique involved passing a stream of air through two separate sorption tubes at a flow rate of about 11/min. The active flow of air stream through the sorption tube was achieved using a diaphragm pump. Sampling was carried out for 40 min and was repeated twice yielding a total of 4 samples. An average of 180 vehicles, counted by volunteers, crossed the street during each sampling.
Vehicle exhaust gas sampling was carried out for both diesel and gasoline vehicles the same way. Sampling was carried out by exposing the tubes for 10min to the exhaust gases. The exhaust gases were directly directed to the sampling devices. Active sampling was achieved also in this case using a diaphragm pump. Two commonly sold passenger cars in Czech Republic were chosen for exhaust gas sampling. The gasoline fuelled vehicle was Hyundai 2000 Accent (1495cc volume; 4 cylinders in line with 12 valves; compression ratio 10:1; 75.5mm bore; 83.5mm stroke; maximum power 69kW at 5500rpm; multi-point injection fuel system). The diesel fuelled vehicle was the 2009 model Hyundai i30cw (1582cc volume; 4 cylinders in line with 16 valves; compression ratio 17.3:1; maximum power 85kW at 4000 rpm; 82mm bore; 93.5mm stroke; common rail direct injection mode intercooled with variable geometry turbo). The exposed sorption tubes were extracted within minutes by 5ml of ultra clean ACN. The extracts were then diluted, at a ratio of 1:1 with water, for a better chromatographic separation.
Gaseous standards generation, sampling and sample preparation.
In order to compare the qualitative and quantitative response of DAD and MS detection a set of gaseous carbonyl standards was created. The generated gaseous samples in canisters (SilicoCan, maximum pressure 40 psig, Restek, USA) contained formaldehyde, acetaldehyde, acetone, propionaldehyde and crotonaldehyde. Canisters had an internal volume of 6 litres and were pressurized to 376.6kPa. Each carbonyl compound was prepared at a precisely known concentration of about 50μg/m3 in nitrogen.
Standards were generated in three canisters filled with N2 and having relative humidity of 25%, 50% and 75% respectively. Calculated volumes (about 3.5μl) of pure formaldehyde, acetaldehyde, acetone, propionaldehyde and crotonaldehyde were injected into a 250ml bottle with an atmosphere of 50% relative humidity. This level of humidity was achieved by drying the bottle at 105 oC than filling it with dry N2 and subsequently injecting of a previously calculated volume of water. The volume of injected water and injected carbonyl compounds was calculated according to Antoine equation [4]. After water injection the bottle was tempered for 30min in an oven at 50 °C. The calculated volumes of carbonyl compounds were then injected individually into the bottle that was kept during the whole process at 50 °C Subsequently, the bottle was tempered for 30min more at 50 °C. After tempering, 100μl of the generated vapours were injected into the canisters with the help of in-flowing N2.
After water injection, the bottle was tempered for 30min in an oven at 50 °C. The calculated volumes of carbonyl compounds were then injected individually into the bottle that was kept during the whole process at 50 °C. Subsequently, the bottle was tempered for 30min at 50 °C. After tempering 100μl of the generated vapours were injected into the canisters with the help of in-flowing nitrogen.
Canisters with nitrogen atmospheres of 25%, 50% and 75% relative humidity were prepared by filling each of the canisters with dry N2 afterwards a calculated volume of water was injected and then pressurized up to 376.6 kPa with N2 making up for a total volume of 22.3 l. During the pressurization 100μl of the mix of vaporized standards were injected into the nitrogen stream. Calculations of the injected water volume were done according to Antoine equation, similarly to the calculations of water for the creation of 50% relative humidity for the 250ml bottle. The injected water volumes were 34, 67 and 100μl for the 25, 50 and 75% relative humidity canisters respectively.
In order to test gaseous standard stability, sampling was performed in three different days during the course of one week. The first sampling of the prepared standards was carried out 24 hours after preparation, hereinafter referred to as day 1. Gaseous standards were sampled again 48 hours after preparation and one week after preparation, hereinafter referred to as day 3 and day 7, respectively. A precisely measured volume of about 41 was drawn from the canister through the 2,4-DNPH sorption tubes. Flow was measured using wet gas meter. Gaseous standard flow was about 11/min. Sorption tubes were extracted by 5ml of ultra clean ACN. The extract was diluted with water at a 1:1 ratio for better chromatographic separation. Recovery percentage was calculated as the ratio of the analysed gaseous standard concentration (ci) to the expected theoretical concentrations after each sampling.
Calibration curves and sample analysis
Prior to sorption tubes analysis, calibration curves with the liquid standards were always performed. Calibration curves were determined for both detection methods, UV - Diode Array Detector (DAD) and MS. Separation was performed by HPLC (HPLC TSQ Quantum Access Mas, Thermo Scientific, USA). This scheme allows direct injection of an aliquot of the sample to the chromatographic column. The separation was performed using a 150x30mm C18 reversed-phased column (Phenomenex, USA). Column temperature was maintained at 22 °C. The analyses were carried out isocraticaly, the optimal mobile phase volume ratio CH3OH: H2O was found to be 70:30. The eluent flow rate was 400μl/min, sample injection volume was 20μl, and stop time was 16min.
According to the recommendation of TO11A [32] method the wavelength of the UV-DAD detector was set to 360nm. MS detection was performed in the MS-APCI and MS-ESI ionization, both in the negative (-) mode. When using APCI (-) ionization the following conditions were applied: nebulizer gas was nitrogen, probe voltage was -4kV, APCI probe temperature was 300 °C vaporizer temperature was 400 °C. During ESI (-) nitrogen was used as the curtain, nebulizer and turbo gas. Mass spectra were acquired in negative mode with a spray voltage of -2.5kV. The source temperature was 250 °C. After successful ionization, optimization was applied by selected reaction monitoring (SRM). Scanning from m/z=200 to m/z=300 was applied. The operating conditions applied during MS-ESI (-) detection are depicted in Table 1.
Table 1:Operating conditions for MS-ESI (-) analysis of the carbonyl-DNPHs.

Statistical assessment
A statistical comparison of the means of two populations, obtained from the measurements of the same samples, but with two different techniques, was performed. For estimation of such difference the t-test could be used, which checks if results of the two sets change significantly between each other. In the case when no certified samples are available the conclusion drawn helps only to find out if there is a significant difference between the mean values obtained with two different techniques, but not which one is more accurate. The null hypothesis adopted was that the means are not significantly different [33].
Samples were analysed under the same separation and detection conditions applied for calibration curves. Individual compound determination for comparative purposes has been carried out using both UV-DAD and MS detection.
Result and Discussion
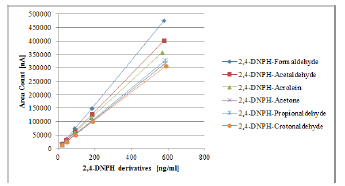
By application of UV-DAD linear response for all hydrazone derivatives was obtained, with a correlation factor of at least 0.999. Calibration curves for UV-DAD detection are depicted in Figure 1. Mass spectrometric detection when applying APCI (-) ionization mode showed no response. Most probably the mobile phase used during HPLC separation, mixture of methanol-water, is not suitable for ionization on the APCI mode. However, it should be noted that the most commonly used mobile phase for MS-APCI ionization is ACN and water mixture [34-36].
Figure 1:Calibration curves of 2,4-DNPHstandards with HPLC-DAD separation and detection.
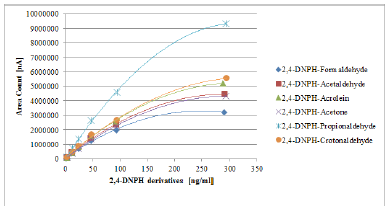
Ionization in the ESI (-) mode was successful. Moreover, conditions for carbonyl determination were optimized by SRM measurements. The results of standard calibration are depicted in Figure 2. The detector’s response was polynomial with correlation factors ranging from 0.997 to 0.999.
Gaseous standards recovery
The response from DAD detection was always linear as shown in Figure 1. The response from MS-ESI (-) detection was polynomial as shown in Figure 2. In Tables 2 & 3 carbonyl compounds concentrations and recovery for each of the sampling days, after HPLC-DAD and HPLC-MS-ESI (-) analysis, respectively, are depicted.
Table 2:Final concentrations of carbonyl compounds in the collected samples and percent recovery of the samples during the course of the week from the canisters containing 25, 50 and 75% of humidity after HPLC-DAD analysis.
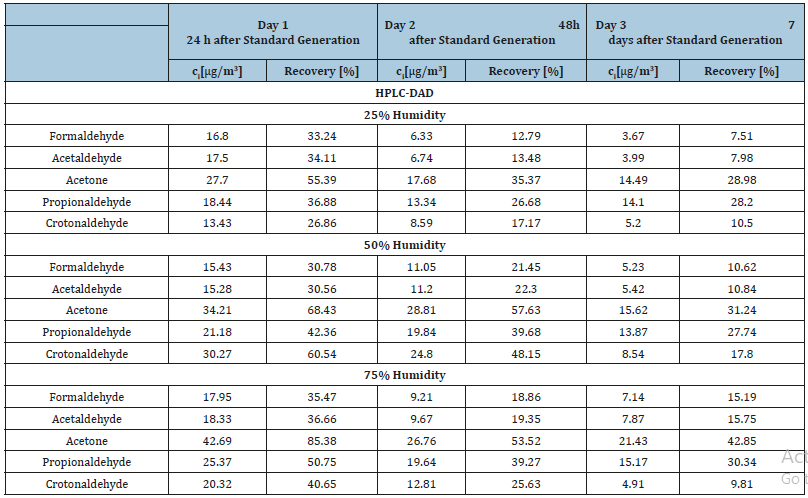
Table 3:Final concentrations of carbonyl compounds in the collected samples and percent recovery of the samples during the course of the week from the canisters containing 25, 50 and 75% of humidity after HPLC-MS-ESI (-) analysis.
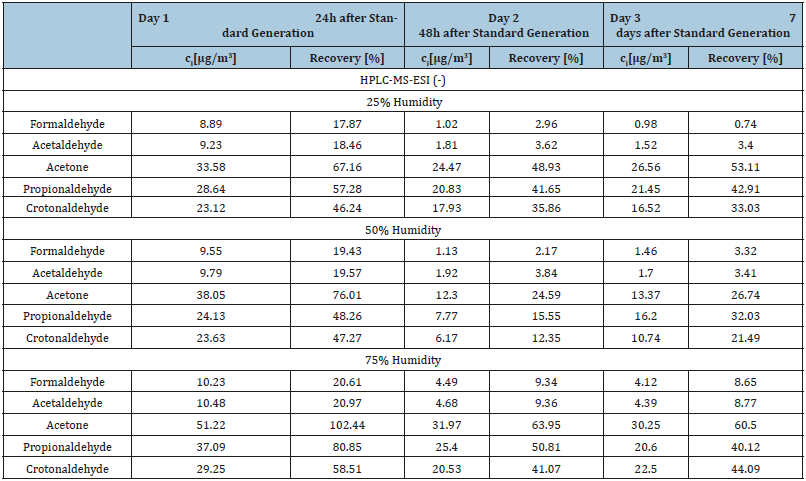
Figure 2:Calibration curves of 2,4-DNPH standards with HPLC-MS-ESI (-) separation and detection.
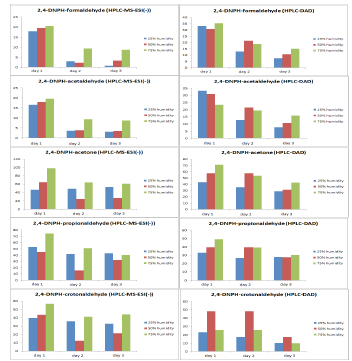
In Figure 3 recovery trend during the course of one week after standard preparation is depicted. From the final results it can be observed that the most appropriate level of humidity for the best recovery is 75% of humidity, while 25% is the worst. As it can also be observed in Figure 3 the general trend for all carbonyl compounds during the course of the week is a fall in recovery percentage. This trend indicates that the gaseous standards of carbonyl compounds are quite unstable.
Figure 3:The recovery [%] for each carbonyl compound after HPLC-DAD analysis (left) and HPLC-ESI (-) MS (right).
Concentration of carbonyl compounds in exhaust gases and urban atmosphere samples
Table 4:Final concentrations of carbonyl compounds in the collected samples from diesel and gasoline engines after HPLC-DAD separation and detection.

The concentrations of aldehydes from exhaust gases are depicted in Table 4, for DAD detection, and Table 5 for MS-ESI (-) detection. The most abundantly emitted carbonyl compounds are formaldehyde and acetaldehyde. From the emission of both engines’ diesel and gasoline, formaldehyde was the aldehyde encountered at the highest concentrations. This was confirmed by both DAD and MS-ESI (-) detection. From Tables 4 & 5 it is obvious that the levels of the emitted carbonyl compounds from the diesel engine are considerably higher compared to the emissions from the gasoline one.
Table 5:Final concentration of carbonyl compounds in the collected samples from diesel and gasoline engines after HPLC-MS-ESI (-) separation and detection.

During DAD analysis, acrolein was detected in the exhaust emissions from the diesel engine but not in the emissions from the gasoline engine. As emphasised by White [22] acrolein is the third most emitted carbonyl compound from diesel combustion. Other authors have indicated that acrolein and propionaldehyde do not represent any considerable part of gasoline combustion emissions [37].
After MS-ESI (-) detection of the same samples, formaldehyde and acetaldehyde appeared again as the predominant carbonyl compounds from the exhaust gases of both engines. However, in Table 5 we can observe that from the exhaust emissions of the gasoline engine both acrolein and propionaldehyde were detected at very low concentrations. These results indicate a much higher limit of detection when applying MS-ESI (-) detection compared to DAD detection.
Table 6 & 7 represent the final concentrations of the detected carbonyl compounds from urban atmosphere samples after DAD and MS-ESI (-) detection.
Table 6:Final concentrations of the detected carbonyl compounds from urban atmosphere samples after HPLC-DAD separation and detection.

Table 7:Final concentrations of the detected carbonyl compounds from urban atmosphere samples after HPLC-MS-ESI (-) separation and detection.

As expected, the levels of detected formaldehyde are considerably higher than those of acetaldehyde. However, a considerably higher concentration of acetone compared to the other two carbonyl compounds was found with both DAD and MS-ESI (-) detection. This deviation from the expected results can be related to contaminations from the surrounding environment, since acetone is one of the most commonly used solvents in the UCT. In addition, after MS-ESI (-) analysis acrolein and propionaldehyde at very low concentrations of averagely 0.06 and 0.04μg/m3, respectively, were detected. The detection of these two compounds by MS-ESI (-) is an additional indicator of the higher sensitivity of this method compared to DAD.
Statistical assessment
Two sets of results by two analytical techniques HPLC-DAD and HPLC-ESI (-) MS, were obtained. The results from the exhaust gases statistically compared between diesel and gasoline engine by two different techniques HPLC-DAD and HPLC-MS-ESI (-) are depicted in Table 8 & 9, respectively. As it can be observed in Table 8 the probabilities calculated for the detected compounds after DAD detection and MS-ESI (-) detection were 0.00052, 0.0258, 0.30697, 0.47933 and 0.38521 for formaldehyde, acetaldehyde, acrolein, acetone and propionaldehyde, respectively. From the results we can understand that the null hypothesis is rejected for the analysis of formaldehyde and acetaldehyde.
Table 8:Comparison of the mean of HPLC-DAD (A) and HPLC- MS- ESI (-) (B) analysis of the samples from the exhaust gases from a diesel engine.
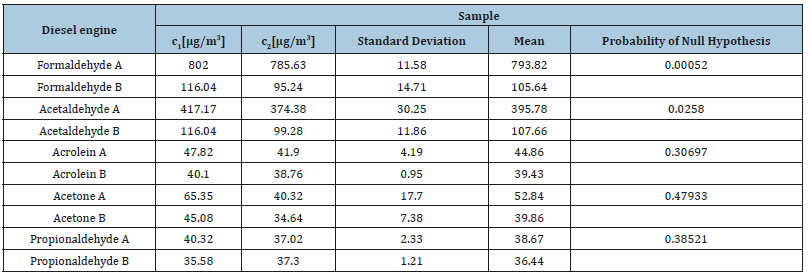
Table 9:Comparison of the mean of HPLC-UV (A) and HPLC-ESI (-) MS (B) analysis of the samples from the exhaust gases from a gasoline engine.

Therefore, the two techniques used for the determination of the carbonyl compounds produce results that differ significantly for formaldehyde and acetaldehyde. In the case of the analysis of the carbonyl compounds emitted from a gasoline engine the probabilities are 0.45, 0.34 and 0.96 for formaldehyde, acetaldehyde and acetone, respectively. This indicates that in this case the two techniques produce results that have no significant difference. Statistical results for the urban air samples are depicted in Table 10. The probabilities calculated for the three compounds detected by both methods in the street samples were 0.0014, 0.0081 and 0.015 for formaldehyde, acetaldehyde and acetone respectively, which means that the null hypothesis is rejected. On the other hand, results obtained by MS-ESI (-) are significantly more sensitive (observed were i.e. acrolein and propionaldehyde) although the quantitative curve was not linear as in the case of DAD.
Table 10:Comparison of the means of HPLC-DAD (A) and HPLC-MS-ESI (-) (B) analysis of the urban atmosphere.

Under such conditions it would have been very useful to assess the accuracy of the technique by using certified gaseous samples and comparing the results obtained by t-test technique. Unfortunately, certified samples do not exist (and probably never will) due to the instability of the carbonyl compounds, as was also evidenced in this work.
Conclusion
For the analysis of aldehydes and other carbonyl compounds present in ambient air or air samples from vehicles exhaust, the widely used method is their reaction with 2,4-DNPH. In case of unknown aldehydes MS is the only way to determine these species. The response of the calibration curves of the liquid working standards after UV detection was linear with correlation factors of at least 0.999. After MS-ESI (-) analysis the calibration curves had a polynomial response. MS-APCI (-) does not ionize the DNPHderivatives of the tested carbonyl substances when using MeOH: H2O a mobile phase.
The most suitable humidity percentage for gaseous carbonyl compounds standards was found to be 75% of humidity. Analyses show that carbonyl compound vapours created in canisters are not stable. Quite interesting in this work is the observation of a strong decrease in recovery percentage of carbonyl compounds during the course of one week after their preparation. This is the most probable reason why gaseous standards of carbonyl compounds are not commercially offered.
The identification and quantitative determination of carbonyl compounds in urban air and from vehicle exhaust was done according to norm US EPA TO 11A. In order to reach a lower LOD beside DAD detection MS-ESI (-) detection was also applied. Indeed, after MS ESI (-) analysis of urban air samples, acrolein and propionaldehyde at very low concentrations of averagely 0.06 and 0.04μg/m3, respectively, have been detected. Therefore MS ESI (-) detection proved to be more than one order of magnitude better than DAD analysis. From the analysis of air samples in Student ska Street in front of UCT’s building, acetone was the carbonyl compound found at the highest concentration. This disclosure can be related to the contamination from the vicinity, since acetone is one of the most commonly used solvents in the UCT. Disproportion between the concentration of formaldehyde and partly acetaldehyde by UV and MS detection is subject to further investigation.
From the sampling of the emitted exhaust gases from both diesel and gasoline engines, formaldehyde and acetaldehyde were the most abundantly emitted compounds. The levels of emitted formaldehyde by the diesel engine were considerably higher than those emitted by the gasoline engine. In the emissions of the diesel engine the third most abundant compound was acrolein, followed by propionaldehyde. Other detected compounds of the gasoline engine were acetone and during MS-ESI (-) detection acrolein and propionaldehyde, at very low concentrations.
References
- DA Vallero (2008) The changing face of Air Pollution. Fundamentals of Air Pollution Vallero DA (Ed.), Burlington, USA.
- Wang G, Cheng S, Wei W, Zhou Y, Yao S, et al. (2016) Characteristics and source apportionment of VOCs in the suburban area of Beijing, Atmos Pollut Res, China 7(4): 711-724.
- Small KA, Kazimi C (1995) On the Costs of Air Pollution from Motor Vehicles. J Transp Econ Policy 29(1): 7-32.
- Lee J, Park B, Malakorn K, So J (2013) Sustainability assessments of cooperative vehicle intersection control at an urban corridor. Transport Res C-Emer 32: 193-206.
- Dimitrovski M, Sapuric Z, Dimitrovski D, Kochubovski M (2013) European Union Regulations of Road Transport Air Pollution and Its Implementation in FYR macedonia. J Environ Prot Ecol 14(3): 813-824.
- Wegman L (1993) Memorandum: Definition of regulated air pollutant for purpose of title V. Environmental Protection Agency, USA.
- Zervas E (2008) Regulated and non-regulated pollutants emitted from two aliphatic and a commercial diesel fuel. Fuel 87(7): 1141-1147.
- Gaffney JS, Marley NA (2009) The impacts of combustion emissions on air quality and climate - From coal to biofuels and beyond. Atmos Environ 43(1): 23-36.
- (2002) International Programme on chemical Safety, Concise International Chemical Assessment Document 40; Formaldehyde. World Health Organization, Switzerland.
- (1992) International Programme on chemical Safety, Environmental Health Criteria 127; Acrolein. World Health Organization, Switzerland.
- Faiz CS Weaver, MP Walsh (1996) Air Pollution from Motor Vehicles: Standards and Technologies for Controlling Emissions. Washington DC, USA.
- Hasan O, Abu Jrai A, Al Muhtaseb AH, Tsolakis A, Xu H (2016) Formaldehyde, acetaldehyde and other aldehyde emissions from HCCI/ SI gasoline engine equipped with prototype catalyst, Fuel 175: 249-256.
- Diodiu R, Bucur E, Galaon T, Pascu LF (2015) Indoor air exposure to aldehydes and ketones in rooms with new and old furniture of a new office building. J Environ Prot Ecol 16(3): 832-838.
- Lange J, Eckhoff S (1996) Determination of carbonyl compounds in exhaust gas by using a modified DNPH-method. Fres J Anal Chem 356(6): 385-389.
- Rodrigues MC, Guarieiro LL, Cardoso MP, Carvalho LS, Da Rocha GO, et al. (2012) Acetaldehyde and formaldehyde concentrations from sites impacted by heavy-duty diesel vehicles and their correlation with the fuel composition: Diesel and diesel/biodiesel blends. Fuel 92(1): 258- 263.
- Ballesteros RJ, Guillén JF, Martínez JD (2014) Carbonyl emission and toxicity profile of diesel blends with an animal-fat biodiesel and a tire pyrolysis liquid fuel. Chemosphere 96: 155-166.
- Peng CY, Yang HH, Lan CH, Chien SM (2008) Effects of the biodiesel blend fuel on aldehyde emissions from diesel engine exhaust. Atmos Environ 42(5): 906-915.
- Bata RM, Roan VP (1989) Effects of Ethanol and/or Methanol in Alcohol- Gasoline Blends on Exhaust Emissions. J Eng Gas Turb Power 111(3): 432-438.
- Sigsby JE, Tejada S, Ray W, Lang JM, Duncan JW (1987) Volatile organic compound emissions from 46 in-use passenger cars. Environ Sci Technol 21(5): 466-475.
- RH Linnell, WE Scott (1962) Diesel Exhaust Composition and Odor Studies. J Air Pollut Control Assoc 12(11): 510-545.
- Guarieiro LL, Pereira PA, Torres EA, Da Rocha GO, De Andrade JB (2008) Carbonyl compounds emitted by a diesel engine fuelled with diesel and biodiesel-diesel blends: Sampling optimization and emissions profile. Atmos Environ 42(35): 8211-8218.
- White JJ (1993) Development of baseline and controlled exhaust emission rates for off-highway vehicle engines. Final report. Southwest Research Inst., Automotive Products and Emissions Research Div, San Antonio, TX, USA.
- Kumar S, Nayek M, Kumar A, Tandon A, Mondal P, et al. (2011) Ketone and Methane Emissions from Motor Vehicle Exhaust: A Critical Review. Am Chem Sci J 1(1): 1-27.
- Biren PJ, Siraki AG, Shangari N (2005) Aldehyde Sources, Metabolism, Molecular Toxicity Mechanism, and Possible Effects on Human Health. Crit Rev Toxicol 35(7): 609-662.
- Sarigiannis DA, Karakitsios SP, Gotti A, Liakos IL, Katsoyiannis A (2011) Exposure to major volatile organic compounds and carbonyls in European indoor environments and associated health risk. Environ Int 37(4): 743-765.
- Lawson DR, Biermann HW, Tuazon EC, Winer AM, Mackay GI, et al. (1990) Formaldehyde measurement methods evaluation and ambient concentrations during the Carbonaceous Species methods comparison study. Aerosol Sci Tech 12(1): 64-76.
- Lee SC, KF Ho, Chan LY, Zielinska B, Chow JC (2001) Polycyclic Aromatic Hydrocarbons (PAHs) and Carbonyl Compounds in urban atmosphere of Hong Kong. Atmos Environ 35(34): 5949-5960.
- Zhang J, KR Smith (1999) Emissions of Carbonyl Compounds from Various Cookstoves in China. Environ Sci Technol 33(14): 2311-2320.
- Atkinson R, Arey J (2003) Gas-phase tropospheric chemistry of biogenic volatile organic compounds: a review. Atmos Environ 37: 197-219.
- Vanloon GW, Duffy SJ (2011) Tropospheric Chemistry - Smog. Environmental Chemistry: A Global Perspective Vanloon GW (Ed.), Oxford, UK.
- Louie PK, Ho JW, Tsang RC, Blake DR, Lau, et al. (2013) VOCs and OVOCs distribution and control policy implications in Pearl River Delta region, China. Atmos Environ 76: 125-135.
- Compendium Method TO-11A Determination of Formaldehyde in Ambient Air Using Adsorbent Cartridge Followed by High Performance Liquid Chromatography (HPLC) (2nd edn), US Environmental Protection Agency, Cincinnati, OH 45268, USA.
- Miller JN, Miller JC (2005) Significance Test. Statistics and Chemometrics for Analytical Chemistry. Gosport, UK.
- Zurek G, Karstm U, Luftmann H (1999) HPLC-APCI-MS with calibration based on stable isotope-labelled internal standards for the quantification of carbonyls in air samples. Analyst 124(9): 1291-1295.
- Andreini BP, Baroni R, Galimberti E, Sesana G (2000) Aldehydes in the atmospheric environment: evaluation of human exposure in the northwest area of Milan. Microchem J 67(1-3): 11-19.
- Van Leeuwen SM, Hendriksen L, Karst U (2004) Determination of aldehydes and ketones using derivatization with 2,4-Dinitrophenylhydrazine and liquid Chromatography-atmospheric pressure photoionization-mass spectrometry. J Chromatogr A 1058(1-2): 107-112.
- Ban Weiss GA, Mclaughlin JP, Harley RA, Kean AJ, Grosjean E, et al. (2008) Carbonyl and Nitrogen Dioxide Emissions from Gasoline- and Diesel- Powered Motor Vehicles. Environ Sci Technol 42(11): 3944-3950.
© 2019 Ivan Víden. This is an open access article distributed under the terms of the Creative Commons Attribution License , which permits unrestricted use, distribution, and build upon your work non-commercially.
 a Creative Commons Attribution 4.0 International License. Based on a work at www.crimsonpublishers.com.
Best viewed in


.jpg)


 Editorial Board Registrations
 Submit your Article
 Refer a Friend
 Advertise With Us
.jpg)


.jpg)


.bmp)
.jpg)
.png)
.jpg)


.jpg)


.png)

.png)


.png)


