- Submissions

Full Text
Progress in Petrochemical Science
Impact of AVO Analysis on Murree and Sakesar Formations in the Upper Indus Basin in Pakistan a Case Study
Ibrar Iqbal1*, Gang Tian1, Shahid Iqbal2 and Amin khan3
1 Department of Earth Sciences, China
2 Department of Earth Sciences, Pakistan
3 Department of Chemical and Biological Engineering, China
*Corresponding author: Ibrar Iqbal, Department of Earth Sciences, China
Submission: October 24, 2018;Published: November 13, 2018

ISSN 2637-8035Volume3 Issue1
Abstract
Seismic data is extremely beneficial to envisage the subsurface lithologies. However, only seismic data is not sufficient to stipulate the gas reservoir. In this paper, by reviewing many signposts in the development of AVO methodology regarding the principles of AVO analysis, we applied AVO analysis to two formations (Murree and Sakesar). We have endeavored to cover the critical formulae and the most current tools in AVO analysis. After comparing multiple methods, we determined that the Aki and Richards equation is the best technique for the AVO analysis in this area because it provides the most accurate results. Because the Aki and Richards approximation is deviates at all angles, it will show the deviation when the angle is either small or large. Here deviation means that the curve plotted are matching to the Zoeppritz curve or not.
Introduction
“The variation of the reflection and transmission coefficients with the angle of incidence (AVA) (and corresponding increasing offset) is often denoted to as offset dependent reflectivity and it is essential for amplitude versus offset (AVO) analysis” Ostrander (1982, 1984). Conferring to the type of seismic data there are two types of AVO analysis P-wave and multicomponent seismic data. The term AVO was first used in the literature in 1982 when Ostrander presented his paper “Plane wave reflection coefficient for gas sands at non-normal angle of incidence.” Ostrander (1982, 1984) established that the seismic reflection AVO can be used to distinguish gas related amplitude anomalies from other types of amplitude anomalies.
Smith and Gidlow (1987) derived another approximation of the Zoeppritz equation based on Aki and Richard‘s simplification.
Today, AVO analysis is broadly used in hydrocarbon detection, lithologic identification, and fluid parameter analysis, because the seismic amplitude at the boundaries is affected by variations in the physical properties. AVO analysis in theory and practice (tentative) is becoming progressively eye-catching. Different approximations are discussed along with their comparisons with the Zoeppritz result.
1. Bortfeld [1] Approximation
2. Aki and Richards [2] Approximation
3. Shuey’s Equation [3]
4. Fatti et al. [4] Approximation
The above approximations are discussed in detail later and are used for the plotting of curves. We compared the results with the Zoeppritz exact curve and concluded our result based on these plots.
General Geology
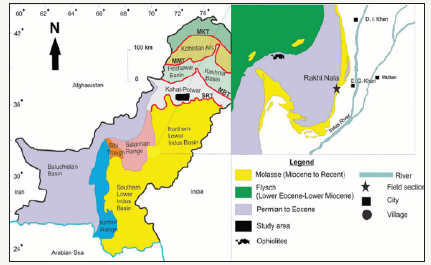
The study area is situated in Jhelum, which is in the Punjab Province of Pakistan. The area lies around approximately 33°7’37” North 72° 58’ 1” East. It is connected to Dina on one side and Rawalpindi on the other side through the GT road and North western Railway, both running from Peshawar to Lahore. The study area is shown in (Figure 1). The Salt Range is a part of an active foreland fold and thrust belt of the Himalayan collision zone in northern Pakistan, where the Indian plate is being underthrust beneath its own Phanerozoic sediment (Baker, et al. 1988). The Sakesar Limestone (Early Eocene Ypresian) is thinly to thickly bedded-and in parts, is massive limestone with subordinate calcareous shale. It is mostly nodular (of 10-30cm size) with chert nodules mainly present in the upper part of the formation.
Figure 1:Map showing the study area.
The limestone is light to dark gray and in parts creamy in color. Bioturbation (vertical, horizontal and random) is common. The upper contact of the Sakesar Limestone is conformable with the Chorgali Formation at Nilawahan and Bhadrar and the unconformable with late Pleistocene Kalabagh conglomerates at Khura and with the Siwaliks at Baghicha Nala. The lower contact is transitional with the Nammal Formation. The Sakesar Limestone is highly fossiliferous. Larger and smaller benthic foraminifers along with other fossils such as ostracods, gastropods, pelecypods and echinoids are present in this formation.
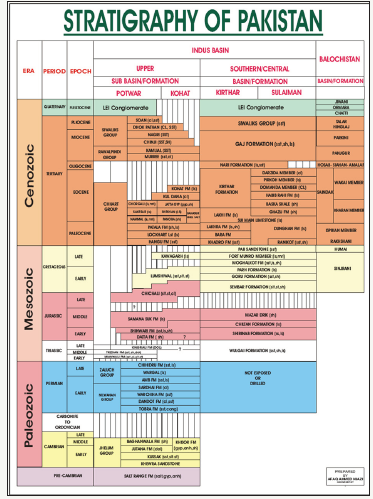
The strata of the Murree Formation of the Rawalpindi group present the initiation of the molasses sedimentation in North Pakistan. The sediments were deposited after the collision of the Indian plate with the Eurasian plate (Powel, 1979). They are distributed in the Kohat-Potwar Province, Salt Range, Hazara- Kashmir syntaxis belt, Jammu and the North Indian plain. (Shah, 1977; Bossart and Ottigar, 1989) The lithology is mainly reddish brown and gray sandstone, siltstone, clay and conglomerate. Previous stratigraphic studies on the Murree Formation have been reviewed in detail by Shah (1977). (Figure 2) shows a geological column map of the area.
Figure 2:Stratigraphic chart of Potwar Plateau.
AVO analysis is a technique that geophysicists can execute on seismic data to determine a rock’s fluid content, porosity, density or seismic velocity, shear wave information and fluid indicators (hydrocarbon indications). Here, we are using the technique on the Murree and Sakesar formations because they form a hydrocarbon play.
Seismic Data Acquisition and Processing
Acquisition
The seismic data were acquired by the Oil and Gas Development Corporation, Limited Pakistan, the Table 1 shows the field parameters that were used during the survey. Turkwal Deep -01 well data are used for AVO analysis and the following information is also available for our study. The locations of the seismic lines and the well are shown in (Figure 3)
Table 1:Field parameters.

Figure 3:Base map showing seismic lines and Turkwal01well in the study area.
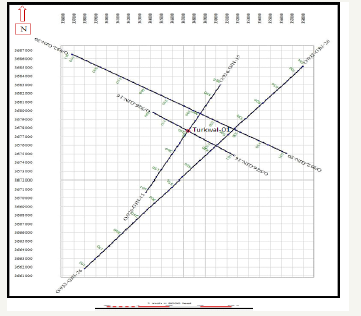
a. Base map of the area to determine the four seismic lines.
b. Seismic sections of fours seismic lines.
c. Complete wire line data of the Turkwal Deep -01 well (Both hardcopy and LAS format).
Seismic data processing
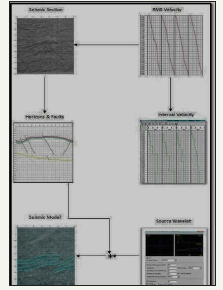
By using computer software, the following seismic analysis was carried out. The navigation data (in IGSDBO format) was converted to UTMZ, and all digital maps along with geo-referenced imagery [5] were produced using the K-tron Precision Matrix (Khan, 2000). For interpretation, K-tronX-Works (Khan, et al. 2006) provides an interactive interface for marking horizons & faults, similar to a seismic interpretation workstation. It stores the interpreted information into a digital file (SEC- Cross- section format). The interpreted information can further be processed to produce depth sections using the seismic velocity, and to perform a crustal shortening analysis and 2-D seismic modeling. In addition, the time, depth and horizon velocity XYZ data are exported to generate contour maps. A generalized flowchart of the procedure is shown in (Figure 4). We record seismic data as a function of the offset, although the offset and angle are similar, there is a nonlinear relationship between them, which must be accounted for in processing and analysis schemes, which require angle instead of the offset. We call this type of analysis AVA (amplitude versus angle) rather than AVO.
Figure 4:Complete interpretation and analysis work flow using a combination of software products.
Avo Analysis
In recent past, an enlarge number of concepts and methods in seismic data acquisition, processing and interpretation have been established, modernized and employed. AVO analysis in theory and practice (cautious) is becoming progressively fascinating. We deliberated different approximations of AVO analysis and using those approximations we plotted our results given below. After the Turkwal Deep -01 well data are analyzed, the parameters used in our research are listed in the (Table 2).
Table 2:Parameters used in AVO analysis.

Avo classifications
The features of AVO classes 1 to 4 were defined by Castagna [6] as shown.
Avo approximations: The above AVO classes 1 to 3 are calculated with the Bortfeld (1961) – approximation, the Shueyapproximation, the Fatti-approximation, and Aki and the Richards approximation and compared to the exact Zoeppritz equation. We will debate each approximation in detail along with their advantages and disadvantages.
Bortfeld [1] approximation: Bortfeld [1] created one of the earliest linear equations to the Zoeppritz equations. Few talks about Bortfeld but some prefer Bortfeld to Shuey’s. This approximation is not discussed in detail because it deviates only higher angles and is not suitable for our data set due to this drawback. The equation is given by:

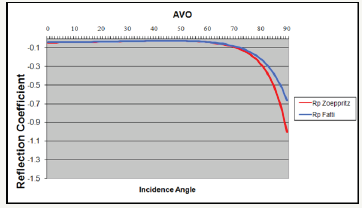
Figure 5 shows a comparison of the Bortfeld and Zoeppritz results, which indicates that although the approximation deviates from the normal Zoeppritz curve at higher angles, it still follows the same pattern as the Zoeppritz curve Thus, we can understand the type of AVO by this methodology.
Figure 5:Types of AVO based on the reflection coefficient and incidence angle variation.
Aki and Richards [2] approximation: The Aki and Richards [2] linear approximation is the starting point for most AVO inversion work. The Aki and Richards equation is derived from that of Bortfeld. In the small incident angle case, the magnitude of the P-P reflection coefficient is greater than that of the P-S reflection coefficient. The Aki and Richards approximation has a larger relative error for the P-S reflection than the P-P reflection coefficient [7].
On the other hand, the Aki and Richards [2] approximation of the P-S coefficients is good for the transitional incident angle range and S wave property with lower variation. Figure 5 shows a comparison of the Aki and Richards versus Zoeppritz results, which signposts that the approximation deviates from the normal Zoeppritz curve at all angles. Thus, this is the best approximation for the existing data (Figure 5).
Figure 6:Fatti et al. [4] versus Zoeppritz curves comparison.
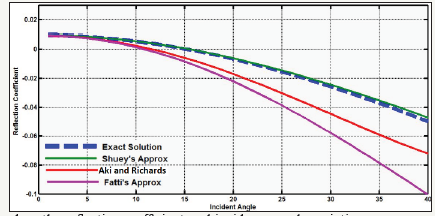
Shuey’s equation: Shuey [3] attempted to convert the equation into a linear equation of form y=mx+b, where m is the gradient, and b is the intercept. The intercept and gradient could cause changes in the fluid but may also reflect changes in the lithology. This approximation is good to an incidence angle of approximately 30 degrees which shows that this approximation is suitable for only steep structures. Figure 6 shows a comparison of the Shuey and Zoeppritz results, which indicates that the Shuey approximation having 3-terms deviates from the normal Zoeppritz curve at higher angles. However, the 2-terms result is more ambiguous, increasing instead of decreasing, while 3-term Shuey result still follows the same pattern as the Zoeppritz curve so therefore we can understand this type of AVO by this methodology (Figure 6).
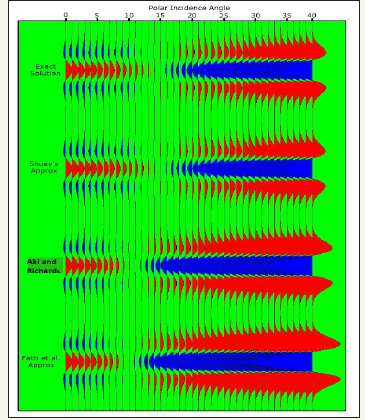
Figure 7:AVO Synthetic gather showing a bright spot (as highlighted).
Fatti et al. [4] approximation: Another approximation was created by Fatti et al. [4]. Figure 7 shows a comparison of the results of Fatti et al. [4] versus the Zoeppritz results, which indicates that while the approximation deviates from the normal Zoeppritz curve at higher angles, it still follows the same pattern as the Zoeppritz curve so thus, we can understand the type of AVO by this methodology. This approximation is not good for our data set because the curve deviates only higher angle (Figure 7).
Synthetic Avo Gather
A synthetic seismic gather showing the AVO can be analyzed by the interpretive geophysicist to predict the rock properties useful in oil exploration. “Reflection coefficients derived from measured well log data are convolved with a Ricker wavelet to create a synthetic seismic trace” [8]. As shown in Figure 7, a synthetic AVO gather is generated based on the above calculations. The synthetic gather provides bright spots that indicates the gas areas, and it shows the applied AVO analysis data related to gas bearing area. For the research reported in this paper, the reflection coefficients derived from measured well log data are convolved with a Ricker wavelet to create a synthetic seismic trace. The Zoeppritz equations describe the propagation of an acoustic wave across an interface between two viscous media of different acoustic impedances with respect to an increasing offset angles.
The Aki-Richards linear approximation to the Zoeppritz equations is applied for this study to create a synthetic seismic gather with offset angles up to fifty degrees. The Aki-Richards approximation has not been used in this fashion prior to this research. The resulting gather is compared to a corresponding synthetic gather created using commercially assvailable approximations and software.
Discussion and Conclusion
The curves matching the type 3 AVO curves are described by Castagna’s classification and this type is associated with hydrocarbons. Bright spots indicate that gas may be present. This well (Turkwal Deep -01) has already produced gas an industrial scale which proves that our results are correct. On the basis of the available data, we can conclude that our results are reliable because the generated curves match the type 3 curve.
We concluded that Aki and Richards are the best technique for the AVO analysis in this area because, although all the approximations match the Castagna’s exact curve this is not the case for all angles. For example Shuey’s approximation fits up to only 30°, the Bortfeld and Fatti approximations fit only the higher angles, and the Aki and Richards approximation deviates at all angles [8-17].
The comparison of the synthetic to the original gather is not done due to the unavailability of the pre-stack data, but the AVO inversion is considered as another approach. We would like to perform the elastic earth model reconstruction by inversion. The converted wave information may help to construct the inversion.
The basis of the curve matching with the exact Zoeppritz equation is that the percent changes in the elastic properties are small, ie., ΔVs/Vs and ΔP/P are small compared to unity.
For the vast majority of exploration situations, this is no problem, but when we come to the deviation of the angle in different environments the approximations changes. The Aki and Richards approximation is the best for our study because it deviates at almost all angles, but this is not the case for every data set. By keeping view on all the mentioned results, It can be concluded that Aki and Richards approximation is the best suitable for the under observed environment.
References
- Bortfeld R (1961) Approximation to the reflection and transmission coefficients of plane longitudinal and transverse waves*. Geophysics 9(4): 485-502.
- Aki K, Richards PG (1980) Quantitative seismology: Theory and methods. WH Freeman and Company, USA, 16(1): 90.
- Shuey RT (1985) A simplification of the Zoeppritz equations. Geophysics 50(4): 609-614.
- Fatti JL, Smith GC, Vail PJ, Strauss PJ, Levitt PR (1994) Detection of gas in sandstone reservoirs using AVO analysis: A 3-D seismic case history using the Geo stack technique. Geophysics 59(9): 1362-1376.
- Khan (2008) Seismic data processing using K-TRON.
- Castagna JP (1993) AVO analysis-Tutorial and review. In: Backus MM (Ed.), Offset-dependent reflectivity-theory and practice of AVO analysis. Soc of Expl Geophysics, Oklahoma, USA, pp. 3-36.
- Aki K, Richards PG (2002) Quantitative seismology. (2nd edn), WH Freeman and Company, USA, 16(1): 90.
- Graham G (2012) Calculation of a synthetic gather using the Aki- Richards’s approximation to the Zoeppritz equation, University of New Orleans, Louisiana, USA.
- Avseth P, Mukerji T, Mavko G (2005) Quantitative seismic interpretation. Cambridge University Press, Cambridge, UK.
- Buland A, Omer H (2003) Bayesian linearized Avo inversion. Geophysics 68(1): 185-198.
- Bacon M (2007) 3-D seismic interpretation. Cambridge University press, Cambridge, UK.
- Blangy JP (1994) Avo in transversely isotropic media. Geophysics 59(5): 775-781.
- Carcione JM (1999) Effects of vector attenuation on AVO of offshore reflections. Geophysics 64(3): 815-819.
- Hilterman, Fred G, Mike (2009) SEG continuing course. Seismic Lithology. Continuing education series.
- Asim S, Qureshi SN, Asif SK, Abbasi SA, Solangi S, et al. (2014) Structural and stratigraphical correlation of seismic profiles between Drigri Anticline and Bahawalpur High in Central Indus Basin of Pakistan. International Journal of Geosciences 5(11): 1-10.
- Sheriff RE, Geldart LP (1995) Exploration Seismology, (2nd edn), Cambridge University Press, Cambridge, UK.
- Telford WM, Geldart LP, Sheriff RE, Keys DA (1976) Applied Geophysics, Cambridge University Press, Cambridge, UK.
© 2018 Ibrar Iqbal. This is an open access article distributed under the terms of the Creative Commons Attribution License , which permits unrestricted use, distribution, and build upon your work non-commercially.
 a Creative Commons Attribution 4.0 International License. Based on a work at www.crimsonpublishers.com.
Best viewed in


.jpg)


 Editorial Board Registrations
 Submit your Article
 Refer a Friend
 Advertise With Us
.jpg)


.jpg)


.bmp)
.jpg)
.png)
.jpg)


.jpg)


.png)

.png)


.png)


