
- About Us
- Information
-

The Author ensures that the research has been conducted responsibly and ethically with adherence to all relevant regulations. read more..
- For Authors
- For Reviewer
- Manuscript Guidelines
- Membership
- Publication Ethics
-
- Journals
- Reprints
- e-Books
- Videos
- Policies
- Contact Us
 COVID-19
- Submissions


Full Text
Progress in Petrochemical Science
Curing Characterization of EPDM Rubber Compounds using RPA: Effects of Cure Conditions
Mona Taheri and Somayyeh Mohammadian Gezaz*
Payame Noor University, Iran
*Corresponding author: Somayyeh Mohammadian-Gezaz, Payame Noor University, Tehran, PO Box: 19395-3697, Iran
Submission: September 17, 2018;Published: September 21, 2018

ISSN 2637-8035Volume2 Issue5
Abstract
The cure characteristics of EPDM compounds were investigated using of an oscillatory cure meter, namely, the rubber process analyzer (RPA 2000). Cure tests were conducted at different cure conditions and the effects of temperature, frequency and strain on the elastic (S’) and viscous (S”) cure torque curves were studied. The results showed that the cure process was affected strongly by the changes in the test conditions. Increasing temperature assisted the vulcanization which was indicated by the greater rate of cure and shorter cure time. It was found that with increasing cure temperature, tmax S” were approximately is the same them as real scorch time (tC10). As the cure frequency increased, scorch and cure time and the slope of the elastic torque are not changed significantly and the percentage of cure at tmax S” decreases. With increasing strain, the elastic and viscous torques increase and the nonlinearity effect was observed at the higher strain.
Keywords: EPDM (Ethylene propylene diene monomer rubber); Rubber process analyzer (RPA); Cure characteristics; Cure conditions
Introduction
Rheometers are the instruments which can determine the cure characteristics of the rubber compounds [1,2]. Generally, in these equipments, a certain shear strain is applied, and the torque response of the material is measured. Conventional rheometers include two-parallel-plate and cone-and-plate types which are utilized to study the rheological and the cure properties of the rubber compounds [1-7]. But in these instruments wall slip may occur and the sample loading in the gap is not easy, affecting the repeatability of the tests. In addition, the high viscosities of rubber compounds may raise a number of difficulties. For these reasons, it is necessary to develop specific measuring equipments. RPA (rubber process analyzer) is a strain-controlled shear cone-andcone rheometer specifically designed for raw elastomers and their compounds. It can be operated in rotation dynamic and relaxation modes. Rheological characterizations of gum and rubber compounds [8-10] and the cure behavior of compounds [11-13] can be investigated using RPA.
Figure 1:Schematic of the RPA gap.

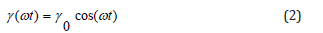
The reciprocal cone geometry of RPA can be seen in Figure 1 schematically. The values of α and R are equal to 0.125rad and 20.6mm respectively. The lower cone is moved with the rotational angular of θ which induces the shear strain (γ) equal to. A torque transducer at the upper cone measures the torque transmitted through the sample from the lower cone. The rheological properties are measured from the viscoelastic response of the material. In the dynamic mode of RPA, the applied sinusoidal shear strain and the shear rate are given by the following equations, respectively. Where is the maximum strain amplitude and is the frequency.

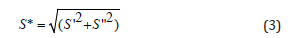
In the cure experiment, Cure torque response (S*) is divided to the elastic (S’) and viscous (S”) parts by equation 3.
The elastic torque response (S’) is in-phase with the applied strain and the viscous torque response (S”) is 90° out-of-phase with the applied strain. Figure 2 illustrates this relationship. In this study, the cure tests were performed with a EPDM compound at different cure conditions using RPA and the influences of temperature, frequency and strain on the cure behavior were investigated. In all cases, viscous and elastic cure torque curves, scorch time, and the rate of cure were also evaluated.
Figure 2:Applied strain and torque responses in RPA.

Experimental
Material
To evaluate the effects of cure conditions, cure tests were performed at different cure conditions with a compound based on EPDM (Keltan 2340A) from DSM Co. and a conventional sulfur curing system according to Table 1. The Compound was prepared by mixing on two roll mill mixers with the friction ratio of 1.6:1 (Polymix 200L, Schwabenthan Co., Germany) by the rotor speed of 15rpm, for 20 minutes. Ingredients were added in order of rubber, activators (Stearic Acid and ZnO), antioxidant (TMQ), CB and oil, curing agent (sulfur) and accelerator (TBBS, TMTD). Finally, the compound was sheeted on the mill and kept at room temperature for 24hr before testing.
Table 1:Formulation of sample.

Cure tests
The cure process can be characterized by functions such as elastic and loss modulus. These functions can be obtained in a dynamic test, from measuring the forces which developed by the material when subjected to the oscillatory deformation of controlled amplitude and frequency. In this work Rubber Process Analyzer (RPA 2000) from Alpha technologies Co. (UK) was used. The effects of temperature, frequency and strain on the cure characteristics were investigated at various test conditions according to Table 2.
Table 2:RPA cure tests conditions.

Results and Discussion
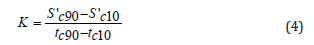
Figure 3 shows the typical viscous cure curve (S”) along with the corresponding elastic cure curve (S’) of a rubber compound versus cure time. First, the viscous torque (S”) increases and reaches a maximum amount. The rise in S” curve can be due to the formation of polysulfide pendent groups between rubber and accelerator during the induction step of the cure which can prevent the rubber chains mobility. After the peak, the viscous torque declines as the cure process continues until reaches a constant value at the ultimate state of cure. The time the maximum of S” occurs is named tmax S”. The elastic torque (S’) rises as the crosslink density increases and reaches a plateau at the end of cure. From the slope of the S’ curve, cure rate (K) can be calculated by the following equation. Here, S’C10 and S’C90 are the elastic torque amounts at the times of tC10 and tC90, related to 10% and 90% conversion of cure respectively.
Figure 3:Typical torque responses resulting from RPA cure test.

Temperature
Figure 4 illustrates the S’ and S” curves at different temperatures of 150, 160 and 170 °C which were obtained at 1.68Hz frequency and %7 strain. As expected, cure curves shift to the shorter times with increasing temperature, and tmax S” decreases also. As the temperature rising, formation of rubber-Sx-accelerator pendent groups becomes faster, thus tmax S” decreases. But it should be noted that as the crosslinks form along with the free branches, the pendent groups is consumed faster than when it cures at low temperature. Therefore, S”max decreases with increasing the temperature. Figure 5 gives the calculated cure characteristics of cure curves at different temperatures. Rate of cure increases while scorch and cure times decrease as the cure temperature rises. At higher temperature, excessive heat energy assists the vulcanization, thus, rate of cure increases, and scorch time decreases. The conversion of cure (state of cure) in the maximum of S” can be evaluated from the S’ curve by the following equation.
Figure 4:Influence of temperature on the cure torque curves.

Figure 5:Cure characteristics at different temperatures.


Figure 6 shows the correlation between tmax S” and elastic torque as the percentage of cure from the S’ curve at the (tmax S”). At the lower temperature, tmax S” is almost the same as real scorch time (tC10). With increasing the temperature, peak of S” is seemed in the shorter time and higher conversion of cure. As discussed before, both production and consumption of rubber-Sx-Acc bonds occur faster at the higher temperature, consequently the crosslink formation at S”max is greater at higher temperature, hence the conversion of cure at S”max.
Figure 6:State of cure at S”max for different cure temperatures.

Frequency
In this part, cure experiments were performed at different selected oscillation frequency to study the effects of frequency on the torque curves. The frequency was changed from 0.1 to 15Hz at 150 °C temperature and %7 strain. Figure 7 gives the S’ and S” torque curves at different frequencies. When the cure oscillation frequency increases, S’ and S” gradually increase. The differences between torques reduce as the crosslink density increases. On the other word, S’ and S” torque responses are less sensitive to changes in frequency as the cure process is completed. It is in consequence of the formation the crosslinks and more rigidity of the cured compound that reduces the sensitivity to the frequency. Figure 8 shows the cure characteristics resulting from S’ and S” cure curves at different frequencies. As the cure frequency increases, scorch and cure time and the slope of the elastic torque are not changed significantly. The added thermal energy to the cavity at higher frequency is small at low strain and can be dissipated easily by the RPA die design. It should be noted that at higher strains the heat energy of increasing frequency could affect the scorch time and cure rate. The percentage of S’ cure torque at tmax S” versus the oscillation frequency is illustrated in Figure 9. It can be observed that the percentage of cure at tmax S” decreases as the cure frequency increases. At low frequency (low shear rate), the rubber chains have more time to response to the applied strain. Thus, more damping (S”max) can be observed at higher conversion of cure as the frequency decreases.
Figure 7:Variation of cure curves at different frequencies

Figure 8:Cure characteristics against the cure frequency

Figure 9:Changes in the state of cure at S”max with the cure frequency.

Strain
Figure 10:Cure torques against time at different strains.

Figure 11:Cure characteristics versus cure strain.

Figure 12:State of cure at S”max for different cure strains.

To study the strain effects, cure tests were done at different strains from 0.7% to 42% at 150 °C temperature and 1.68Hz frequency. Figure 10 describes the effects of strain on the torque curves. With increasing test strain, the elastic and viscous torques (force X motion distance) values increase. For this compound at the strain of 42% S” curve shows the nonlinearity effect. At the higher amplitude than 14%, another increase in the S” cure curve was observed because of the partial scission of the crosslinks which results more damping in this region. Figure 11 shows the torque characteristics obtained from the curves at different test strains. Slope of the elastic torque rises obviously as the strain increases. At a constant frequency, higher strain causes the higher shear rate which increases the nonlinearity and torque because of motion distance. As can be seen scorch time is not changed by the test strain increasing. Meanwhile strain don’t affect on vulcanization process. Figure 12 expresses that reduction in the strain causes increasing in the conversion of cure at tmax S”. Considering the percentage of cure at the S” peak, at low strains tmax S” has a good equality with the scorch time (tC10). As mentioned previously, with increasing strain, the torques values and slope of the elastic torque increases. Increase in the strain makes the greater thermal energy in sample similar to increasing temperature. This observation is analogous to that of the temperature effect as discussed before.
Conclusion
The rubber process analyzer (RPA) is a rotor less oscillatory cure meter which is designed especially to measure the dynamic properties of raw elastomers, uncured compounds and cured compounds. In this work, cure tests were conducted with a compound based on EPDM at different cure conditions using RPA and the cure torque curves were analyzed. It was found that the test conditions strongly affect the results. With increasing the temperature, cure curves shift to the shorter times and tmax S” decreases. At the lower temperature, tmaxS” is nearly same as the real scorch time (tC10). In addition, rate of cure increases, and cure time decreases as the cure temperature rises. It means that the increment in the cure temperature accelerates the vulcanization. When the cure frequency rises, the scorch time and the cure rate are not changed significantly but the percentage of cure at tmax S” decreases. With increasing the test strain, the S’ and S” torque values increase, and the nonlinearity can be realized in the elastic torque curve.
References
- Somayyeh M, Abbas K (2018) The relation between the componding time and the viscoelastic behavior of rubber compound. Progress Petrochemical Science 2(1): 1-4.
- Nabl H, Ismail H, Azura AR (2013) Compounding, mechanical and morphological properties of carbon-black-filled natural rubber/ recycled ethylene-propylene-diene-monomer blends. Polymer Testing 32(2): 385-393.
- Junkong P, Kueseng P, Wirasate S, Huynh C, Rattanasom N (2015) Cut growth and abrasion behaviour and morphology of natural rubber filled with MWCNT and MWCNT/carbon black. Polym Test 41(1): 172-183.
- Hu X, Luo W, Liu X, Li M, Huang Y, et al. (2013) Temperature and frequency dependent rheological behaviour of carbon black filled natural rubber. Plastics, Rubber and Composites 42(10): 416-420.
- Das A, Jurk R, Stockelhuber KW, Heinrich G (2008) Effect of vulcanization ingredients on the intercalation-exfoliation process of layered silicate in an acrylonitrile butadiene rubber matrix. Macromol Mater Eng 293(6): 479-490.
- Meera AP, Said S, Grohens Y, Thomas S (2009) Nonlinear viscoelastic behavior of silica-filled natural rubber nanocomposites. J Phys Chem C 113(42): 17997-18002.
- Privalko VP, Ponomarenkoam S, Privalko E, Schon F, Gronski W (2005) Thermo elasticity and stress relaxation behavior of polychloroprene/ organoclay nanocomposites. Euro Polym J 41(12): 3042-3050.
- Mohomane SM, Djokovic V, Thomas S, Luyt AS (2011) Polychloroprene nanocomposites filled with different organically modified clays: Morphology, thermal degradation and stress relaxation behavior. Polym Test 30(5): 585-593.
- Karrabi M, Mohammadian S (2011) Characterization the effects of nano particle carbon black on the linear and nonlinear viscoelasticity of uncured and cured SBR compounds. Iranian Polymer Journal 20(1): 15-27.
- Mohammadian S, Karrabi M (2017) Study on the stress relaxation of nano layered silicate-rubber nanocomposites considering standard linear solid model. Journal of Rubber Research 20(1): 20-32.
- Jacob A, Kurian P, Santhosh AA (2007) Cure characteristics and mechanical properties of natural rubber–layered clay nanocomposites. Int J Polym Mater 56(6): 593-604.
- Karrabi M, Mohammadian S (2010) Study on the cure characteristics and viscoelastic behavior of different styrene butadiene rubber compounds using RPA. Journal of Vinyl and Additive Tech 16(3): 209-216.
- Mohammadian S, Karrabi M (2017) Characterization the viscoelastic and vulcanization behavior of natural rubber nanocomposites having different levels of nano silicate/black. Progress in Rubber Plastics and Recycling Technology 33(4): 203-221.
© 2018 Somayyeh Mohammadian Gezaz. This is an open access article distributed under the terms of the Creative Commons Attribution License , which permits unrestricted use, distribution, and build upon your work non-commercially.
Editor In Chief


.jpg)


Signup for Newsletter

Quick Links
 Editorial Board Registrations
 Submit your Article
 Refer a Friend
 Advertise With Us
Our Recent Edition

.jpg)


Top Editors


.jpg)


.bmp)
.jpg)
.png)
.jpg)


.jpg)


.png)

.png)


.png)


Financial Support

Sponsors

Latest e-Books

Latest Video

 a Creative Commons Attribution 4.0 International License. Based on a work at www.crimsonpublishers.com.
Best viewed in
a Creative Commons Attribution 4.0 International License. Based on a work at www.crimsonpublishers.com.
Best viewed in