
- About Us
- Information
-

The Author ensures that the research has been conducted responsibly and ethically with adherence to all relevant regulations. read more..
- For Authors
- For Reviewer
- Manuscript Guidelines
- Membership
- Publication Ethics
-
- Journals
- Reprints
- e-Books
- Videos
- Policies
- Contact Us
 COVID-19
- Submissions


Full Text
Progress in Petrochemical Science
Experimental Measurement and Thermodynamic Modelling of Vapor-Liquid Equilibria Correlations for Prediction Azeotropic Behavior and Fitting Multicomponent Mixtures Data
Khalid Farhod Chasib*
Petroleum & Gas Engineering Department, University of Thi Qar, Thi Qar, Iraq
*Corresponding author: Khalid Farhod Chasib, Petroleum & Gas Engineering Department, Collage of Engineering, University of Thi Qar, Thi Qar, Iraq
Submission: February 19, 2018; Published: March 09, 2018

ISSN 2637-8035Volume1 Issue2
Abstract
In this study, isobaric vapor-liquid equilibrium for two ternary systems: "1-Propanol-Hexane-Benzene” and its binaries "1-Propanol-Hexane, Hexane-Benzene and 1-Propanol-Benzene” and the other ternary system is "Toluene-Cyclohexane-iso-Octane (2,2,4-Trimethyl-Pentane)” and its binaries "Toluene-Cyclohexane, Cyclohexane-iso-Octane and Toluene-iso-Octane” have been measured at 101.325KPa. The measurements were made in re-circulating equilibrium still with circulation of both the vapor and liquid phases. The ternary system "1-Propanol-Hexane-Benzene” which contains polar compound (1-Propanol) and the two binary systems "1-Propanol-Hexane and 1-Propanol-Benzene” form a minimum azeotrope, the other ternary system and the other binary systems do not form azeotrope.
Correlation equations for expressing the boiling temperature as direct function of liquid composition have been tested successfully and applied for predicting azeotropic behavior of multi component mixtures and the kind of azeotrope (minimum, maximum and saddle type) using modified correlation of Gibbs-Konovalov theorem. Also, the binary and ternary azeotropic point has been detected experimentally using graphical determination on the basis of experimental binary and ternary vapor-liquid equilibrium data.
All the data passed successfully the test for thermodynamic consistency using McDermott-Ellis test method [1]. The maximum likelihood principle is developed for the determination of correlations parameters from binary and ternary vapor-liquid experimental data which provides a mathematical and computational guarantee of global optimality in parameters estimation for the case where all the measured variables are subject to errors and the non ideality of both vapor and liquid phases for the experimental data for the ternary and binary systems have been accounted. The agreement between prediction and experimental data is good. The exact value should be determined experimentally by exploring the concentration region indicated by the computed values.
Keywords: Vapor Liquid Equilibria; Azeotropic Behavior; Multi-component system
Introduction
The term azeotrope means "non-boiling by any means” (Greek: a-non, zeo-boil, tropos- way/mean), and denotes a mixture of two or more components where the equilibrium vapor and liquid compositions are equal at a given pressure and temperature. Systems which do not form azeotropes are called zeotropic. Departures from Raoult's law frequently manifest themselves in the formation of azeotropes, azeotropes are liquid mixtures exhibiting maximum or minimum boiling points that represent, respectively, negative or positive deviations from Raoult's law. Also constant- boiling mixtures are referred to as azeotropes. They occur between certain combinations of the components of the mixture or mixtures of close-boiling species of different chemical types.
Azeotropes occur frequently between compounds whose boiling points differ by less than about 30 °C. If the vapor and liquid are of the same composition, the two-phase mixture is called a homogeneous azeotrope. The constant-boiling mixtures that occur with a vapor and two or more dense phases are called heterogeneous azeotropes (This is because in order to get the liquid to phase separate into two liquid phases the components must be highly repulsive) [2]. The y-x curve crosses the y=x line (the 45° line) at the azeotropic composition, in the region below this intersection with the diagonal, the equilibrium vapor is richer in one component than the liquid, above this intersection, the vapor is poorer in this component than the corresponding liquid from which it comes.
For the isobaric system the temperature versus composition curves coincide at a minimum at the azeotropic composition. Such azeotropic systems frequently occur when the two components are dissimilar functionally and the boiling points are not greatly different of about 25 °C for most systems, although much greater differences are noted in some systems (mixture in which there is strong repulsion between the different species), because less thermal energy has to be introduced to get molecules to enter the vapor phase to overcome the attraction in the liquid.
A high-boiling azeotrope differs from the low-boiling azeotrope in that the temperature versus composition curves of the isobaric plot exhibit maximum, the high-boiling azeotrope is less common than the low-boiling azeotrope, it generally occurs between components whose molecules are somewhat attracted to each other (mixture in which there is strong attraction between the different species), because additional thermal energy has to be introduced to get molecules to enter the vapor phase to overcome the attraction in the liquid. For the T-x-y diagrams if the dew and bubble curves touch at some intermediate composition where the coexisting phases have the same composition. Such a point is known as an azeotrope and although the two phases coexist there at the same temperature, pressure and composition, it is distinguished from a critical point by a difference in the density of the phases [3]. An analysis of the structural properties of vapor-liquid equilibrium (VLE) diagrams provides a fundamental understanding of the highly non ideal thermodynamic behavior of azeotropic mixtures. The possibility to graphically represent the VLE depends on the number of components in the mixture. Phase diagram analysis is an excellent tool for gaining insights into the complex behavior of non ideal ternary mixtures. Ternary vapor-liquid equilibrium (VLE) diagrams provide a graphical tool to predict qualitatively the feasible separations for multicomponent azeotropic mixtures before detailed simulation or experimental study of their distillation [4]. The main difference for ternary and multi component mixtures is that an azeotropic point is not necessarily an absolute extreme (minimum or maximum point) of the boiling temperature at isobaric condition, but it may be a local extreme (saddle).
The tendency of a mixture to form an azeotrope depends on two factors:
i. The difference in the pure component boiling points.
ii. The degree of non ideality.
The closer the boiling points of the pure components and the less ideal mixture, the greater the likelihood of an azeotrope. The important points about azeotropes are:
i. They limit the separation achievable by distillation because even with infinite trays, there is no thermodynamic driving force to separate beyond the azeotrope.
ii. The azeotropic point can be moved, for example by lowering the pressure, so that the desired composition may be obtained. In fact, for some systems, the azeotrope might not even form if the pressure is changed enough and the azeotrope can be broken.
iii. Azeotropes can be used to help separations. Adding a third component to a system which forms a minimum boiling point azeotrope with one of the original components can be used to entrain that component, allowing for it to be vaporized away and recovered [5].
Theory Of Azeotropic Predictions
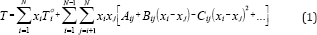
The ability to predict azeotropic behavior becomes more and more important and complex when the number of components in the mixture increases. This prediction is tested successfully by applying the Gibbs-Konovalov theorem [6]. They developed correlation equations for expressing boiling temperature of the vapor-liquid equilibria data, isobaric conditions, as a function of liquid composition, where
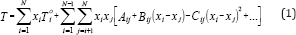
Where Toi is the boiling temperature of pure component i in 0C, and N number of component in the mixture. This equation is useful for obtaining isothermals and for exploring the azeotropic behavior of binary and ternary mixtures. The coefficient A., Bij, and Cij are binary or ternary parameters which are determined directly from the binary or ternary data. The increase in the number of parameters increases the prediction accuracy.
And another correlation for prediction azeotropic behavior of the binary and ternary mixtures, and the kind of azeotrope (minimum, maximum and saddle type), will be discussed below:
The Gibbs-Konovalov theorem [6] for multicomponent systems states that the following conditions are fulfilled at the azeotropic point where xi = yi at constant pressure:
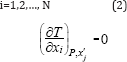
The index xj means that the relationship T is given in terms of all mole fractions as independent variables, except xj. The differentiation is carried out by keeping all the mole fractions constant except xi. For a ternary mixture, the application of (2) namely to the ternary form of (1) yield that:
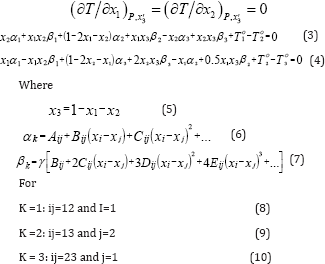
Equations (3) and (4) are nonlinear equations for the unknowns X and x2 and if a ternary mixture exhibits azeotropic behavior, the solution for x1 and x2 should lie within 0-1.
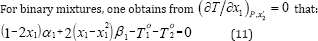
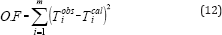
Equation (11) is solved numerically and an azeotrope exists if solution x1 is within the interval 0<x1<1. The use of optimization technique for determining the parameters of the correlation by means of isobaric vapor-liquid equilibria requires minimization of an objective function. The objective function is:
In a multicomponent mixture under isobaric conditions, there is a possibility for an azeotrope with a minimum boiling point, with a maximum boiling point and a saddle point azeotrope. The thermodynamic conditions determining the kind of the multi component azeotrope for isobaric equilibria may be derived as follows: (2) indicates that the boiling temperature of a multi component mixture may be expressed as a function of the liquid composition, namely, T(X1, x2, ..., xN-1). Designating by and the coordinates of the azeotropic point and expanding T into a Taylor series around the azeotropic point gives:

Where terms beyond the second derivative were neglected and according to (2) the first derivatives vanish at the azeotropic point. Equation (13) is known as the quadratic form and the kind of azeotrope depends on the following determinant:
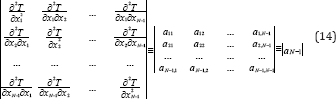
Where the derivatives are taken at the azeotropic point. For simplicity, the principal minors of the determinant aN-1 are designated as follows:
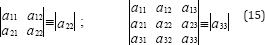
On the basis of theorems related to quadratic forms and by considering (13), (14) and (15), the followings can be concluded concerning the possible kinds of azeotropes (Table 1):
Table 1: Conditions for determination of kinds of multi component azeotropes.

Plotting Calibration Curves
Refractive index and density measurements at 30 °C were chosen as rapid and accurate methods for analysis of equilibrium mixtures. Calibration curves analyses of all binary systems are usually represented graphically by plotting refractive index against the compositions. Combination of refractive index and density measurements were employed for the analysis of the ternary systems graphically, if the concentration of one of the constituents is kept constant while the other two are varied. This was done by interpolation of previously determined refractive index- composition and density-composition charts.
The schematic diagram of the calibration curve of the ternary system 1-Propanol-Hexane- Benzene is illustrated in Figure 1a, and the calibration curve of the ternary system Toluene- Cyclohexane- iso-Octane is illustrated in Figure 1b, this is a graphical method for analysis of the ternary system. Another very accurate method used for analysis is by the use of computer program designed and developed by using MathCAD software for the purpose of finding the compositions of the ternary or binary systems at a given refractive index and density
Expermintal Work
Apparatus and procedure
The experimental determination of vapor-liquid equilibrium data are performed using a circulating equilibrium apparatus, Figure 2 in which the gas and liquid phases of a mixture are circulated continuously at constant pressure. The apparatus used was an all-glass re-circulating still. This equipment has a side- heating unit which ensures complete mixing of the liquid mixture. The design also prevented liquid drop entrainment and partial condensation in the vapor phase. The equilibrium temperature was measured by a digital thermometer with an accuracy of ±0.1 °C. In each experiment, the liquid mixture was heated in a re-circulating still at fixed pressure of 101.3 KPa. Equilibrium was reached after 1h where the temperature of the liquid and vapor phases were constant (the boiling point had become stable) and their difference was within 0.1 °C. Samples of the equilibrium phases were taken at small volumes and were analyzed by measuring densities and refractive indices at 30 °C.
Figure 1: Triangular plot of Refractive index-Density-Composition (Calibration curve) of the ternary system 1-propanol-Hexane-Benzene at 30 oC, in which lines of constant refractive index and constant density are plotted.

Figure 1b: Triangular plot of Refractive index-Density-Composition (Calibration curve) of the ternary system Toluene-Cyclohexane- iso-Octane at 30 oC, in which lines of constant refractive index and constant density are plotted.

Figure 2: Flow diagram for equilibrium apparatus.

System selection
Ternary system i
The ternary system I consists of 1-Propanol, Hexane and Benzene and its binaries. One of the problems in the field of extractive distillation is to find a quantitative method of assessing solvents, in term of the physical properties of the constituents, in order to select the most efficient solvent for a particular process for separating closely boiling compounds. The system studied in this work was composed of Hexane and Benzene. These hydrocarbons are difficult to separate because of closeness of boiling points. 1-Propanol was used as a solvent, to determine experimentally the effect of polar components on the separation of binary systems. Also, these hydrocarbons having different structures come from different groups and form non-ideal solution, hexane (straight chain) from alkanes group and benzene from aromatics group and 1-propanol from alcohols group.
Ternary system ii
The ternary system II consists of Toluene, Cyclohexane and iso-Octane (2,2,4-Trimethyl-pentane) and its binaries. Aromatic hydrocarbons have long been known to show non-ideal characteristics when mixed with other type of hydrocarbons. In the commercial production of toluene from petroleum, the toluene must be separated from hydrocarbons having about the same boiling point, thus the separation of Toluene as a pure compound by ordinary fractionation is very difficult. Also, the importance of using iso-Octane (2,2,4-Trimethyl-pentane) as the central component in an investigation of orientation effects in the pure liquid components.
The system studied in this work was composed of Toluene, Cyclohexane and iso-Octane (2,2,4-Trimethyl-pentane). These hydrocarbons having different structures come from different groups and form non-ideal solution, cyclohexane and iso-octane from alkanes group and toluene from aromatics group. Published data for constituent binary systems 1-propanol-hexane, hexane- benzene, 1-propanol-benzene, and toluene-cyclohexane were reported in the literature [7-9]. To our knowledge, no isobaric or isothermal VLE experimental data have been reported previously in the literature for the binary systems cyclohexane-iso-octane and toluene-iso-octane, and for the two ternary systems 1-propanol- hexane-benzene, and toluene-cyclohexane- iso-octane.
Possible Experimental Work Errors
Systematic errors in the experiments can be ruled out since all the analytical methods were carefully controlled (rechecking the analytical procedure) and all the measurements were duplicated. The value of the experimental results depends on the care employed by the experimentalist in eliminating sources of error. Obtaining good experimental data requires appreciable experimental skill, experience and, patience. Possible causes of the deviation were due to the fact that the mixtures were not ideal mixtures or due to inaccuracy of refractometer, thermometer or barometer or incorrect reading off of their values. The limit of error in reading the refractometer was one in the fifth place, and did not vary noticeably for various mixtures.
The estimated precision of the equilibrium mixture composition measurements was ±0.001 mole fraction for the liquid phase and ±0.005 mole fraction for the vapor phase. The estimated uncertainties in the equilibrium temperature and pressure were ±0.1 °C and 0.5mmHg, respectively. Care was taken to assure that equilibrium really existed, that the temperature and pressure were measured at the position where equilibrium existed, and that the taking of samples for analysis did not disturb the equilibrium appreciably.
Thermodynamic consistency test
One of the greatest arguments in favor of obtaining redundant data is the ability to assess the validity of the data by means of a thermodynamic consistency test. The consistency of the experimental data was examined to provide information on the thermodynamic plausibility or inconsistency and to recognize any deviations of the measured values.
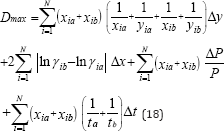
According to McDermott-Ellis test method, two experimental points a and b are thermodynamically consistent if the following condition is fulfilled [1]
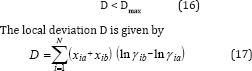
In this method, it is recommended the use of a fixed value of 0. 01 for Dmax if the accuracy in the measurement of the vapor and the liquid mole fraction is within 0.001. The local maximum deviation, Dmax, due to experimental errors, is not constant, and is given by
The conclusion can be drawn that all the data are thermodynamically consistency
Statistical measurement and analysis of dispersion
To know the applicability and accuracy of any proposed correlation it is very important to know how this correlation fits the experimental data which is done by comparing the obtained results from the proposed correlation with the experimental data. The various measurement of dispersion or variation are available, the most common being the Mean Overall Deviation and Average Absolute Deviation.
The Mean Overall Deviation "mean D%" is a more tangible element indicating the overall goodness of the fit of the data by the correlation and it reads:
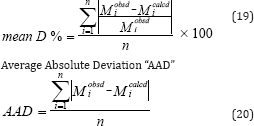
Where M is an intensive property and n is the number of data point. These equations are used to calculate Mean Overall Deviation "mean D%" and Average Absolute Deviation "AAD" of experimental results of binary and ternary systems.
Azeotropic predictions
The wide concentration field which must be investigated experimentally in order to detect an azeotrope in the ternary mixtures reflects the importance of the correlation to be able to predict azeotropic behavior. The boiling temperature of the mixture was correlated with the liquid composition by the following equation:
Where T0i is the boiling temperature of pure component i in 0C, and N number of component in the mixture. This equation is useful for obtaining isothermals and for exploring the azeotropic behavior of binary and ternary mixtures. The coefficient Aij, Bij, and Cij are binary or ternary parameters which are determined directly from the binary or ternary data. The increase in the number of parameters increases the prediction accuracy. For exploring the azeotropic behavior of binary and ternary mixtures equation (1) was solved simultaneously with equations 3-10. An azeotrope existed if solution x1 is within the interval 0<x1<1. If the computations did not yield a solution which corresponds to a true azeotrope, the system would not exhibit azeotropic behavior.
The following experiment was performed in order to check the validity of the predicted values. Ternary solutions with the calculated compositions were prepared and introduced in the recirculating still. The system was boiled until equilibrium was achieved. The analysis yielded the equilibrium compositions of the vapor and liquid. It was seen that the liquid composition deviated very small from the vapor composition; the computed values did not correspond to true azeotropes. On the other hand, the true value of the azeotropic point was identical to the solution or was located in their vicinity. It was observed that the azeotropic boiling temperature was very accurately predicted than the composition. The reason for this behavior is due to the fact that variations in the temperatures in the vicinity of the azeotropic point are usually relatively small in comparison to the concentration [10]
Discussion Of Results
Figure 3: Vapour-Liquid equilibrium Diagram in Binary system of 1- Propanol -Hexane.

Figure 4: Vapour-Liquid Equilibrium Diagram in Binary system of Hexane-Benzene.

Figure 5: Vapour-Liquid Equilibrium Diagram in Binary System of 1-Propanol-Benzene.

Figure 6: Vapour - Liquid equilibrium Diagram in Binary system of Toluene-Cyclohexane.

Figure 7: Vapour-Liquid Equilibrium Diagram in Binary system of Cyclohexane-iso-Octane.

Figure 8: Vapour-Liquid Equilibrium Diagram in Binary System of Toluene-iso-Octane.

Figure 9: Boiling Point-Composition Curve for 1-Propanol-Hexane at 760mmHg.

Figure 10: Boiling Point-Composition Curve for Hexane-Benzene at 760mmHg.

Figure 11: Boiling Point-Composition Curve for 1-Propanol-Benzene at 760mmHg.

Figure 12: Boiling Point - Composition Curve for Toluene-Cyclohexane at 760mmHg.

Figure 13: Boiling Point-Composition Curve for Cyclohexane-iso-Octane at 760 mmHg.

Figure 14: Boiling Point-Composition Curve for Toluene-iso-Octane at 760mmHg.

In order to assess the reliability of experimental results, the equilibrium curves were plotted and compared with those from literature [7-9] as shown in Figures 3 to 8. It may be seen that there is good agreement between the experimental data of this work and the experimental data from literature and confirms the reliability of this work. The fact that the equilibrium curves for both binaries 1-Propanol-Hexane and 1-Propanol-Benzene cross the 45° line indicates that they form azeotropes. The T-x-y diagrams were plotted at isobaric condition, Figures 9-14. All those experimental results were compared with literature. It may be seen that there is good agreement between the experimental data of this work and the data from literature.
Table 2: Results of Thermodynamic Consistency Test.

Table 3: The value of the parameter of equation (1) and comparison between experimental and calculated temperature for binary systems.

The binary mixtures of toluene-cyclohexane and toluene- iso-octane are nearly ideal solution. The other binary mixtures showed positive deviations. The experimental data for binary system were found to be in close agreement with the reported values of the literature. There was no evidence of erroneous data at the entire concentration range because no scattering points were observed and all the points of data fall on smooth curves, showing the experimental values to be consistent. The difference between the experimental points and the smoothing curves are within the analytical accuracy (the estimated precision of the equilibrium mixture composition measurements was ±0.001 mole fraction for the liquid phase and ±0.005 mole fraction for the vapor phase. The estimated uncertainty in the equilibrium temperature was ±0.1°C). The average scatter of the experimental points from the best line is less than that of the previous investigations in the literature.
Table 4: The value of the parameter of equation (1) and comparison between experimental and calculated temperature for ternary systems.

For system I the experimental data for all the three binaries show that they are non-ideal in nature. When studying the equilibrium of hexane-benzene, the observation made in this investigation was that no separation obtainable at concentration above 97 mole % hexane. The 1-propanol-hexane and 1-propanol- benzene systems show minimum boiling azeotropes. For system II the toluene-cyclohexane system does not form an azeotrope, but it seems that there is a tendency toward azeotrope formation at high cyclohexane concentration (at low-boiling ends of the T-x-y diagram). The cyclohexane-iso-octane system shows nearly ideal behavior. The toluene-iso-octane system does not form an azeotrope, but it seems that there is a tendency toward azeotrope formation at high iso-octane concentration. Table 5 indicates the azeotropic composition and temperature of these binaries [11].
Table 5: Comparison between experimental and literature and calculated values of the azeotropic point for the binary systems.

Figure 15: Composition diagram for the ternary mixture 1-Propanol+Hexane+Benzene flight end of arrows (•) indicate equilibrium concentrations of the liquid phase at 760mmHg and the arrow heads (▸) corresponding vapour phase compositions.

Figure 16: Composition diagram for the ternary mixture Toluene+Cyclohexane+iso-Octane flight end of arrows (•) indicate equilibrium concentrations of the liquid phase at 760mmHg and the arrowheads (▸) corresponding vapour phase compositions.

The distribution of the experimental vapor-liquid equilibrium data for ternary systems in the composition triangle diagram may be readily appreciated. These distributions were presented in Figures 15 &16. Each equilibrium composition is shown in Figures 15 &16 by an arrow, with the flight end representing the composition of the liquid phase and the arrowhead that of the vapor phase. Figure 17 shows equilibrium isotherms on the liquid phase composition diagram obtained from the experimental data by graphical interpolation.
Figure 17: Composition diagram for the liquid phase of the ternary mixture 1-Propanol+Hexane+Benzene, showing constant boiling temperature contours at 760 mmHg.

Figure 17 shows a sharp temperature drop occurs from the hexane-benzene binary as small amounts of 1-propanol are added. The drop is less severe at high hexane concentrations. The interior of the surface is nearly flat at points reasonably removed from the pure substances. The flat interior also rises rapidly as pure 1-propanol is reached. A trough with only slight curvature connecting the two binary azeotropes (1-propanol-hexane and 1-propanol-benzene). The surfaces rising from the trough toward pure 1-propanol and also toward the hexane-benzene binary show slightly outward curvature [12].
Figure 18: Composition diagram for the liquid phase of the Ternary mixture 1-Propanol+Hexane+Benzene, showing constant boiling temperature contours and the location of the ternary and binary azeotrope at 760mmHg.

The ternary system I shown in Figure 18 exhibits a ternary azeotrope. The azeotropic composition and temperature of the two binaries are shown in the same figure. In this system, however, there is a point, 0, where boiling temperature is lower than any of the boiling temperatures of the three pure compounds. This composition is known as the ternary azeotrope. The lines of constant boiling temperature surrounding the azeotropic composition 0, and as one proceeds away from 0 the successive isotherms that are intersected represent increasing boiling temperatures [13].
Figure 19: Spatial plot of the ternary system shows the region of the ternary azeotrope.

In order to determine the coordinates of the ternary azeotrope, Figure 19 was drawn. It is a spatial plot of the region where the azeotropic point might be located (a crater-like shape or valley). No ternary azeotrope was detected experimentally in the ternary system II as shown in Figures 20 & 21, and the prediction method did not discover any maximum or minimum with the interior of the phase surface, hence, the system does not contain ternary azeotrope. Also, the shape of curves indicates that the system does not exhibit azeotropic behavior.
Figure 20: Composition diagram for the liquid phase of the ternary mixture Toluene+Cyclohexane+iso-Octane, showing constant boiling temperature contours at 760 mmHg.

Figure 21: Spatial plot of the ternary system Toluene+Cyclohexane+iso-Octane.

Isothermals for both ternary systems were obtained as shown in Figures 17 & 20. The prominent fact which may be concluded from the behavior of the isothermals in Figure 17 is the existence of a ternary minimum boiling point azeotrope in the 1-Propanol+Hexane+Benzene system. On the other hand, it may be concluded from Figure 20 that the system Toluene+Cyclohexane+iso- Octane does not exhibit a ternary azeotrope [14].
A comparison of calculated and experimental temperature results using equation 1 is given in Figure 22; the other results of binary and ternary systems are illustrated in Figures 23-29. If there is complete agreement between experimental and predicted temperature values, all the points would fall on the 45-degree line. It seems from Figure 22 that the equation 1 is useful for obtaining isothermals and for exploring the azeotropic behavior for binary and ternary system because the deviation of all the points from the 45° line is small. The comparison with experimental temperature values indicates that the calculations show rather good agreement with the data as illustrated in Figures 22-29. The value of the parameter of equation 1 and comparison between experimental and calculated temperature for binary systems are illustrated in Table 3. And, the value of the parameter of equation 1 and comparison between experimental and calculated temperature for ternary systems are illustrated in Table 4.
Figure 22: Comparison of calculated and experimental temperature results for Hexane-Benzene system.

Figure 23: Comparison of calculated and experimental temperature results for 1-Propanol-Hexane system.

As the Table 3 indicates that the equation 1 gives values that have an overall average absolute deviations (AAD) and overall percentage mean deviations for all six binary systems of 0.271 and 0.323 respectively, for 138 data points.
As the Table 4 indicates that the equation 1 gives values that have an overall average absolute deviations (AAD) and overall percentage mean deviations for all two ternary systems of 0.781 and 0.959 respectively, for 256 data points. Comparison between experimental and literature [90] and calculated values using equation 1 and equations 3 to 10 of the azeotropic point for the binary systems are illustrated in Table 5, and for the ternary systems were illustrated in Table 6. It seems from Tables 5 & 6 that the calculated temperature and composition of azeotropic point of binary and ternary systems and detecting the type of azeotropic point by using equation 1 with equations 3 to 10 gives good results comparing with the experimental and literature data.
Figure 24: Comparison of calculated and experimental temperature results for 1-Propanol-Benzene system.

Figure 25: Comparison of calculated and experimental temperature results for Toluene-Cyclohexane system.

Table 6: Comparison between experimental and literature and calculated values of the azeotropic point for the ternary systems.

Figure 26: Comparison of calculated and experimental temperature results for Cyclohexane-iso-Octane system.

Figure 27: Comparison of calculated and experimental temperature results for Toluene-iso-Octane system.

Figure 28: Comparison of calculated and experimental temperature results for 1-Propanol-Hexane-Benzene system.

Figure 29: Comparison of calculated and experimental temperature results for Toluene-Cyclohexane-iso-Octane system.

Conclusion
Based on this study, the following conclusions can be made:
i. The re-circulating apparatus used with all accessories proved to be very suitable for obtaining VLE data.
ii. All the data obtained are thermodynamically consistent because they passed the thermodynamic consistency test of McDermott-Ellis test method.
iii. A binary azeotrope is an extremal point of the binary mixture temperature functions. While a ternary azeotrope is not necessary a global temperature extreme for the ternary mixture, thus being a saddle point of the temperature surface.
iv. Ternary mixtures may exhibit distinctly different isotherm maps depending on the existence of azeotropes, their type (minimum-, maximum- or saddle boiling), their location, and the relative order of the boiling points of the pure components.
v. Equation 1 which is a modified correlation of Gibbs- Konovalov theorem is very important for obtaining isothermals and for exploring the azeotropic behavior of binary and ternary systems.
a. Using equation 1 for the six binary systems of 138 data point give an overall average absolute deviations (AAD) and an overall percentage mean deviations of 0.271 and 0.323 respectively.
b. Using equation 1 for the two ternary systems of 256 data point give an overall average absolute deviations (AAD) and an overall percentage mean deviations of 0.781 and 0.959 respectively.
References
- McDermott C, Ellis SRM (1965) A Multicomponent Consistency Test. Chemical Engineering Science 20(4): 293-296.
- Hoffman EJ (1964) Azeotropic and Extractive Distillation. In: Hoffman EJ (Ed.), Azeotropic and Extractive Distillation. Interscience Publisher, New York.
- Harold RN (1970) Phase Equilibrium in Process Design. In: Harold RN (Ed.), Phase Equilibrium in Process Design. Wiley-Interscience Publisher, New York.
- Walas SM (1985) Phase Equilibria in Chemical Engineering. Butterworth Publishers, London, UK.
- Marc JA, Martin JP, Thamas FT (1998) Thermophysical Properties of Fluid, An introduction to their prediction. In: Marc JA, Martin JP, Thamas FT (Eds.), Thermophysical Properties of Fluid, An introduction to their prediction. Imperial College Press, first reprint, Uk.
- Malesinski W (1965) Azeotropy and other Theoretical Problems of Vapor-Liquid Equilibrium. In: Malesinski W (Ed.), Azeotropy and other Theoretical Problems of Vapor-Liquid Equilibrium. Interscience, PWN, New York.
- Hala E, Pick J, Fried V, Vilim O (1968) Vapor-Liquid Equilibrium. In: Hala E, Pick J, Fried V, Vilim O (Eds.), Vapor-Liquid Equilibrium. (2nd edn), Pergamon press, London, UK.
- Ohe S (1989) Vapor-Liquid Equilibria Data Book. In: Ohe S (Ed), Vapor- Liquid Equilibria Data Book. Elsevier Scientific Publishing Company, Netherlands, Europe.
- Hirata M, Hoen S, Nagahama K (1975) Computer Aided Data Book of Vapor-Liquid Equilibria. In: Hirata M, Hoen S, Nagahama K(Eds.), Kodansha Limited, Tokyo, Japan.
- Anderson TF, Abrams DS, Grens EA (1978) Evaluation of parameters for Nonlinear Thermodynamic Models. AIChE J 24(1): 20-29.
- Chasib KF (2017) Extraction of Kerogen from Oil Shale using Mixed Reversible Ionic Liquids. The Eighth Jordan International Chemical Engineering Conference, Jordan, pp. 1-6.
- Chasib KF (2013) Study on the effect of adding co-solvent (n-alkoxyethanol) to sulfolane on the toluene extraction. Scientia Iranica 20(6): 1899-1911.
- Farhod CK (2013) Extraction of phenolic pollutants (phenol and p-chlorophenol) from industrial wastewater. Journal of Chemical & Engineering Data 58(6): 1549-1564.
- Khalid FC, Srikanth KP (2017) An Investigation on the Feasibility of Simulating the Distillation Curves and ASTM Distillation Temperature. International Journal of Oil, Gas and Coal Engineering 5(5): 80-89.
© 2018 Khalid Farhod Chasib. This is an open access article distributed under the terms of the Creative Commons Attribution License , which permits unrestricted use, distribution, and build upon your work non-commercially.
Editor In Chief


.jpg)


Signup for Newsletter

Quick Links
 Editorial Board Registrations
 Submit your Article
 Refer a Friend
 Advertise With Us
Our Recent Edition

.jpg)


Top Editors


.jpg)


.bmp)
.jpg)
.png)
.jpg)


.jpg)


.png)

.png)


.png)


Financial Support

Sponsors

Latest e-Books

Latest Video

 a Creative Commons Attribution 4.0 International License. Based on a work at www.crimsonpublishers.com.
Best viewed in
a Creative Commons Attribution 4.0 International License. Based on a work at www.crimsonpublishers.com.
Best viewed in